This post goes out as an email to our subscribers every day and is posted for free here around 2 PM ET. To get your real-time copy, sign up for the free or premium version here: Opening Print Subscribe.
Follow @MrTopStep on Twitter and please share if you find our work valuable!

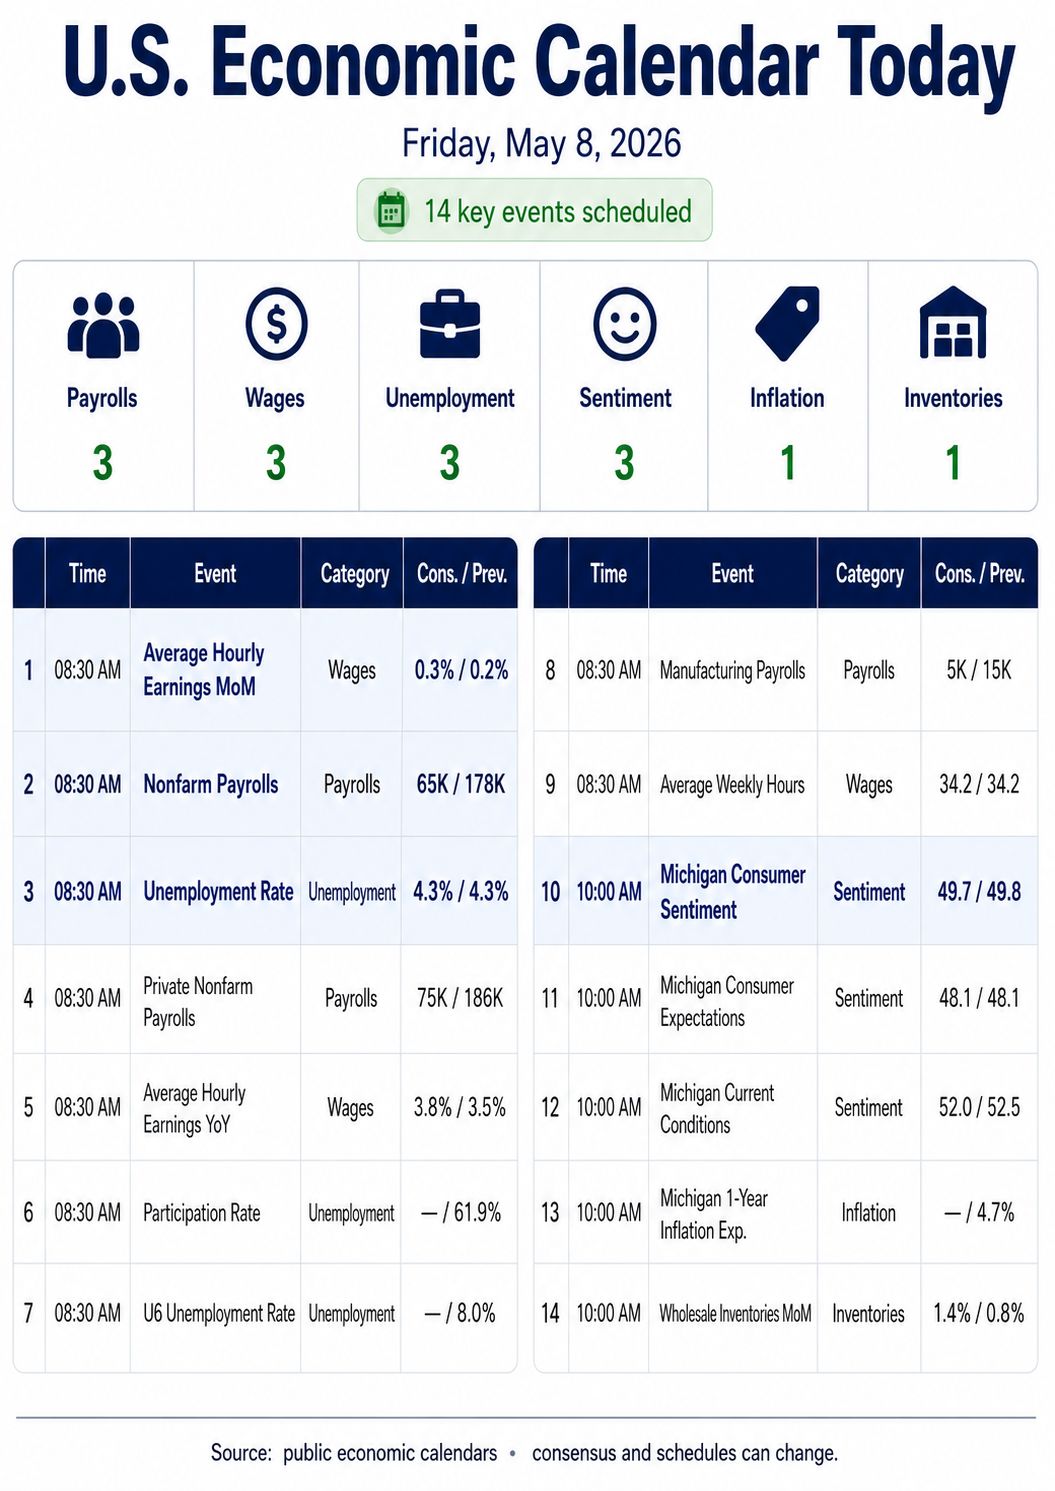
Amid the renewed chaos of naval skirmishes in the Gulf, surging gold and oil prices, and a rebounding dollar, the April jobs report has curiously slipped under the radar. Even as Treasury yields snap their losing streak and a hantavirus outbreak makes headlines, the market seems to be ignoring the fact that payroll growth is expected to plummet to 55,000 from March’s 178,000.
Furthermore, with unemployment holding at 4.3% and consumer credit jumping to 3.2%—up significantly from last year—the Fed has little incentive to rush into interest rate cuts. If you’re wondering what all these conflicting signals actually mean for the economy, I’ll be honest: I don’t know, and nor does anyone else.

Follow The Money
I think there are a lot of people who feel very disconnected from what’s going on in the world, and I am one of them. None of the news is good, but that just doesn’t matter to the markets. The only trade that works is buying into the negative headlines when the market drops. I had a 47-point rally in the ES at yesterday’s low, and just after 9:00 PM, it was less than 10 points.
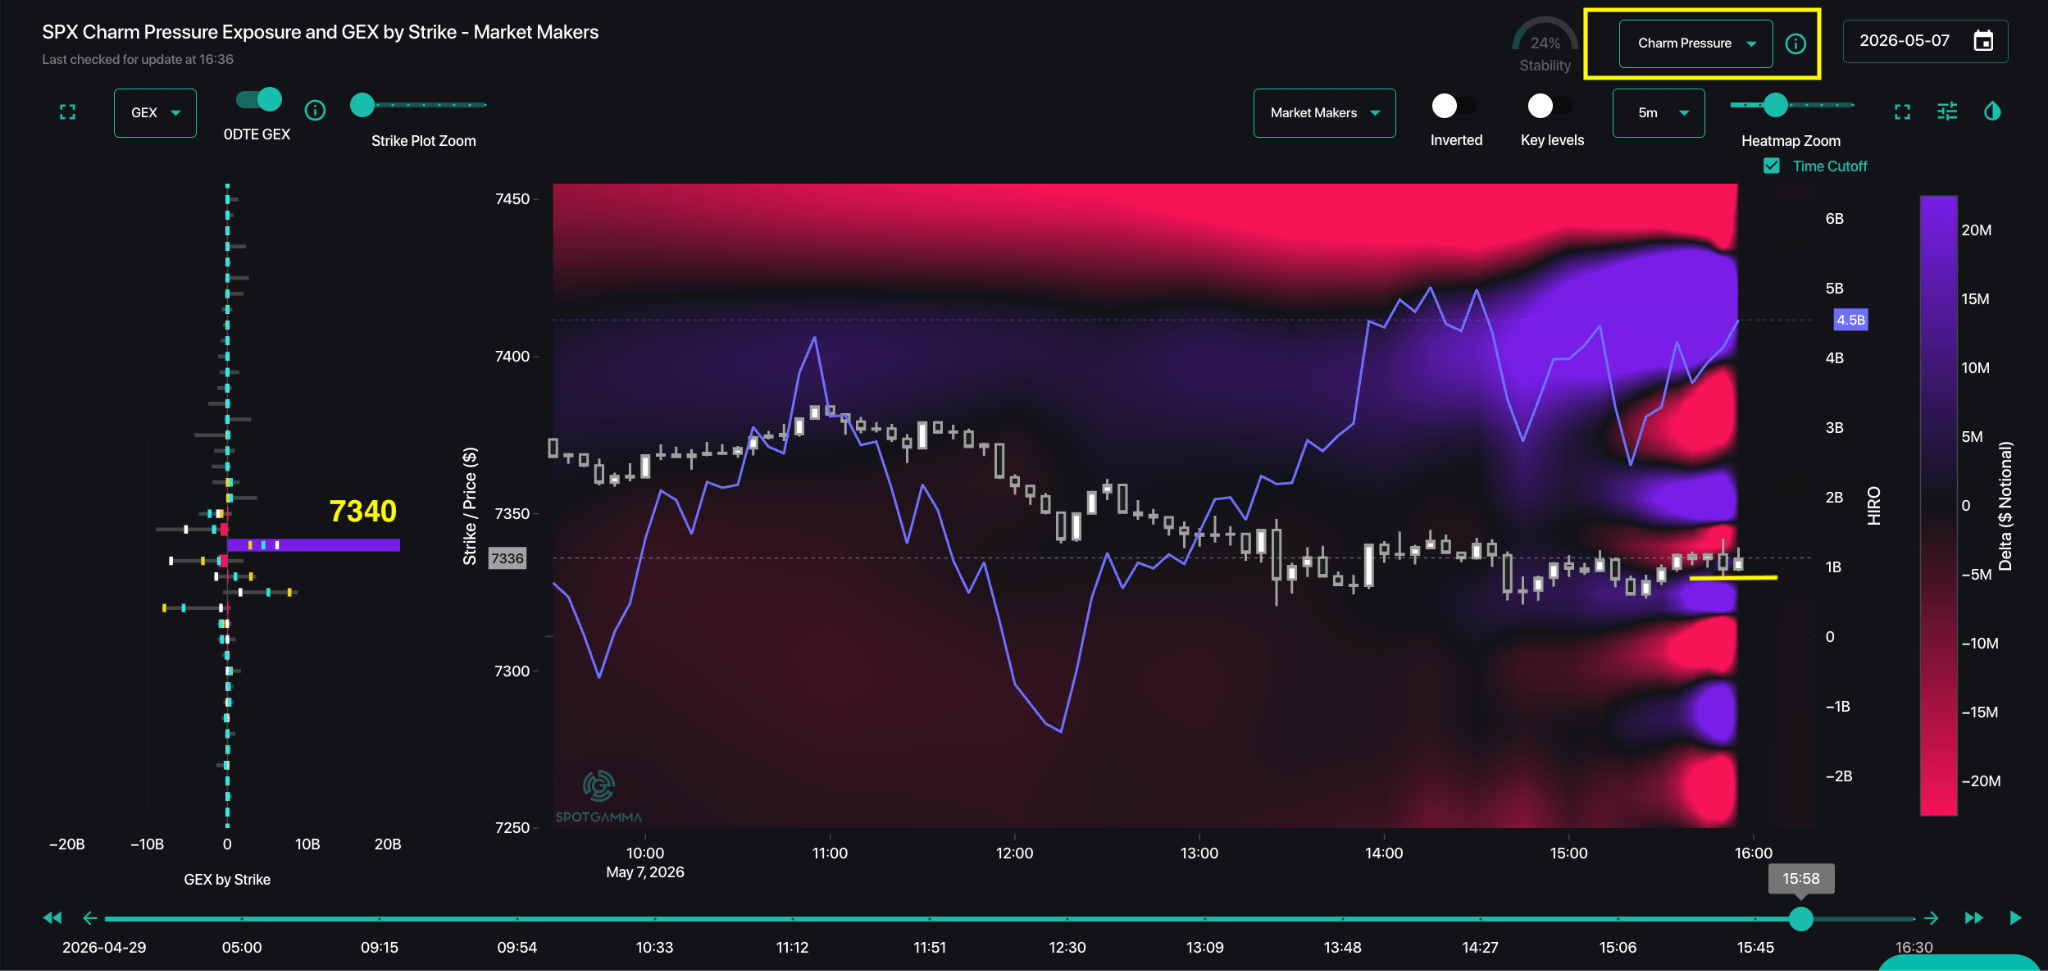
I posted this on the IMPro chat:
The markets defy logic, and I think a big part of this has to do with all the late-day MOC buying we have been seeing. As of early May, stock market and mutual fund inflows are characterized by strong momentum into ETFs, particularly bond ETFs, which saw nearly 30% higher flows in Q1 2026 compared to Q1 2025. Total U.S. mutual fund and ETF inflows hit a monthly high of $151.16 billion in April, with strong weekly inflows of $36.74 billion reported for the week ending April 22, 2026. In early May, U.S. stocks and ETFs saw approximately $9.85 billion in total net inflows on a single peak day, May 5, with roughly $2.46 billion specifically entering U.S. equity funds. This momentum follows a massive April, where U.S.-listed ETFs pulled in between $171.4 billion and $178 billion, the second-highest monthly total on record.
Our lean: I think the paragraph above explains why the markets do not care about the Middle East war. Sure, if oil jumps sharply, the ES and NQ will fall, but the safety net is all the money piling into the U.S. stock markets. It’s like I have said for many years… if you want to know where the S&P is going, follow the money. I can’t rule out another drop, but if the ES gaps down hard after the jobs number and oil isn’t up sharply, I think you have to buy it. Remember, it’s the week-two options expiration, and there could be some late-day risk-off going into the weekend. You can take it from there…
Sorry, Claude was on vacation last night for the ES levels. Have a good weekend.


Get instant access to our partners’ real-time market data and insights not available anywhere else. Here is last night’s Founder’s note getting you ready for today’s market and explaining the constraints in yesterday’s market. – MrTopStep
Founder’s Note:
PM Note
The equity market pulled back on Thursday following one of the strongest rallies in the past month, with semiconductor names also cooling (SMH -1.76%).
SPX traded within an ~85bps intraday range and closed at 7,337 (-0.38%). The volatility complex remained relatively muted, with VIX closing at 17 (-1.9%) and VVIX at 94 (-0.1%).
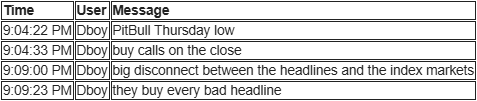
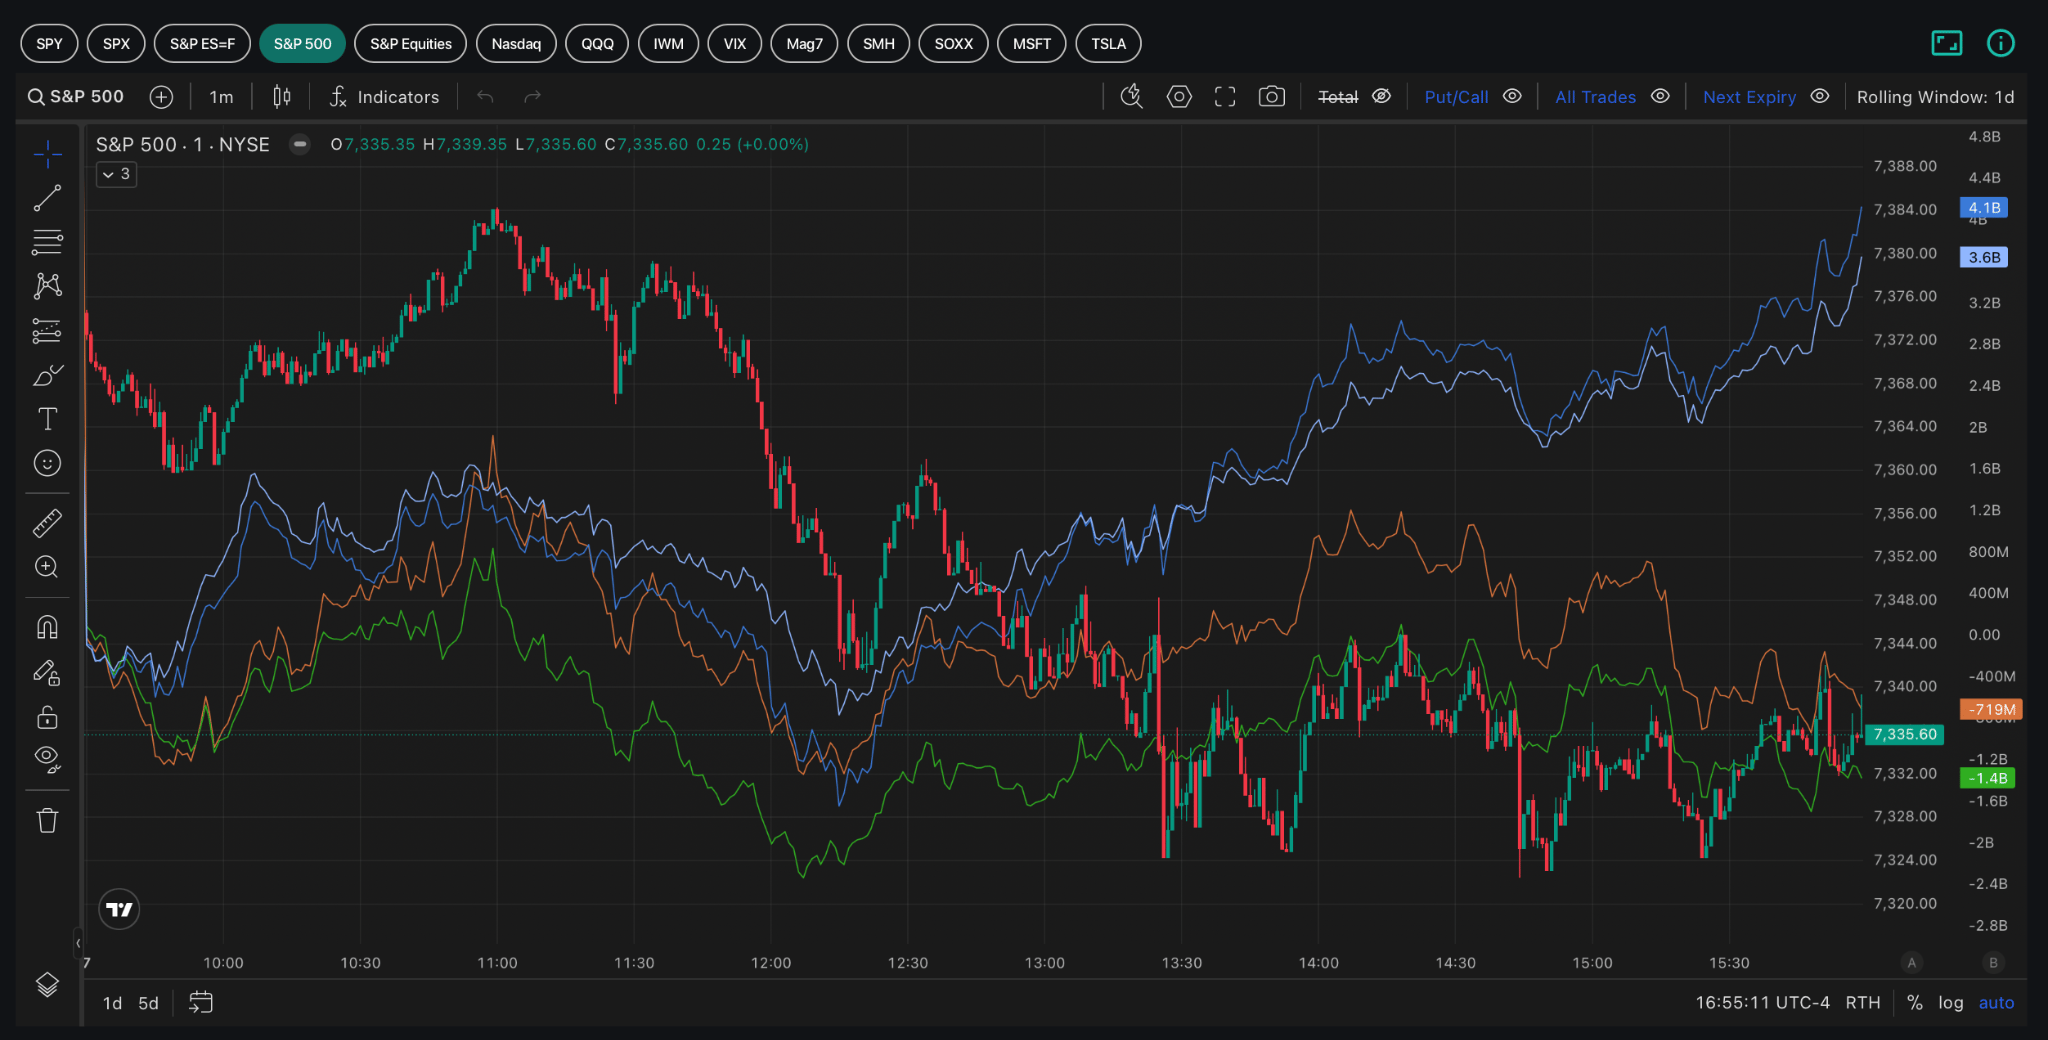
The “Seek and Destroy” algo was active intraday, with price responding to shifts in the 99th percentile 0DTE gamma strike. After SPX pushed up toward 7,380 around 11:00am ET, the 99th percentile gamma strike rolled lower to ~7,355, which coincided with a reversal in S&P 500 HIRO from the session highs.
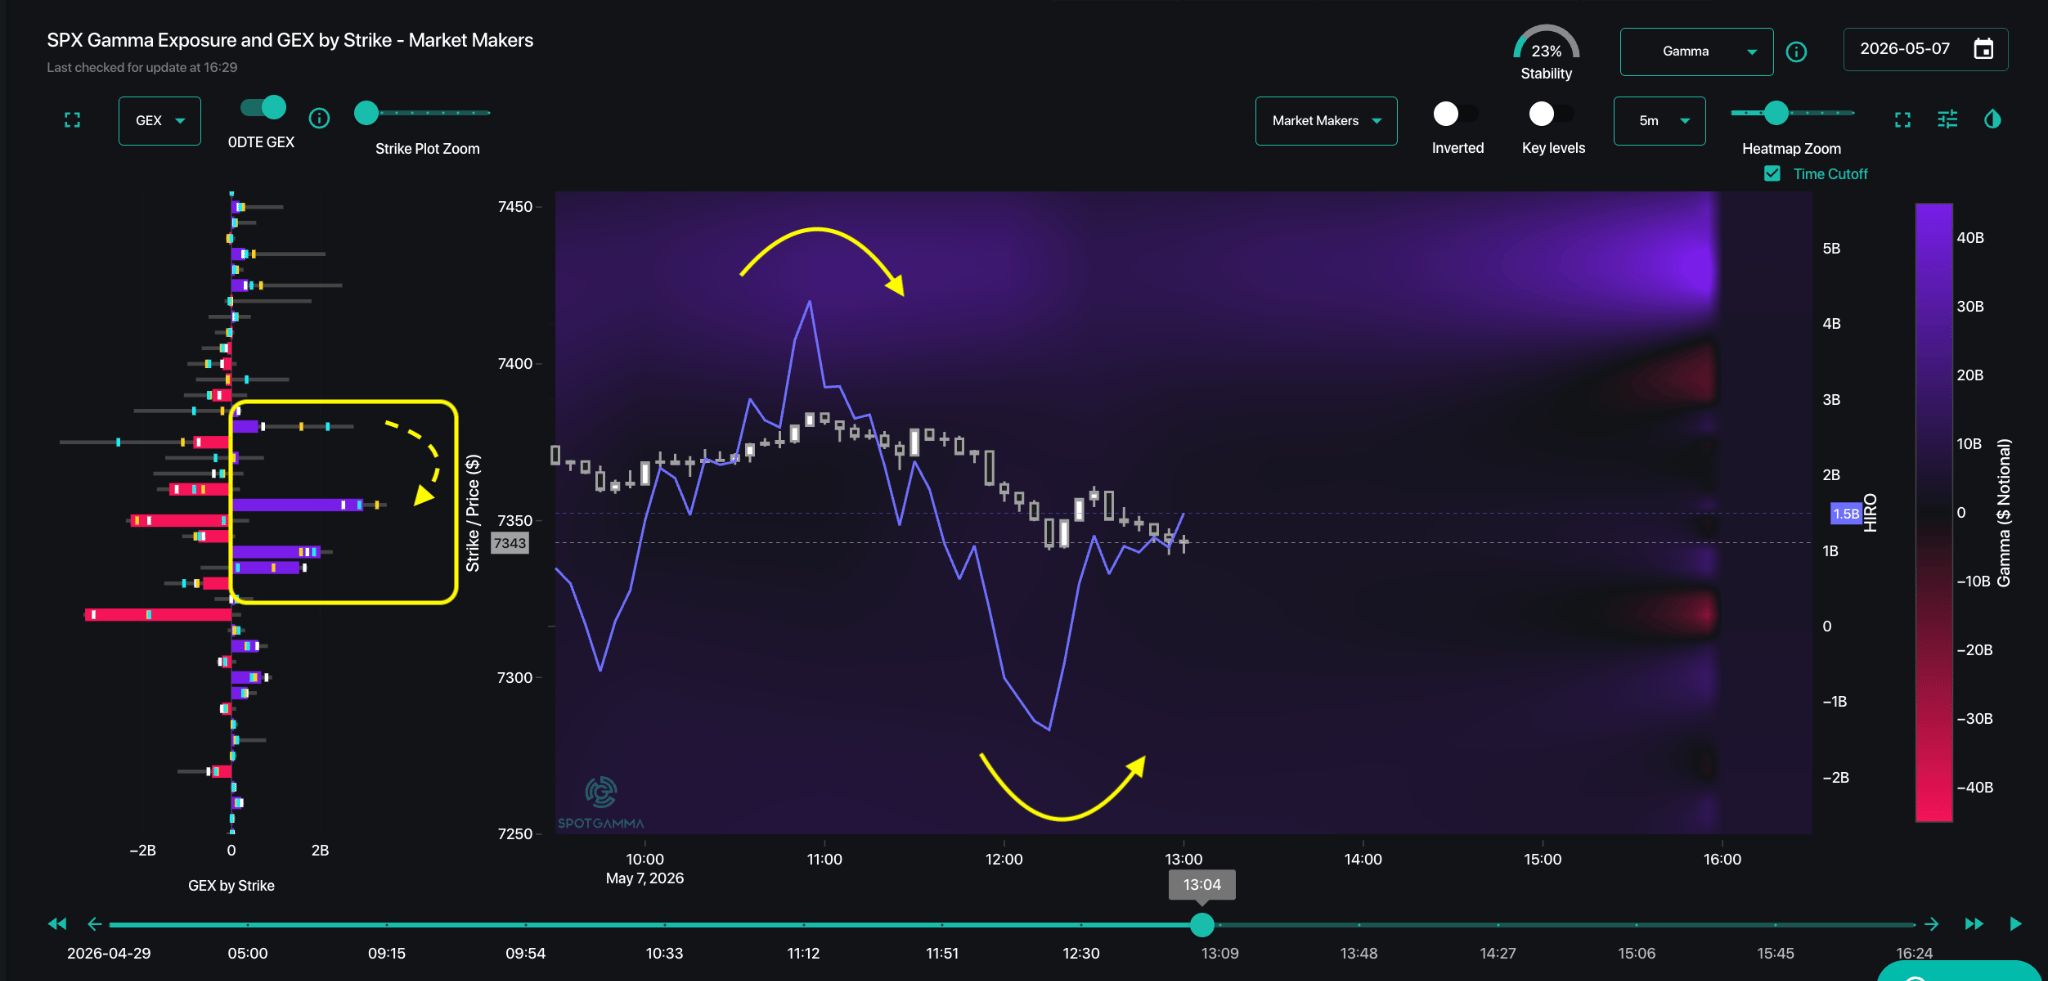
Switching from the GEX lens to the Net OI lens, dealer positioning showed short puts concentrated around the 7,320 area, which aligned with the session low.
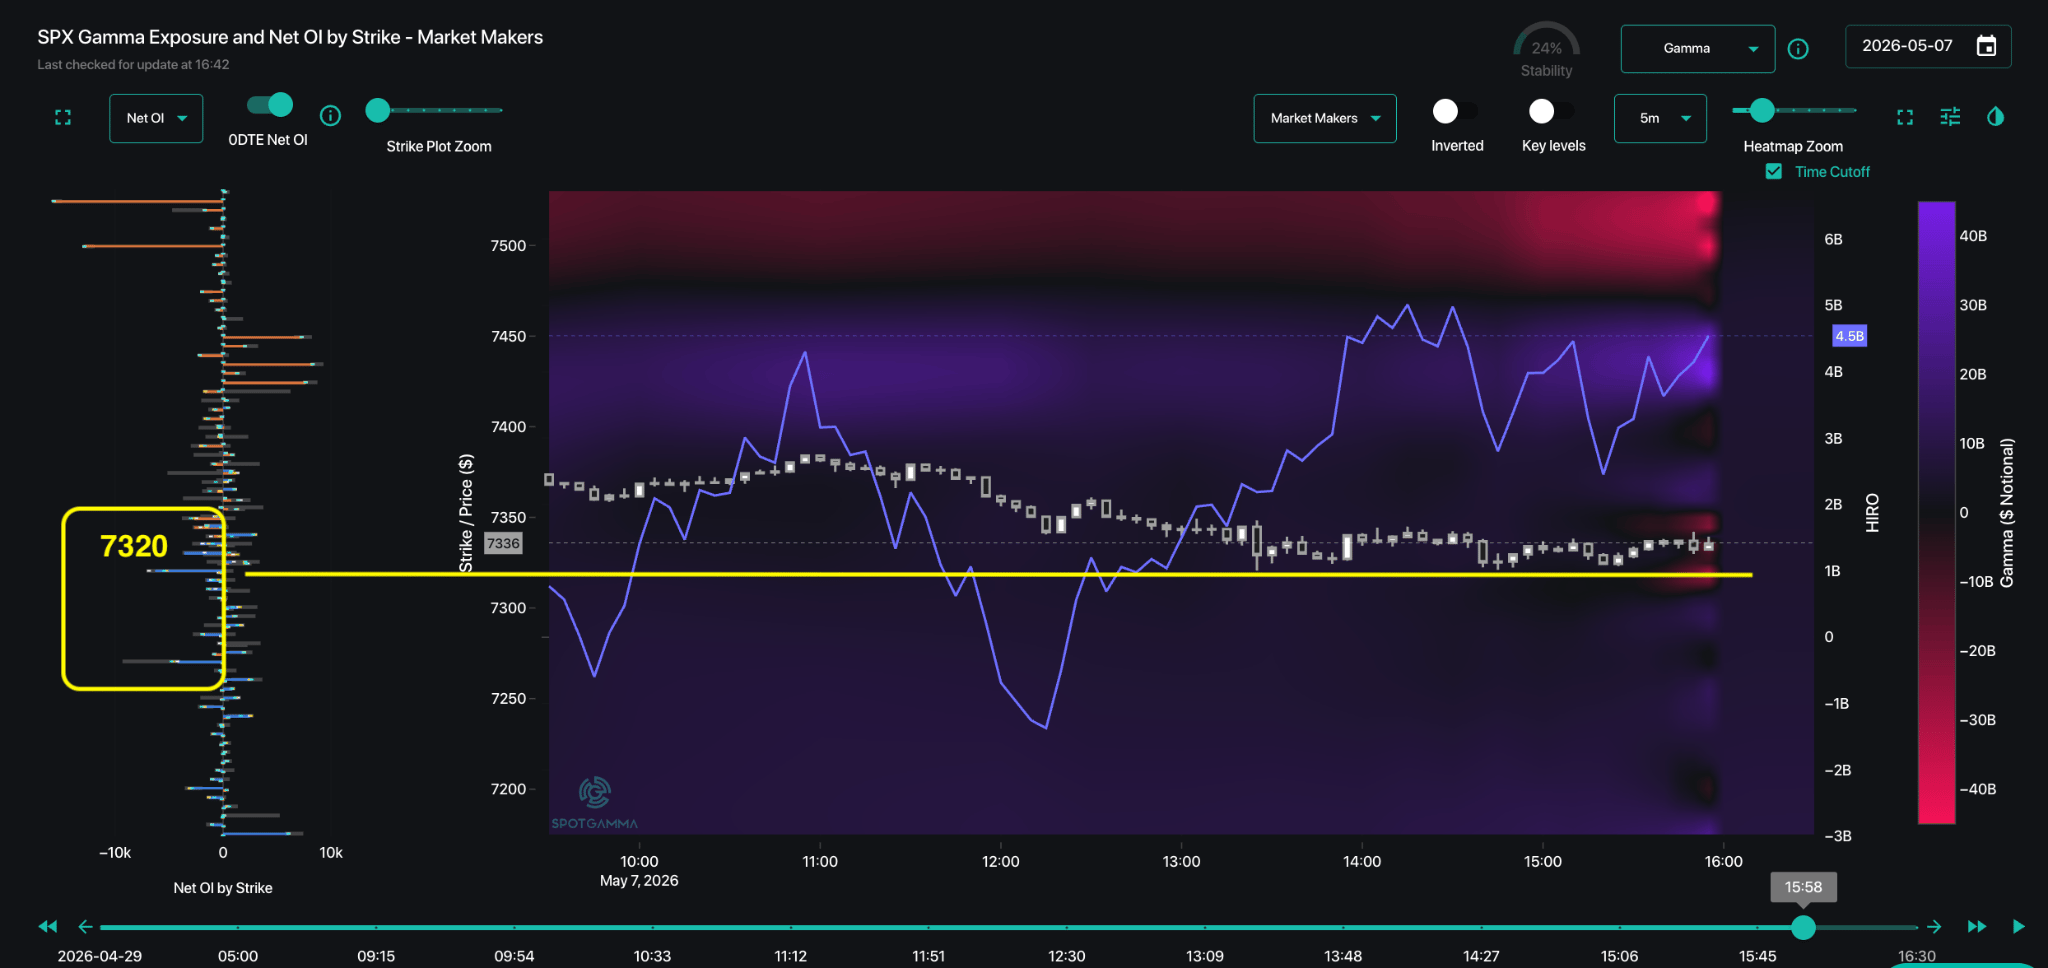
Into the close, the 99th percentile gamma level shifted again to ~7,340, aligning with end-of-day charm hedging pressure and acting as a “pinning” level. Under the charm heatmap, blue shows buying pressure, and red shows selling pressure.
S&P 500 HIRO registered approximately +$4B in net delta on the day, driven primarily by ~$4.1B of put selling and ~$0.7B of call selling. These flows were largely concentrated in 0DTE options, suggesting more tactical positioning rather than longer-term directional exposure. As a reminder, HIRO tracks cumulative delta from aggressive options trades, offering a real-time view of directional pressure from options flow .
In contrast, S&P equities saw roughly -$2B in HIRO flow, led by ~$1.5B of put buying and ~$0.5B of call selling.
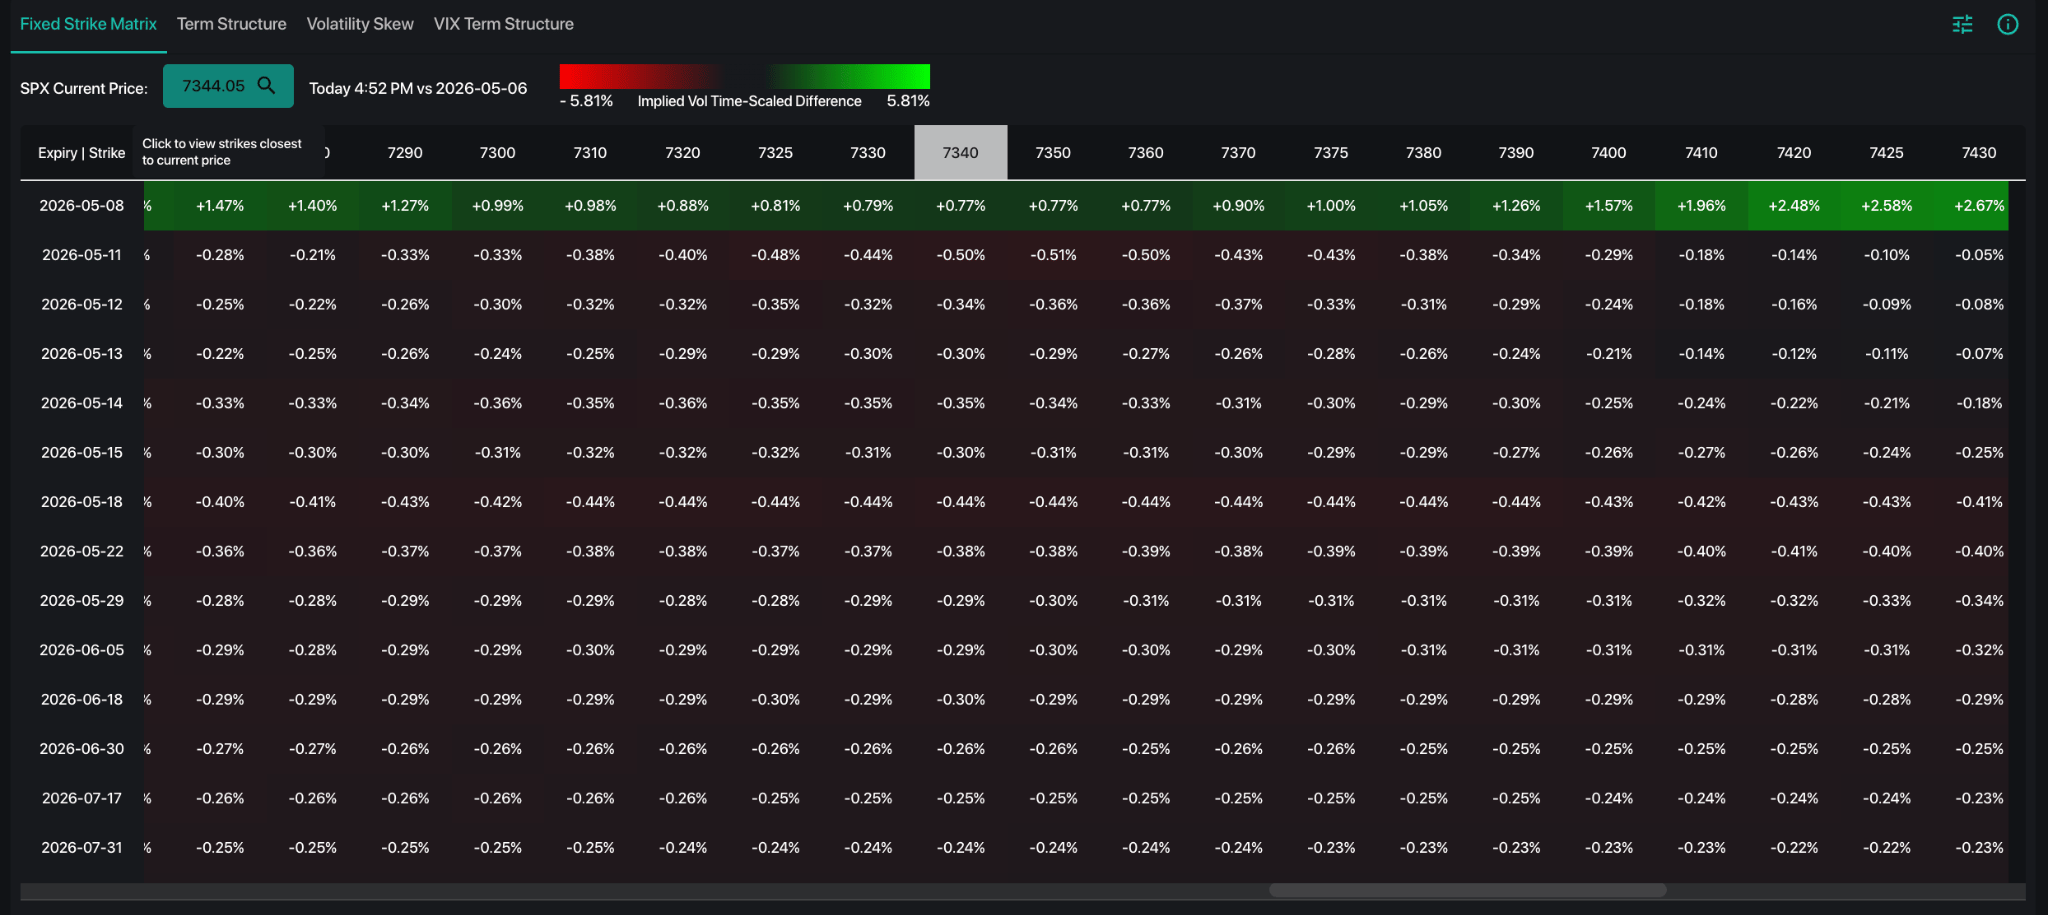
Despite the modest market pullback, fixed strike implied volatility declined slightly except for tomorrow’s expiration. As noted in the AM Note, there appears to be some volatility premium tied to the upcoming NFP release. If NFP data does not have any surprise, then the shorter dated <May OPEX options will start to lose a lot of IV. In that scenario, vol sellers might re-engage into next Friday’s OPEX, potentially driving a vanna-induced rally.
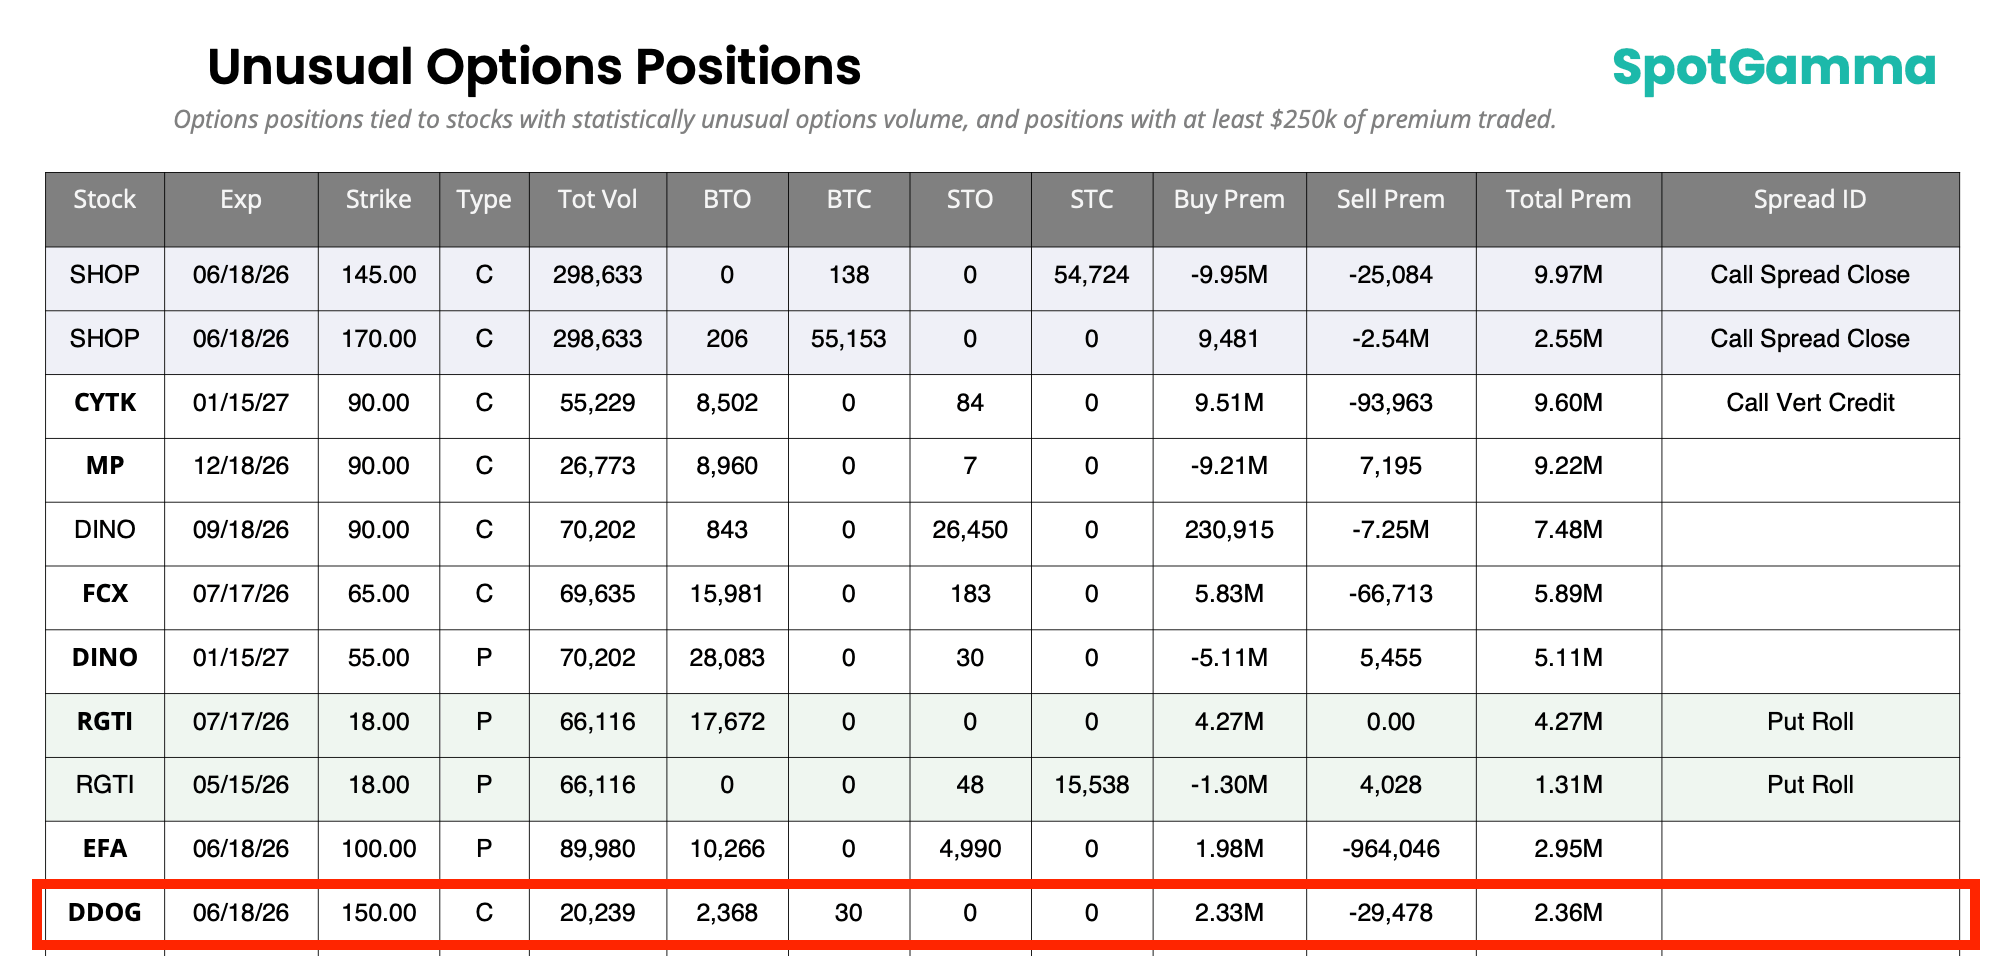
FlowPatrol highlights of the day is Datadog stock (DDOG), which rallied +31% on the day post earning. We flagged the trade in yesterday’s FlowPatrol, where 2368 lots DDOG June 18 150 call bought to open with 2.3 million premium paid. These calls rallied from $10 to $40 in one day, which is around 300% gains.
Notable flows of the day:
Microsoft (MSFT): Bullish activity observed with ~12k August 390 calls traded. MSFT closed at 421 (+1.65%), above the key gamma level of 420.

All TenTen Capital LLC DBA SpotGamma materials, information, and presentations are for educational purposes only and should not be considered specific investment advice nor recommendations. Futures, foreign currency and options trading contains substantial risk and is not for every investor. An investor could potentially lose all or more than the initial investment. Risk capital is money that can be lost without jeopardizing one’s financial security or lifestyle. Only risk capital should be used for trading and only those with sufficient risk capital should consider trading. Past performance is not necessarily indicative of future results. VIEW FULL RISK DISCLOSURE https://spotgamma.com/model-faq/disclaimer/

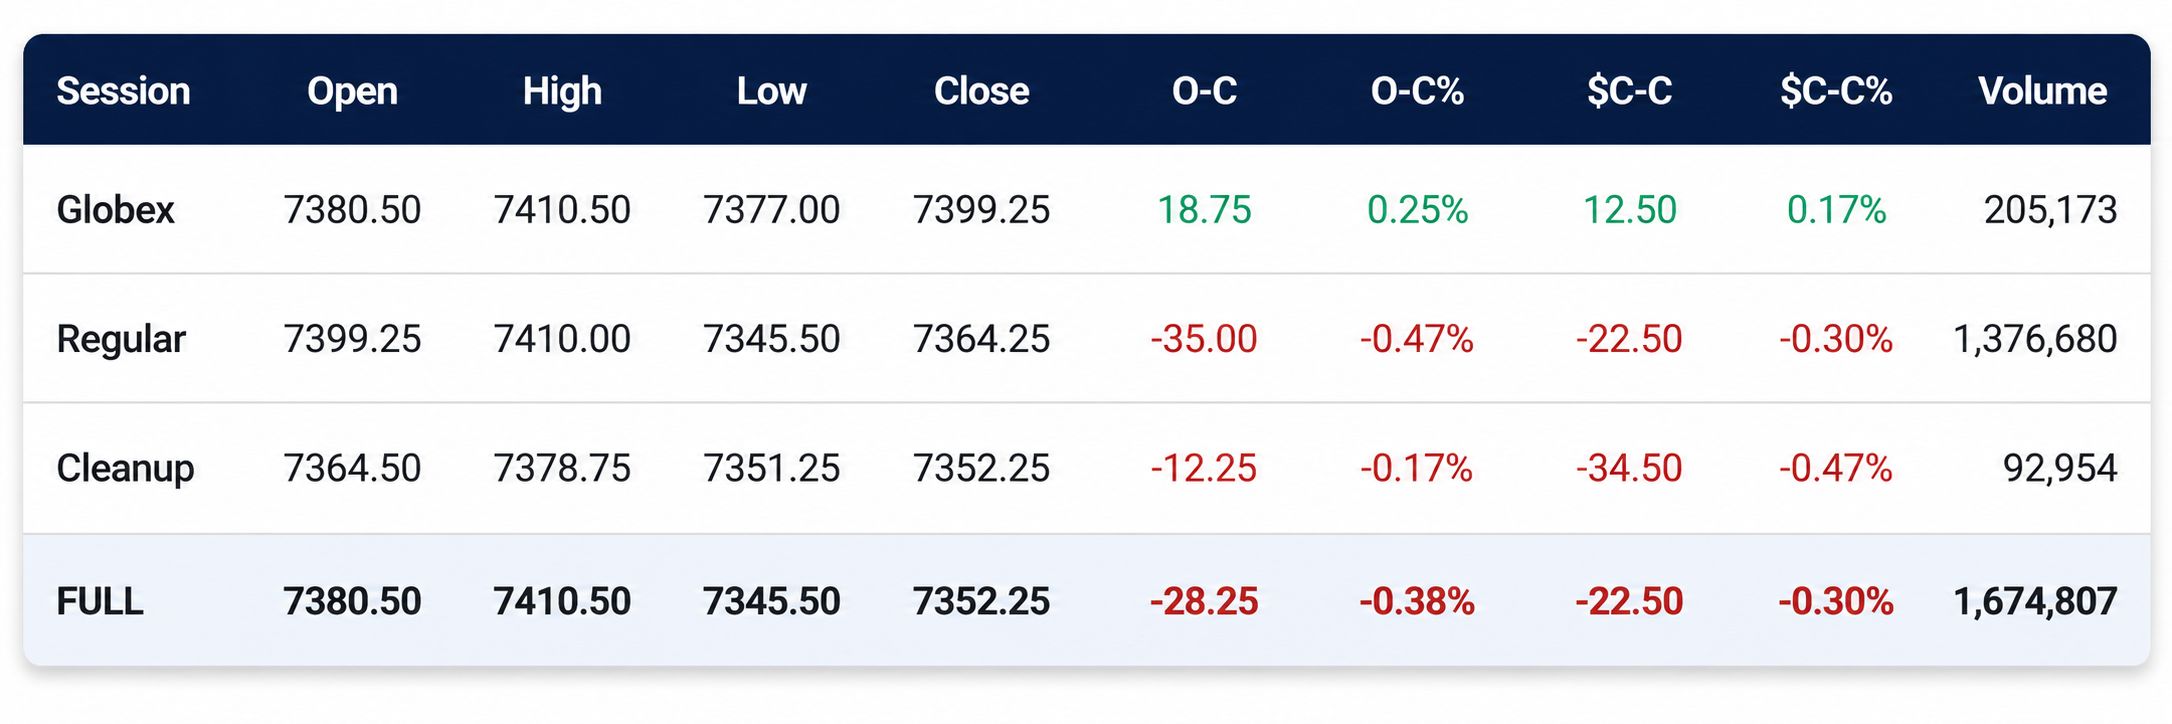
It was another day and another up opening. The ES made a Globex low of 7377.00, traded up to 7410.50, and opened Thursday’s regular session at 7399.25, up 12.5 points or +0.17%.
After the open, the ES traded 7400.25 and sold off 16.5 points down to 7383.75. It then did a sideways back-and-fill up to 2 ticks off the Globex high at 7410.00 at 11:00. It sold off down to 7391.25 at 11:25, rallied up to a lower high at 7404.75, and then sold off 39 points down to 7365.75 at 12:20. It rallied 20.75 points up to 7386.50 at 12:30, then sold off 40.75 points down to 7345.75 at 1:25.
From there, the ES made a series of higher lows and rallied 24.75 points up to 7370.50 at 2:05. It sold off 25.5 points down to 7345.00 at 2:45, rallied 18.5 points up to 7363.50 at 3:40, and traded 7361.00 as the 3:50 imbalance showed $2.8 billion to buy. It then ripped up and traded 7378.75 on the 4:00 cash close.
After 4:00, the ES dropped 26.75 points down to 7352.00 at 4:49 after this headline hit the tape: “US MILITARY JUST CARRIED OUT STRIKES ON IRAN’S QESHM PORT AND BANDAR ABBAS – FOX NEWS.” It traded up to 7362.00 at 4:45, and settled at 7363.00, down 26.50 points or -0.36%.
The NQ settled at 28,682.25, down 34 points or -0.12%; the YM settled at 49,700, down 334 points or -0.67%; and the RTY settled at 2,848.90, down 46.30 points or -1.60% on the day.
In the end, I am not surprised at all about the uptick in the US/Iran conflict. In terms of the ES’s overall tone, it started out as another up day on a list of many, but as the index markets started to fall as oil rose and the headlines started hitting, it weakened but never really fell apart. In terms of the ES’s overall trade, volume was higher at 1.676 million contracts traded.
I am not going to do a big piece for the OP today; I am beat and don’t know that there is anything to say that we don’t already know. I guess the war isn’t over until the “fat lady” sings, and she hasn’t sung yet!

Market-On-Close Recap
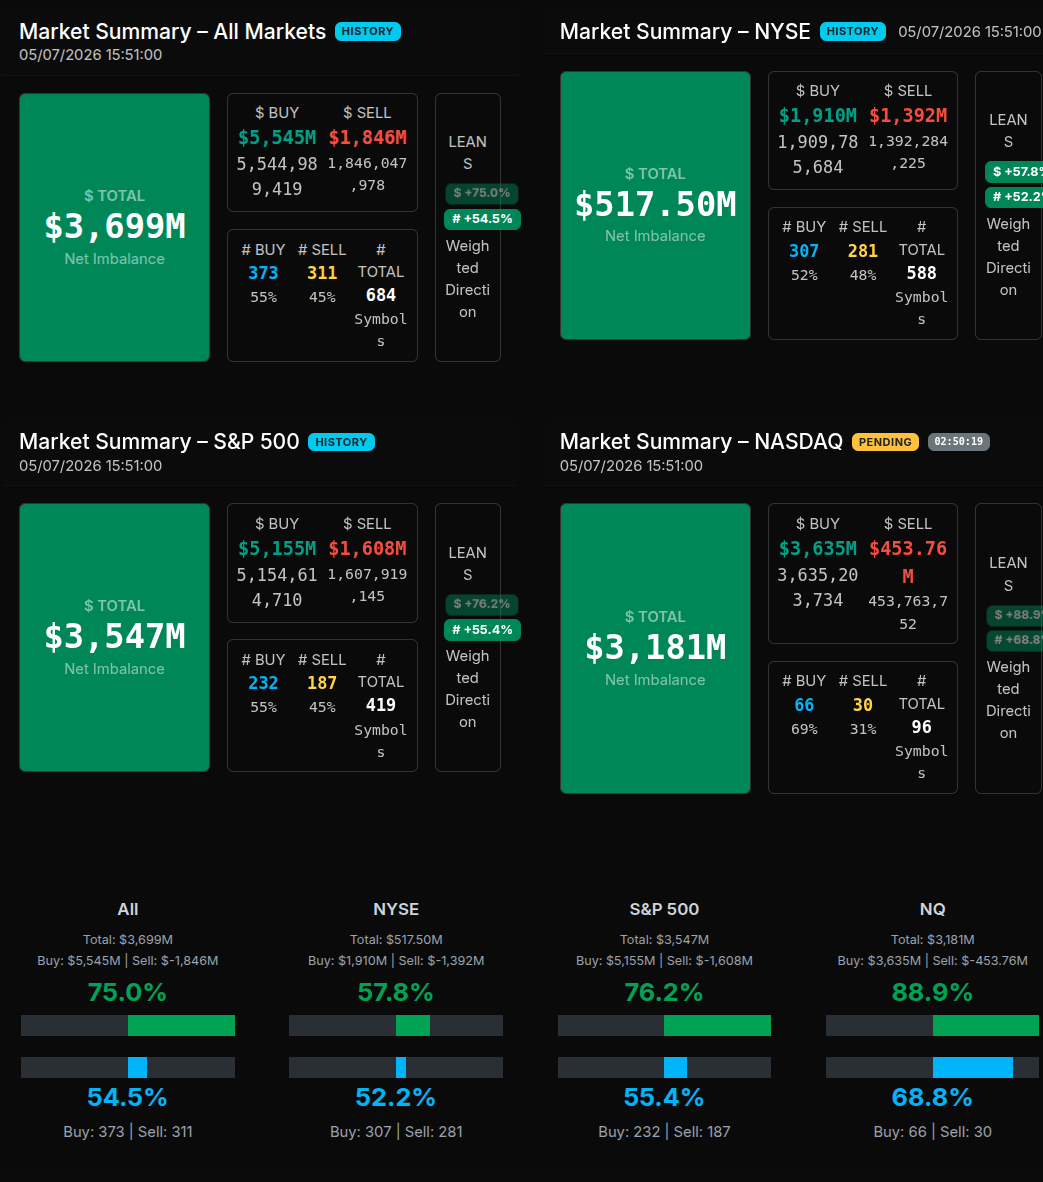
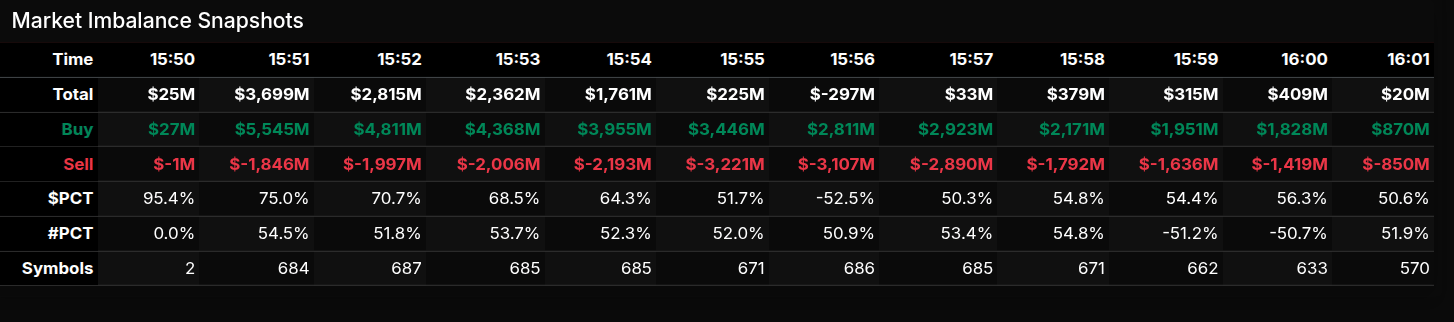
The closing MOC opened with a strong buy imbalance and stayed positive through the close, but the character shifted from wholesale buying into a more rotational close. At 15:51, the all-market imbalance surged to $3.699B to buy, with $5.545B buy versus $1.846B sell. That produced a +75.0% dollar lean and +54.5% symbol lean across 684 symbols. The S&P 500 was even stronger, showing $3.547B net to buy with a +76.2% dollar lean, while Nasdaq was the standout at $3.181B net buy and an aggressive +88.9% dollar lean with a +68.8% symbol lean. Those Nasdaq readings were notable because both dollar and symbol participation were above the +66% threshold, pointing to a wholesale buy program rather than simple rotation.
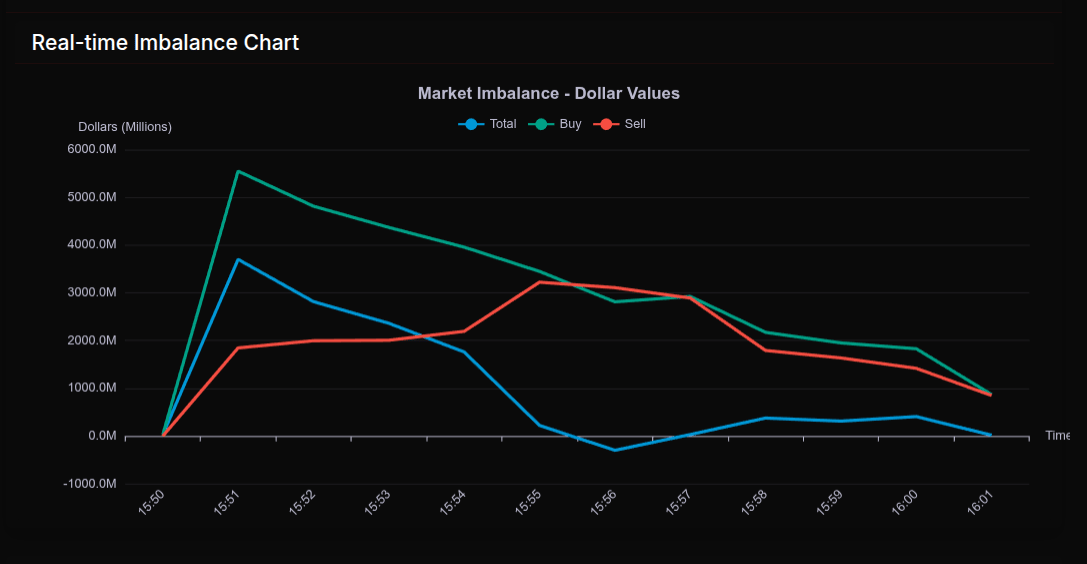
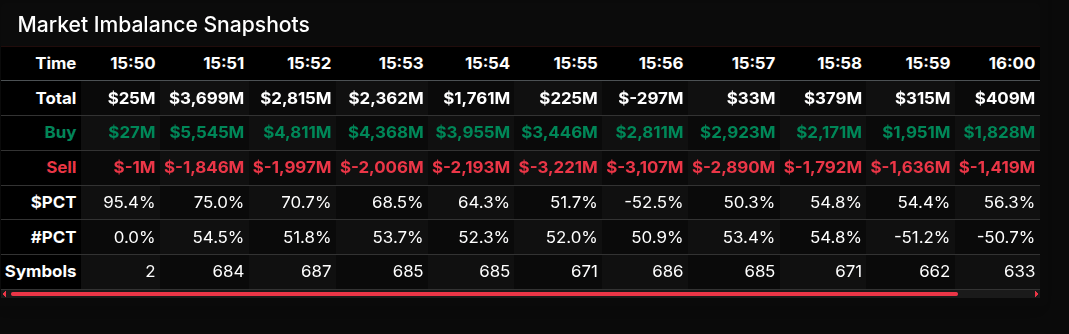
The transition after the open was important. The imbalance peaked early at 15:51, then faded steadily: $2.815B at 15:52, $2.362B at 15:53, and $1.761B at 15:54. By 15:55 the market was nearly neutral at $225M, then briefly flipped sell at 15:56 with a -$297M imbalance and -52.5% dollar lean. From there, the close rebuilt modestly positive, finishing around $409M at 16:00 and only $20M at 16:01. That late fade showed the early buy pressure was absorbed rather than expanded.
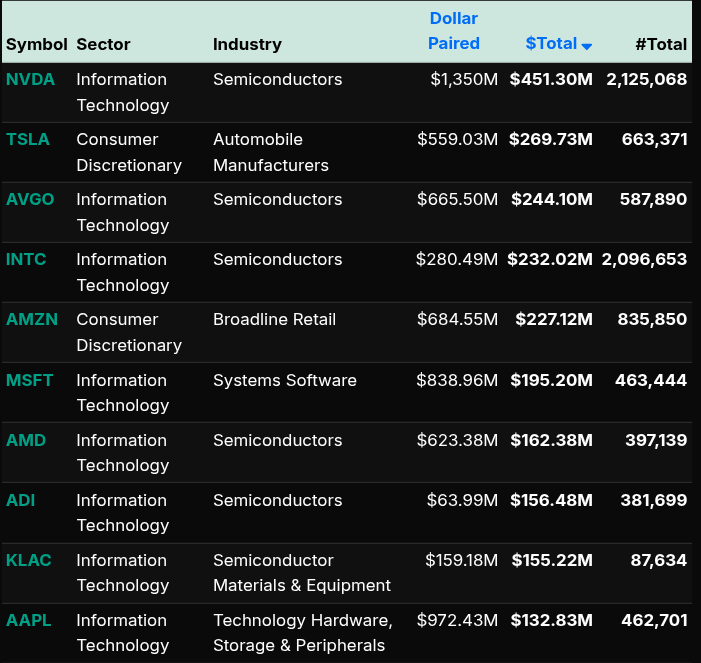
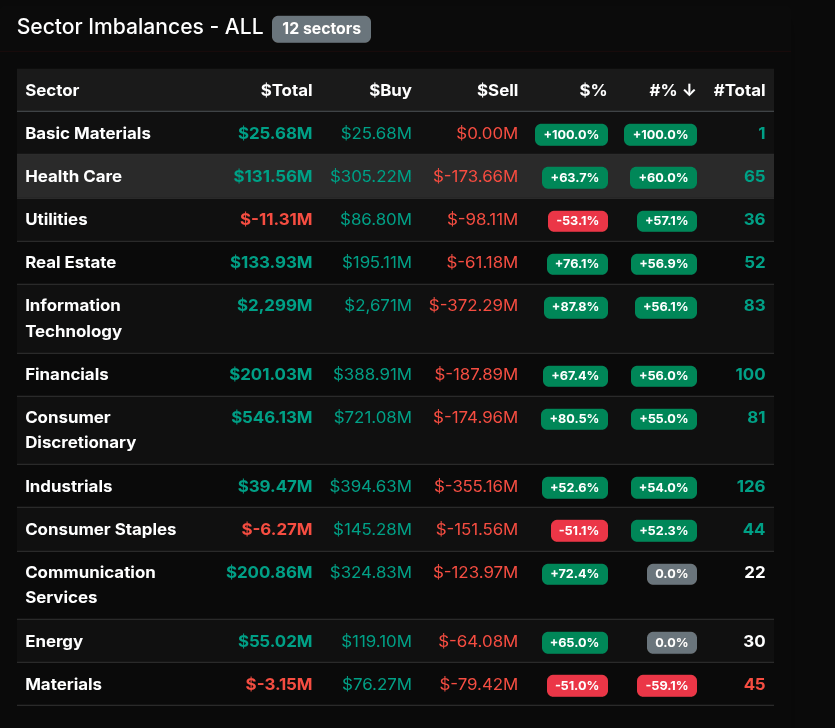
Sector leadership was concentrated in growth and cyclical groups. Information Technology led with a massive $2.299B net buy and +87.8% dollar lean, driven by NVDA, AVGO, INTC, MSFT, AMD, ADI, KLAC, and AAPL. Consumer Discretionary added $546M with an +80.5% lean, led by TSLA and AMZN. Real Estate showed a notable +76.1% lean, while Communication Services posted +72.4%, helped by GOOG.
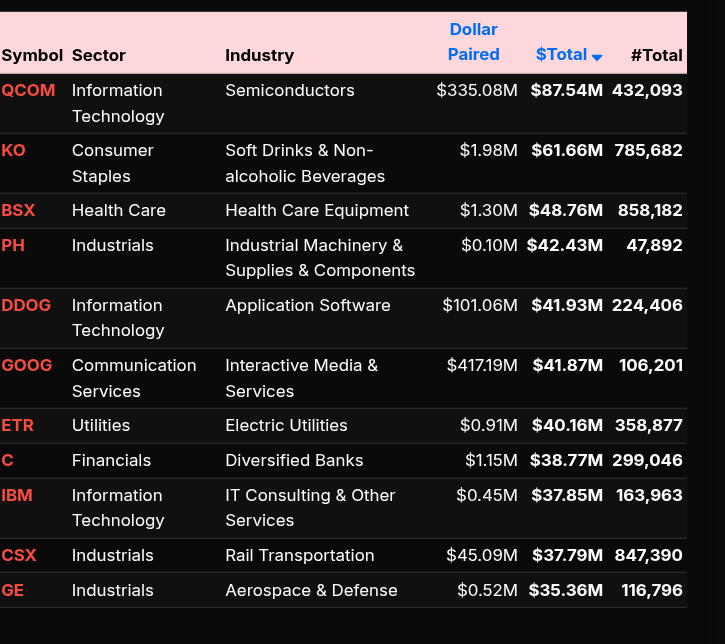
On the sell side, Utilities, Consumer Staples, and Materials were the main pressure points, with dollar leans near -51% to -53%, more rotational than wholesale. Individual sell names included QCOM, KO, BSX, PH, DDOG, GOOG, ETR, C, IBM, CSX, and GE, but the broader message was clear: the MOC opened as a strong technology-led buy imbalance, briefly transitioned toward neutral/sell, then closed as a reduced but still positive imbalance.

/

ES Levels
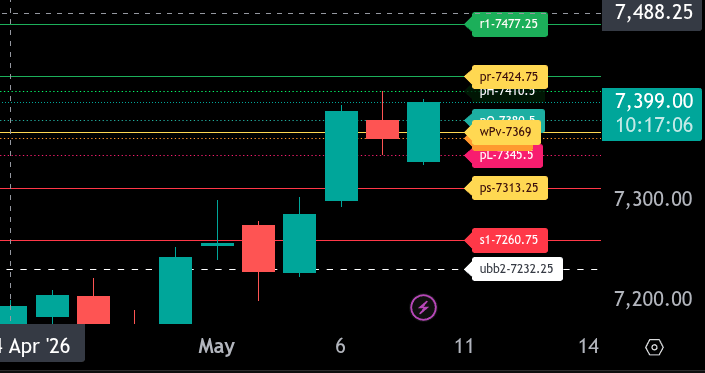
The bull/bear line for the ES is at 7369.00. This is the key sentiment level for today. As long as ES holds above 7369.00, the short-term tone remains constructive and buyers can continue to look for pullbacks to hold above this area.
Currently, ES is trading around 7399.50, placing price above the bull/bear line and showing early strength in the current Globex session. Immediate support sits at 7380.50, followed by 7369.00 and 7363.00. If price starts losing these levels, downside pressure could build toward 7345.50 and then 7313.25, which is the lower range target for today.
On the upside, the first resistance comes in at 7410.50. A sustained move above 7410.50 would open the door for a test of 7424.75, which is the upper range target for today. If buyers can clear and hold above 7424.75, the next upside objective is 7477.25.
Overall, ES is bullish while holding above 7369.00, with 7410.50 and 7424.75 as the key upside tests. A failure back below 7369.00 would weaken the setup and shift attention toward 7345.50 and 7313.25 for downside continuation.
NQ Levels
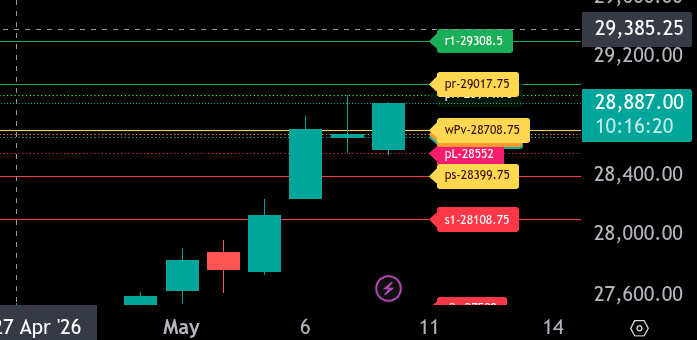
The bull/bear line for the NQ is at 28708.75. This is the key pivot for today’s sentiment. As long as price remains above this level, the short-term bias stays bullish and dips into support can be viewed as potential buying opportunities.
Currently, NQ is trading around 28886.50, holding above the bull/bear line and showing strength in the current Globex session. The first upside resistance is 28944.75, followed by the upper range target at 29017.75. If buyers can sustain trade above 29017.75, the next major upside level is 29308.50, with 29323.75 also acting as nearby upper resistance.
On the downside, initial support comes in at the bull/bear line of 28708.75. Below that, support levels are clustered at 28682.25 and 28662.75. If NQ loses this zone, the next downside level is 28552.00, followed by the lower range target at 28399.75. A break below 28399.75 would weaken the structure and open the door toward 28108.75.
Overall, NQ remains constructive while holding above 28708.75. Bulls want to defend that level and push through 28944.75 to make a clean run toward 29017.75. A failure back below 28708.75 would shift the tone more defensive and put the lower support cluster back in play.

Fair Values for May 8, 2026
-
SP: 23.55
-
NQ: 109.12
-
Dow: 91.73
Daily Breadth Data 📊
For Thursday, May 7, 2026
• NYSE Breadth: 29% Upside Volume
• Nasdaq Breadth: 37% Upside Volume
• Total Breadth: 34% Upside Volume
• NYSE Advance/Decline: 37% Advance
• Nasdaq Advance/Decline: 37% Advance
• Total Advance/Decline: 37% Advance
• NYSE New Highs/New Lows: 131 / 33
• Nasdaq New Highs/New Lows: 360 / 107
• NYSE TRIN: 1.45
• Nasdaq TRIN: 1.02
Weekly Breadth Data 📈
Week Ending Friday, May 1, 2026
• NYSE Breadth: 54% Upside Volume
• Nasdaq Breadth: 54% Upside Volume
• Total Breadth: 54% Upside Volume
• NYSE Advance/Decline: 54% Advance
• Nasdaq Advance/Decline: 53% Advance
• Total Advance/Decline: 53% Advance
• NYSE New Highs/New Lows: 317 / 80
• Nasdaq New Highs/New Lows: 651 / 340
• NYSE TRIN: 1.00
• Nasdaq TRIN: 0.97

This Week’s High Importance

Polaris Trading Group Summary – For Thursday, May 7, 2026
Early market tone
-
The room noted a nice 20-point overnight response from the D-level.
-
David reminded the group: “MARKETS NEVER SLEEP.”
-
Members checked in with good audio/video and morning greetings.
Trader mindset lesson
-
A positive takeaway came from the prior day’s absence:
-
One member noted they had to engage their own thought process and take responsibility.
-
-
This reinforced an important PTG lesson: traders should use David’s framework, but still build independent decision-making skills.
Morning trade discussion
-
The room discussed whether the market was short, ranging, or probing.
-
There was some discussion around the A10 / AR10 level, with members comparing data and noting different readings.
-
David clarified that the preferred EMA setting was 21.
-
DanV added a useful lesson:
-
PTG previously used the 8 EMA.
-
The group switched to the 21 EMA during Covid volatility.
-
The 8 EMA was more prone to premature flips, while the 21 EMA helped reduce false signals.
-
Market structure and bias
-
The market was described as quiet and stagnant during the morning.
-
Ram noted a bullish lean, but also pointed out price was in the middle, meaning no trade.
-
This was a strong discipline reminder: having a directional lean is not the same as having a valid trade location.
Positive trade highlight
-
At 10:53 AM, PTGDavid called out that the ES Open Range triggered long.
-
The market then pushed higher, with Dr. Dean commenting, “Up up and away.”
-
This was the clearest positive trade event in the chat.
Trade management and education
-
David and the room discussed how to think about slow grind-up price action.
-
Ram worked through the idea that slope up in discount with RSPR can provide a good entry.
-
Members identified strength buyers and discussed buying dips quickly.
-
Slatitude39 shared a positive example:
-
Took a long around 87.75 as a PKB play.
-
The pullback was higher than the prior level, suggesting buyers were stepping in.
-
Midday market read
-
Around 11:47 AM, David noted that the upside move appeared to have concluded.
-
He said the market was likely entering the consolidation phase of the day.
-
This helped frame the transition from active upside opportunity to a more cautious midday environment.
Afternoon target
-
Later, Slatitude39 posted that the 7357.13 target was on deck.
-
The target was tagged at 1:26 PM, providing another positive execution/market-read highlight.
Key lessons learned
-
Use the PTG tools and levels, but take responsibility for your own thought process.
-
Avoid trades when price is in the middle of the range, even if there is a bullish or bearish lean.
-
The 21 EMA helps reduce premature flips compared with a faster EMA.
-
Slow grind-up markets can reward disciplined dip-buying when structure, slope, and alignment support the entry.
-
Once the upside move is complete, recognize consolidation and avoid forcing trades.
DTG Room Preview – Friday, May 8, 2026
-
Markets focused on: US/Iran tensions, Trump’s 10% blanket tariffs being struck down, and the April Jobs Report at 8:30am ET.
-
US/Iran: US struck Iranian military targets after Navy destroyers were attacked in the Strait of Hormuz. Oil is higher, roughly 1,600 vessels remain stuck in the Persian Gulf, but both sides say negotiations are continuing.
-
Tariffs: The Court of International Trade ruled Trump’s blanket 10% import tariffs were unauthorized by law, creating a temporary tariff holiday while the administration is expected to appeal.
-
Jobs Report: Bloomberg expects +65K jobs and unemployment unchanged at 4.3%. ADP showed +109K private jobs earlier this week.
-
Calendar: UoM Consumer Sentiment and Inflation Expectations at 10:00am ET. Fed speakers include Bowman, Daly, Goolsbee, and Waller at 7:30pm ET.
-
Volatility: ES 5-day average daily range eased to 79 points from 89.75, but volatility remains elevated.
-
Flow/Bias: Whale bias is bearish into the April Jobs Report based on average overnight large trader volume.
-
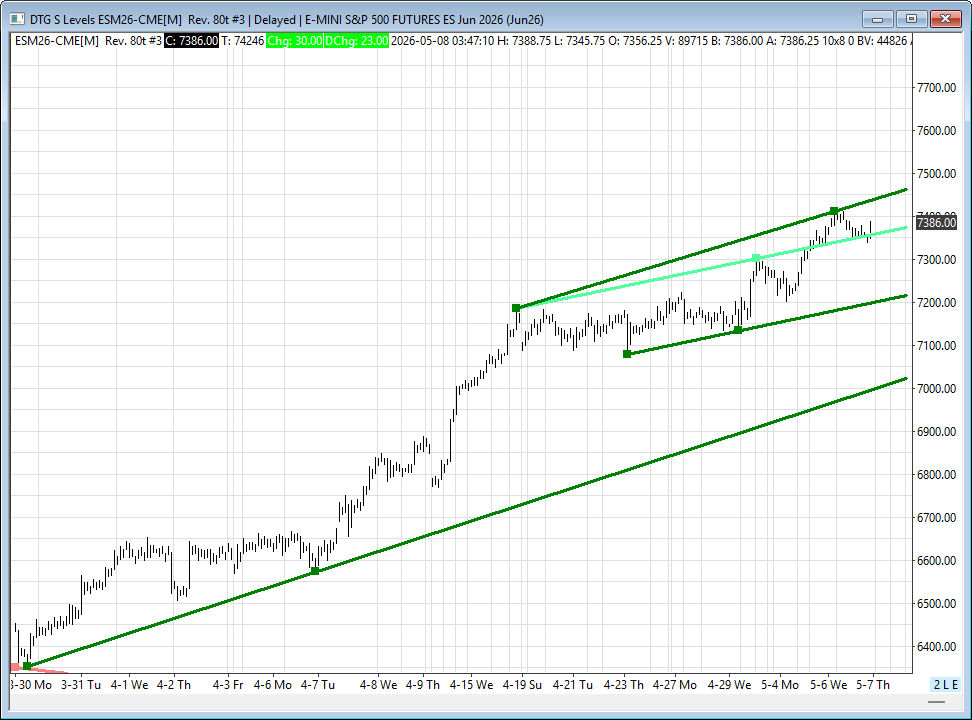
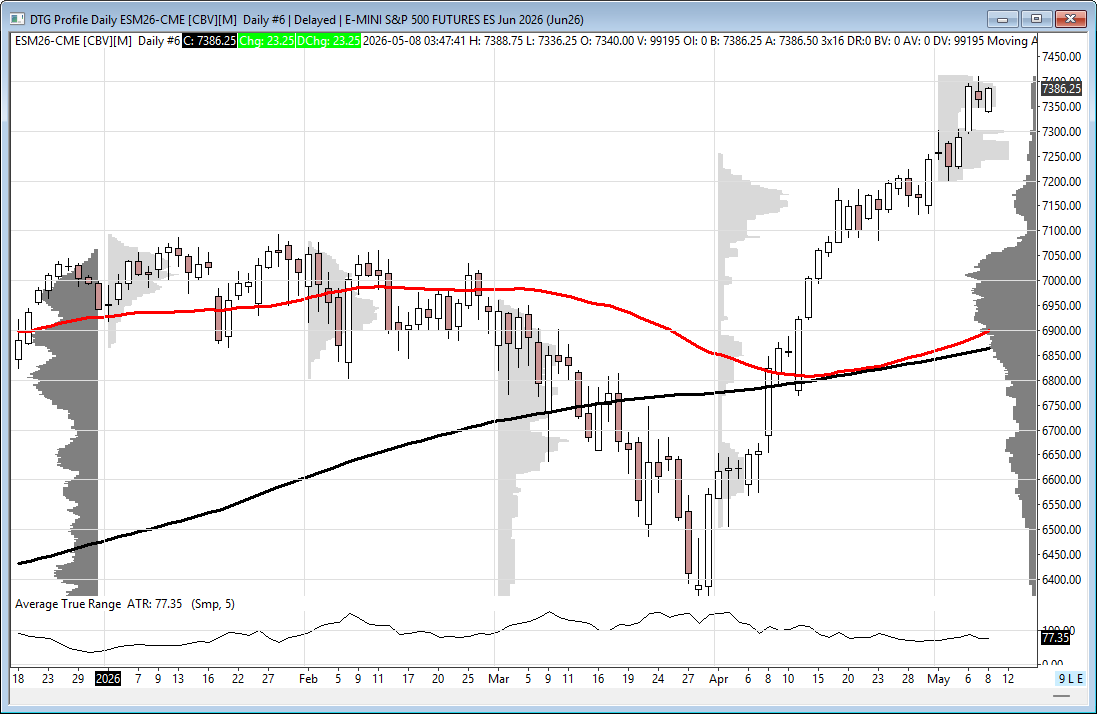
ES Technicals: ES may have set a potential swing high Thursday. The 7355/58s trendline remains key support, while bulls face resistance at the short-term uptrend channel top near 7443/46s.
-
ES Levels:
-
Resistance: 7443/46s
-
Support: 7355/58s, 7206/11s, 7025/30s
-
50-day MA: 6899
-
200-day MA: 6864
-
MA bias remains bullish because the 50-day MA is above the 200-day MA.
-
Affiliate Disclosure: This newsletter may contain affiliate links, which means we may earn a commission if you click through and make a purchase. This comes at no additional cost to you and helps us continue providing valuable content. We only recommend products or services we genuinely believe in. Thank you for your support!
Disclaimer: Charts and analysis are for discussion and education purposes only. I am not a financial advisor, do not give financial advice and am not recommending the buying or selling of any security.
Remember: Not all setups will trigger. Not all setups will be profitable. Not all setups should be taken. These are simply the setups that I have put together for years on my own and what I watch as part of my own “game plan” coming into each day. Good luck!!
Follow @MrTopStep on Twitter and please share if you find our work valuable!
This post goes out as an email to our subscribers every day and is posted for free here around 2 PM ET. To get your real-time copy, sign up for the free or premium version here: Opening Print Subscribe.
Comments are closed