PCE, End-of-Quarter Trade in Focus
Follow @MrTopStep on Twitter and please share if you find our work valuable.
Our View
We got the knockdown, but now what? Every time the ES sells off, it makes a new high. In fact, the ES has made four consecutive new contract highs in as many days. But was the knockdown after the high a prelude to the PitBull’s Thursday low before this week-four Friday options expiration? First, we have the PCE number to get past. According to Bank of America, here are the August PCE Report Highlights:
-
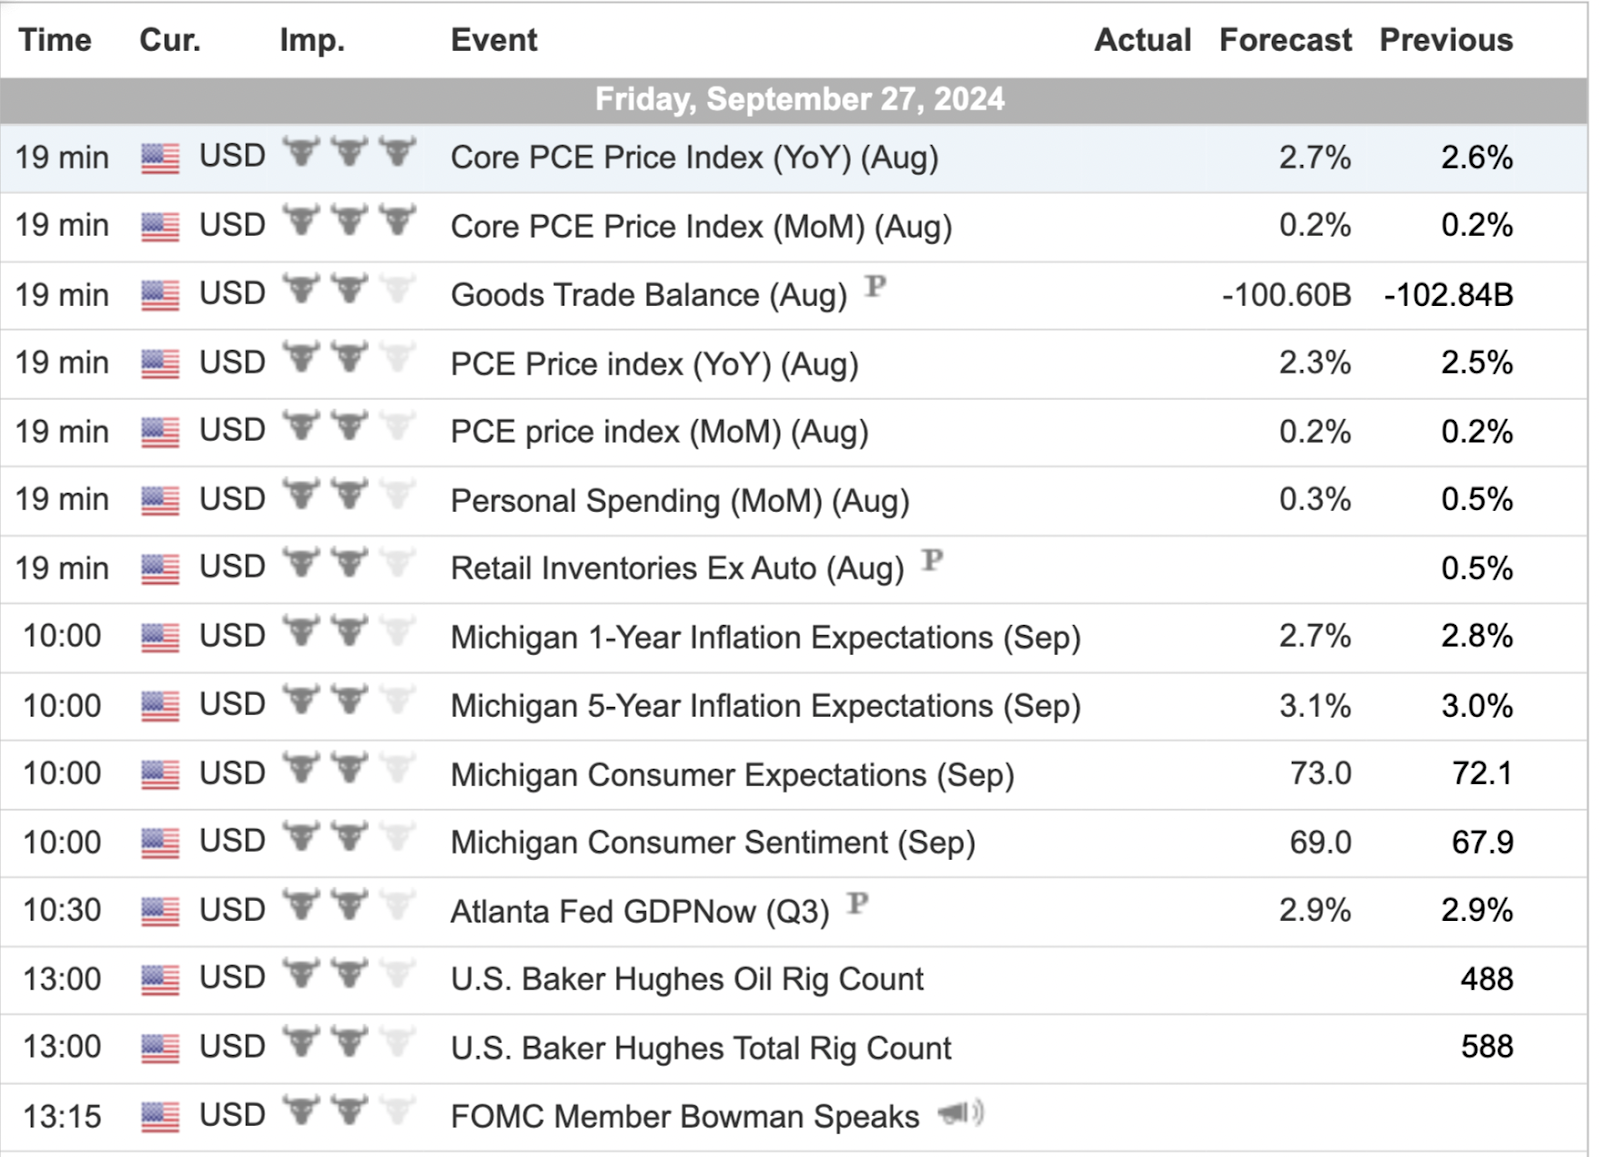
PCE report release date and time: Friday, Sept. 27, at 8:30 a.m. EDT.
-
The PCE Price Index is forecast to rise 0.10% in August after rising 0.16% in July.
-
Core PCE is forecast to rise 0.20% in August after rising 0.16% in July.
-
The PCE Price Index year over year is forecast to rise to 2.7% in August after increasing 2.6% in July.
-
Core PCE year over year is forecast to rise to 2.7% in August after increasing 2.6% in July.
At Bank of America, economists expect a 0.15% increase in the PCE, which would translate to a 2.7% reading on an annual basis. Even if the report rounds the monthly gain up to 0.2%, “the print should add to the Fed’s confidence on disinflation,” Bank of America economists wrote.
Under the hood of the PCE report, Bank of America economists expect a softer reading on financial-services inflation. They expect a mixed set of data within medical-care inflation.
Our Lean
I have to be honest: I don’t know how the ES and NQ will react to this morning’s PCE number, but as far as other indicators go, I still think the end of September is prone to weakness and institutional portfolio restructuring.
The last day of Q3 has the S&P down 17 of the last 26 occasions, but up 5 of the last 8. The first trading day of October, next Tuesday, is mixed, up 9 of the last 18 and up 2.7% in 2022. Since 2008, in the last two days of September, there have been 14 up days and 18 down days. The up days gained 189.75 points, while the down days lost 404.50 points, resulting in a net loss of 214.75 points over those two days. In 2022, the two days lost 122.75 points.
To conclude, I still think we could bounce, but I believe any sizable gap up or pop will eventually get sold.
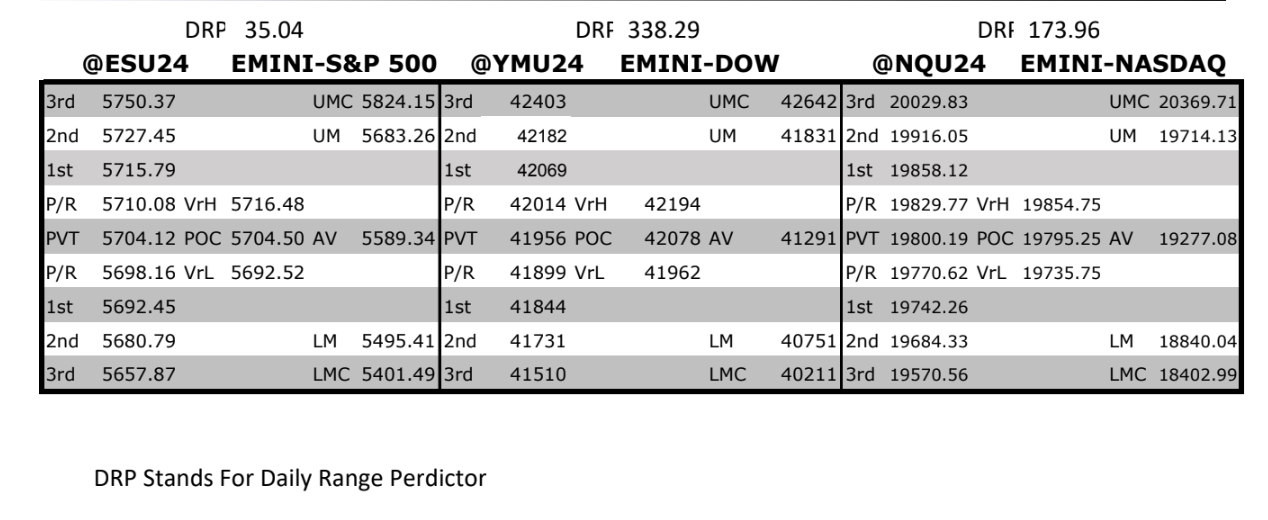
MrTopStep Levels:
From my good buddy Jeff Hirsch from the Stock Trader’s Almanac
Election year Octobers rank dead last for DJIA, S&P (since 1950) and NASDAQ (Since 1971). Uncertainty ahead of Election Day can intensify Octoberphobia into a self-fulfilling prophecy, which can produce heightened volatility and market setbacks October is infamous for.
Over the last twenty-one years (2003-2023), the full month of October has been a fairly solid month for the market, ranking #4 for DJIA, S&P 500 and NASDAQ, #5 for Russell 1000 and # 6 for Russell 2000. All have logged average gains ranging from 0.8% by Russell 2000 to 1.5% by NASDAQ. But these gains have been accompanied by volatile trading, most notably during the early days of the month.
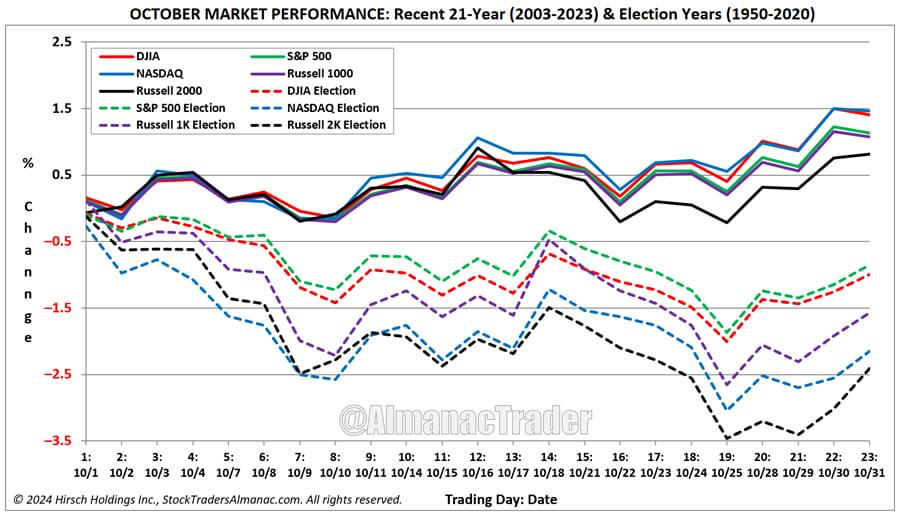
October has historically opened softly with modest average gains on its first trading day. On the second day, all but Russell 2000 have been weak followed by a rebound on the third trading day before additional weakness pulled the market lower through the seventh or eighth trading day. At which point, the market has historically found support and begun to rally through mid-month and beyond.
In election years since 1950, October has been weak from the start with some strength around mid-month followed by a second wave of weakness before rallying to the finish with a loss. Steep declines in October 2008 do influence the pattern, but weakness persists even when 2008 is excluded.
MiM and Daily Recap
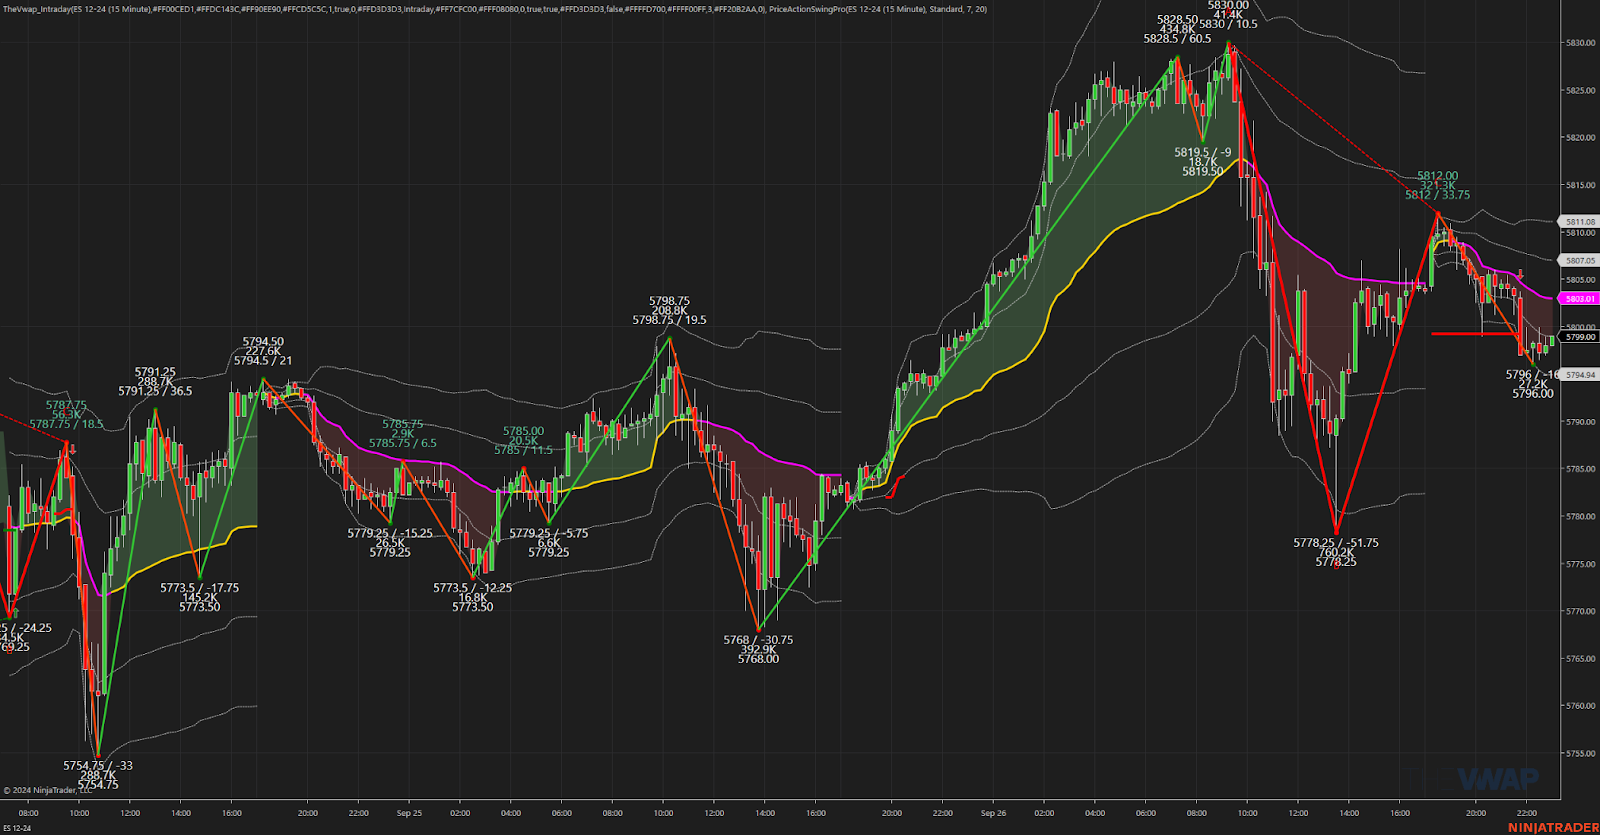
ES Recap
The ES rally started at 3:59 p.m. Wednesday and rallied all the way up to 5830.00 after Micron reported better-than-expected earnings, and the ES opened Thursday’s regular session at 5824.25. After the open, the ES rallied up to 5827.25 and then sold off down to 5811.25 at 10:00. It then sold off 18.5 points down to 5803.25, rallied 11 points up to 5814.25, and then dropped 25.75 points down to 5788.50 at 11:03 a.m.
After the drop, the ES rallied 17 points up to 5805.50 and then dropped 27 points down to 5778.25 at 1:20 p.m. After the low, the ES rallied 28.75 points up to 5707.00 at 2:18 and then dropped 8 points down to 5799.00 at 2:48. It rallied up to 5804.50 at 3:15, sold off down to 5798.00 at 3:33, and then some buy imbalances showed up, pushing the ES to trade at 5802.75 as the 3:50 cash imbalance showed $600 million to sell.
It traded 5803.25 on the 4:00 cash close and moved up to 5808.25. After 4:00, the ES sold off down to 5802.00 at 4:01, traded up to 5806.25 at 4:10, and then traded in a 2 to 4 point range, settling at 5803.75, up 24.75 points or +0.43%. The NQ settled at 20,345.75, up 158 points or +0.76% on the day.
In the end, it was a big pop and then pull back — pretty much went as we expected going into the Q3 of the rebalance. In terms of the ES’s overall tone, the big gap-up exhausted the markets and then the rebalancing took over. In terms of the ES’s overall trade, volume was OK at 1.276 million contracts traded.
Technical Edge
-
NYSE Breadth: 69% Upside Volume
-
Nasdaq Breadth: 72% Upside Volume
-
Advance/Decline: 62% Advance
-
VIX: ~15.50
Guest Posts — SpotGamma
SpotGamma is one the the shining stars of the options markets. If you have never heard of them or already know of them and have never signed up for their options flow products or the SG Academy, I fully suggest you check them out and add them to your trader’s toolbox.
Here’s a snippet from them:
Futures are flat, indicating a SPX cash open is back near the very large 5,750 strike. That strike has been in focus this past week, as it’s providing a lot of positive dealer gamma through its expiration this Monday (9/30).
As far as this AM’s Core PCE goes – no one cares. The 0DTE SPX ATM straddle is a paltry $25.5 (45bps), with an IV of just 16.8% (ref: 5,745). This is as low as it gets, reflecting traders bets that today is rather boring. Quite frankly, its hard to argue that point, due to that massive gamma position.
To get a visual on this lack of movement, below is a 5-day view of SPX realized volatility. Its about as low as we can go, which is a simple reflection of the fact that the SPX has held a ~75bps range over the past 6 sessions. Realized vol can’t go to 0, there is a lower bound, and we are essentially staged on that lower bound.
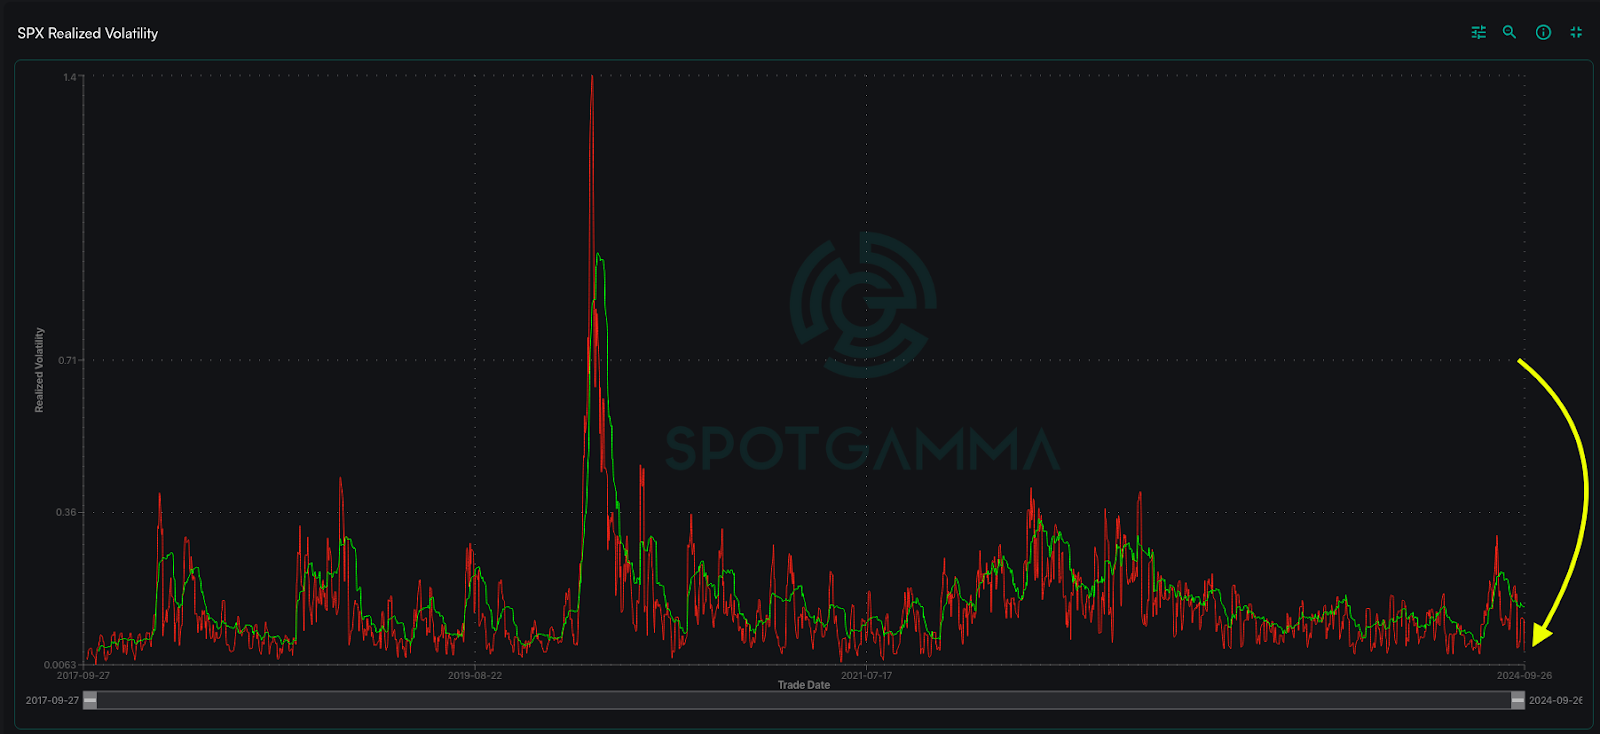
This is where things get interesting.
If one believes that positive gamma is linked to low volatility (we do), then the removal of a giant blanket of positive gamma should open the door for volatility. Obviously this is set to happen on Monday, as the current JPM collar strike (the fund is short 40k 9/30 exp 5,750 calls) are going to be closed and “rolled up and out”. What does that mean? The new call is going to be changed to a ~5% higher strike, out in Dec ’24. That is a lot less positive gamma, vs the ATM position expiring in 1 day.
Therefore, this expiration should allow for volatility (i.e. market movement) to expand.
What strengthens this argument is that we are at a volatility floor. That 0DTE straddle is about as low as it can get, and short term realized vol is on the floor, too.
Economic Calendar
For a more complete Economic Calendar see: https://mrtopstep.com/economic-calendar/
Comments are closed