This post goes out as an email to our subscribers every day and is posted for free here around 2 PM ET. To get your real-time copy, sign up for the free or premium version here: Opening Print Subscribe.
Pessimist Bull in a $3.5 Trillion Expiration — Gap It Up, Slam It Down
Follow @MrTopStep on Twitter and please share if you find our work valuable!
Our View
I never know what to believe, but analysis from the JPMorgan Chase Institute indicates that while trade policies implemented in 2025 have successfully reduced U.S. reliance on Chinese manufacturing, the shift has come at a significant financial cost to American midsize businesses.
-
Decoupling from China: Financial outflows from midsize U.S. firms to China have dropped by approximately 20% since 2024.
-
Tripled Tariff Payments: Monthly tariff payments for these firms have tripled compared to early 2025 levels, following the universal tariffs and rate increases implemented in April 2025.
-
Shift to Other Markets: Instead of reshoring to the U.S., businesses are engaging in “import substitution,” shifting their supply chains to Southeast Asia, Japan, and India to avoid the steepest levies.
-
Burden on Midsize Firms: The report highlights that midsize companies (revenues between $10 million and $1 billion) are particularly vulnerable because they lack the scale of large multinationals to absorb these sustained cost increases.
-
Impact of Policy Changes: The removal of the de minimis exemption (which previously allowed shipments under $800 to enter duty-free) also contributed to the rising costs for smaller importers.
What I can say is none of this shocks me, but I will also say that while it may be working, Trump continues to turn friendly nations into not-so-friendly ones, and despite all the negatives, the stock market isn’t going down, or at least not yet.
Goldman Sachs #PCE
Goldman Sachs revised its January 2026 core PCE inflation forecast upward to 3.05% year-over-year after a hot January CPI report, up from a prior 2.8% expectation, due to differences in CPI vs. PCE calculations (including more business-to-business IT commodity “leakage” into consumer metrics). Headline PCE is expected at 2.81% YoY (slightly above November’s 2.8%), with monthly core up 0.40%.
This signals persistent “last mile” pressures from tariffs and tech, likely delaying Fed rate cuts and maintaining a “higher for longer” stance (rates at 3.50%–3.75% until at least summer 2026), as markets shifted away from near-term easing like March or April cuts.
For full-year 2026, Goldman projects core PCE moderating to 2.1% by December (YoY, ~0.3 pp below consensus/FOMC/market pricing), driven by fading tariff effects (0.5 pp added to the 2025 stall at ~2.8%), underlying disinflation at ~2.3% ex-tariffs, base effects, labor rebalancing, and shelter declines—supporting eventual easing despite near-term stickiness, with today’s (Feb 20) delayed December 2025 PCE release (alongside Q4 GDP) offering key confirmation amid macro flows.
Our View
The notional value of today’s January options expiration is said to be around $3.5 trillion (or more). We all know how the monthly and quarterly expirations have a big effect on the S&P.
On Wednesday, SpotGamma Founder Brent Kochuba hosted a dedicated live discussion on the “February OPEX Live,” covering how monthly options expiration impacts markets under current conditions. The emphasis was on delta, vanna, and gamma models, 0DTE volume/open interest indicators, and monthly OPEX dynamics.
February OPEX is described as a “reliably volatile time” when options flows exert significant influence, with references to binding/holding effects (e.g., gamma pinning) and tools like SpotGamma’s Hero platform for visualizing EMA crosses or gamma flips.
I can’t go into all of this, but here is the link to Brent’s YouTube video: February OPEX Live. If you have time, this is a really good explanation of how the expirations work.
Our Lean
We continue to see the same prices overall. Can today be different? Well, with the PCE number and the $3.5 trillion February options expiration, it very well could. What I do know is today’s OPEX ranks poorly historically for the S&P 500, but at the end of the day… who knows! What we do know is that all this increases volatility.
Most of the Trump/Iran war talk was that there could be an attack “soon” or over the weekend, but Trump said something about 10 days.
Our lean: As I said above, the ES and NQ have been trading at the same prices over and over. I still think a gap in either direction is tradable. You all know I’m a pessimist bull, so a big gap down on large Globex volume would be my preferred trade, but that would also go for a big gap up.
Good luck today.
Ladder Levels
Resistance Levels
Support Levels
6,930.25
6,879.08
6,926.82
6,877.00
6,922.74
6,871.25
6,910.42
6,867.28
6,909.59
6,862.85
6,904.81
6,858.18
6,903.61
6,850.39
6,897.25
6,845.67
6,895.82
6,844.41
6,892.75
6,837.69
6,834.23
6,831.46
6,814.33
6,813.00
6,806.65
6,780.92

Guest Posts:
January Barometer — The Data Since 1970
Rich Miller: HandelStats
At HandelStats, we let the numbers speak.
Since 1970, the S&P 500 has finished higher in January 33 times and lower 23 times. Over that same period, the full year has closed higher 42 times and lower just 14 times — a 75% annual win rate.
But here’s where it gets interesting.
When January Is Positive
In the 33 years that January finished higher:
-
The full year ended higher 29 times
-
Down just 4 times
-
That’s an 87.88% probability of a positive year
January strength meaningfully tilts the odds.
When January and February Are Both Up
Since 1970, January and February have both closed positive 22 times.
In those years:
-
The market finished higher 21 out of 22 times
-
A 94.45% probability of a positive year
Momentum early in the year matters.
When January, February and March Are All Positive
An even more powerful signal emerges when Q1 builds progressively:
-
January up
-
February up
-
March up
This has occurred 16 times since 1970.
In every single one of those years, the S&P 500 finished higher.
100% historical win rate.
Presidents Day Long Weekend Bias
HandelStats: Rich Miller
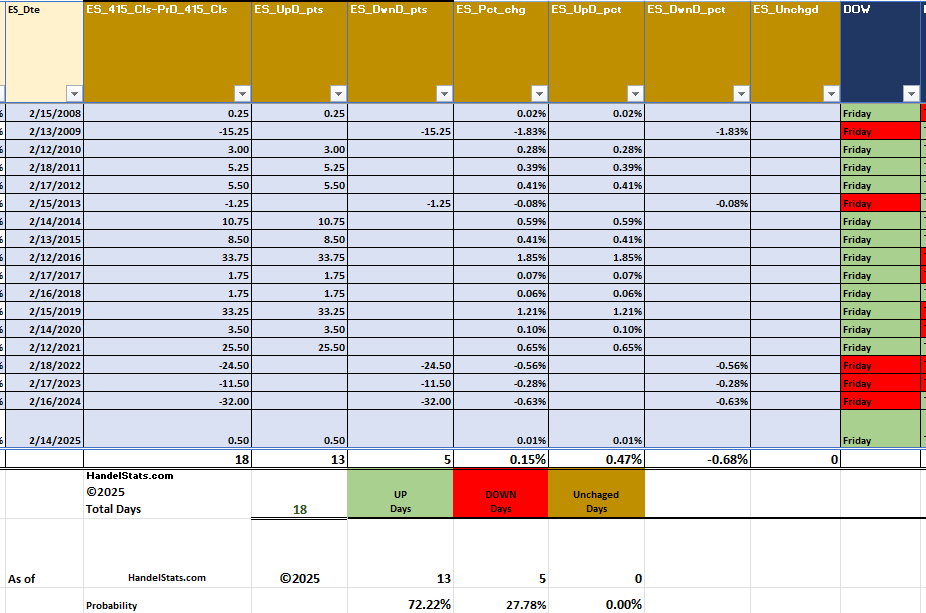
Since 2008, the S&P 500 has shown a consistent positive bias into the Presidents Day holiday.
Looking at the Friday before the long weekend:
-
Up 13 out of 18 years
-
A 72.22% win rate
-
Only 5 down occurrences
-
No unchanged closes
Long weekends often carry a subtle bullish drift, and Presidents Day has followed that pattern historically.
While sample size is modest, the bias is statistically meaningful — especially in stable trend environments.
We’ll see if the pattern holds again this year.

Get instant access to our partners’ real-time market data and insights not available anywhere else. Here is last night’s Founder’s note getting you ready for today’s market and explaining the constraints in yesterday’s market. – MrTopStep
Founder’s Note:
Futures are flat, with OPEX on deck.
TLDR: Before we move into the data, we want to note that we’ve moved our Risk Pivot to 6,800. This is because of the stats we are going to outline below, which all point to a bullish bounce next week. We quite frankly feel like something nefarious is afoot, but feelings aren’t valid. Sub 6,800 we will very quickly flip to neutral and/or bearish of stocks.
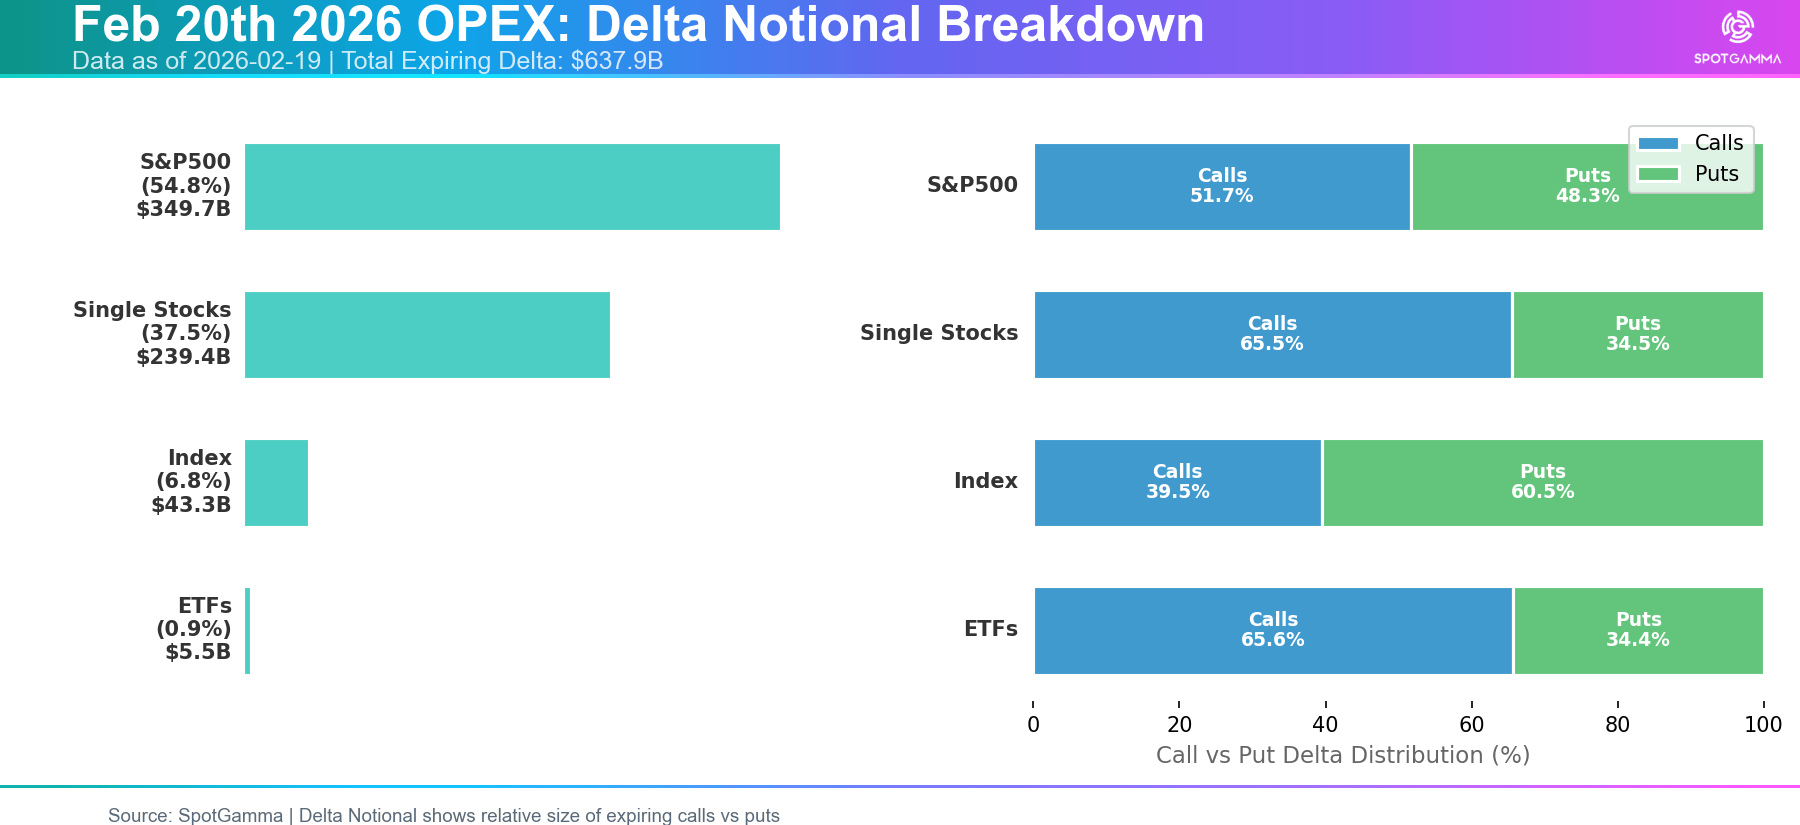
This OPEX is a fairly standard size OPEX, with about $600 bn on delta expiring. That’s ~1/2 of a quarterly OPEX. You can see that calls and puts are relatively equal in size (right side), which makes sense based off of the sleepy price action – we’re neither at highs nor lows in the major indices. Single stocks, many of which are down sharply this month, are still pretty well call-weighted. That said, in very bullish months we’ve see the expiring single stock call percent be +80%. What would arguably be more interesting here would be to see either puts or calls dominating the expiration size.
Note this plot is based off of total “naive” open interest, not the SGOI data.
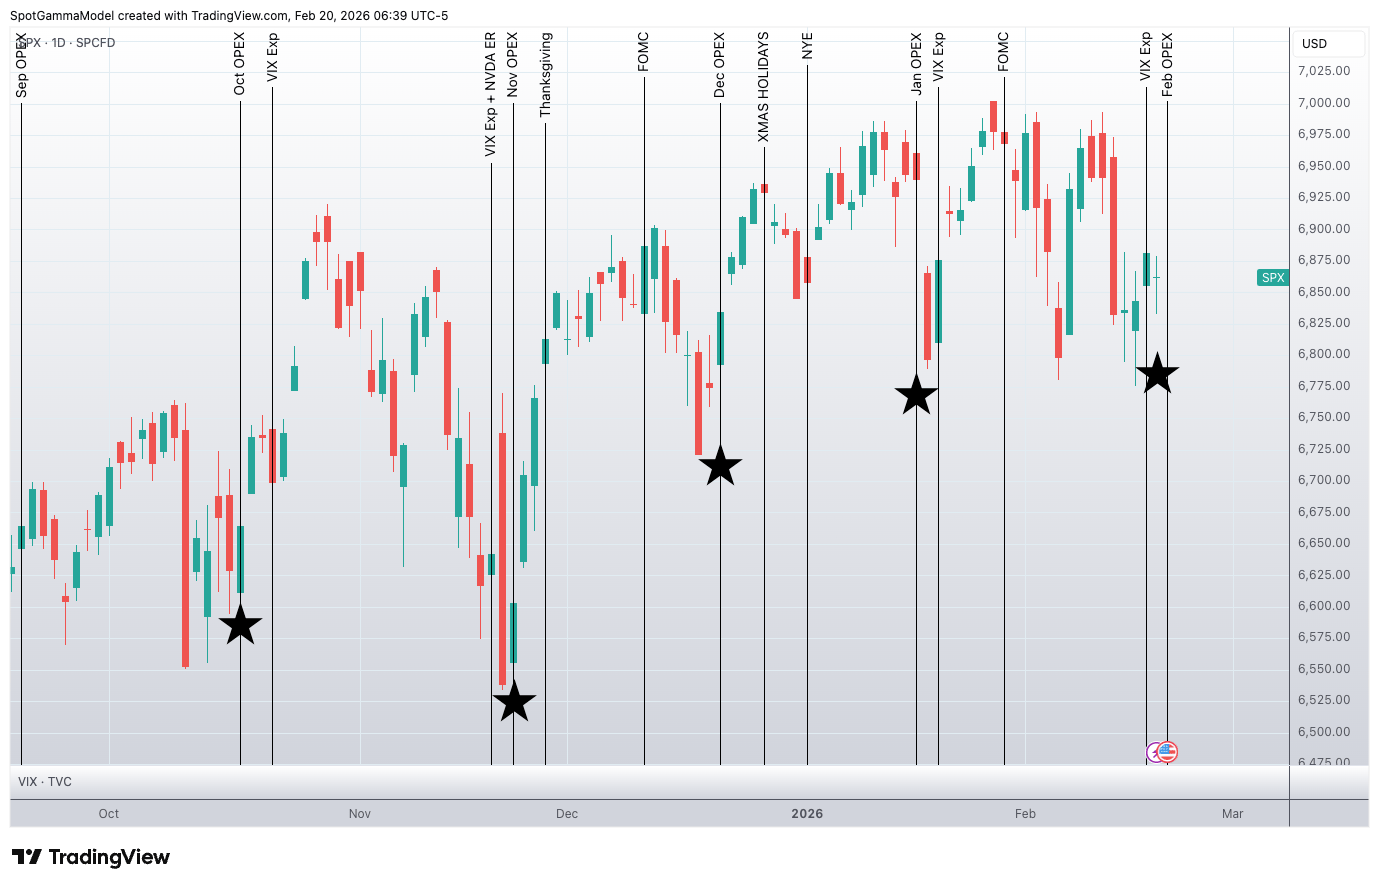
The tricky thing with this average-sized OPEX is that the stats suggest a bounce is due, and that fits with recent history. Note here is just a simple SPX plot, with expirations denoted with black stars. SPX is clearly higher 1-5 days after each of these expirations and this OPEX lines up with the bottom of the trading range (~6,800) that has dominated since Thanksgiving. Since November, nearly all the tests of <=6,800 have occurred on OPEX.
What about the stats?
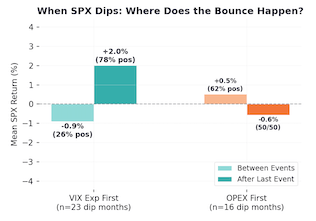
We recently refreshed our OPEX stats. As you know, we have an expiration “window” each month, with that window being defined as the time between VIX (VIX Exp) & Equity expiration (OPEX). Wednesday VIX Exp’s can occur either before or after Friday OPEX. This matters.
Below you see when VIX exp is first (left side, as with this month) and the SPX is declining into OPEX, we generally see a decline into Friday OPEX (light green “between events”), then a strong bounce out of Friday OPEX (“after last event”). When OPEX is first, that signal is 50/50, as you see on the right (orange plots). In summary: when the SPX sells off into a “VIX exp first” series, it tends to bounce after.
This lines up with what we see in the plot above…
All this suggests we should statistically expect a strong bounce out of this expiration. I am personally having a very hard time playing a bounce here out of this OPEX. My view has been that the relatively quiet SPX should sync up with flailing single stocks. While the SPX is near post-Thanksgiving (3 month) lows (LOL), that’s hardly a meaningful decline.
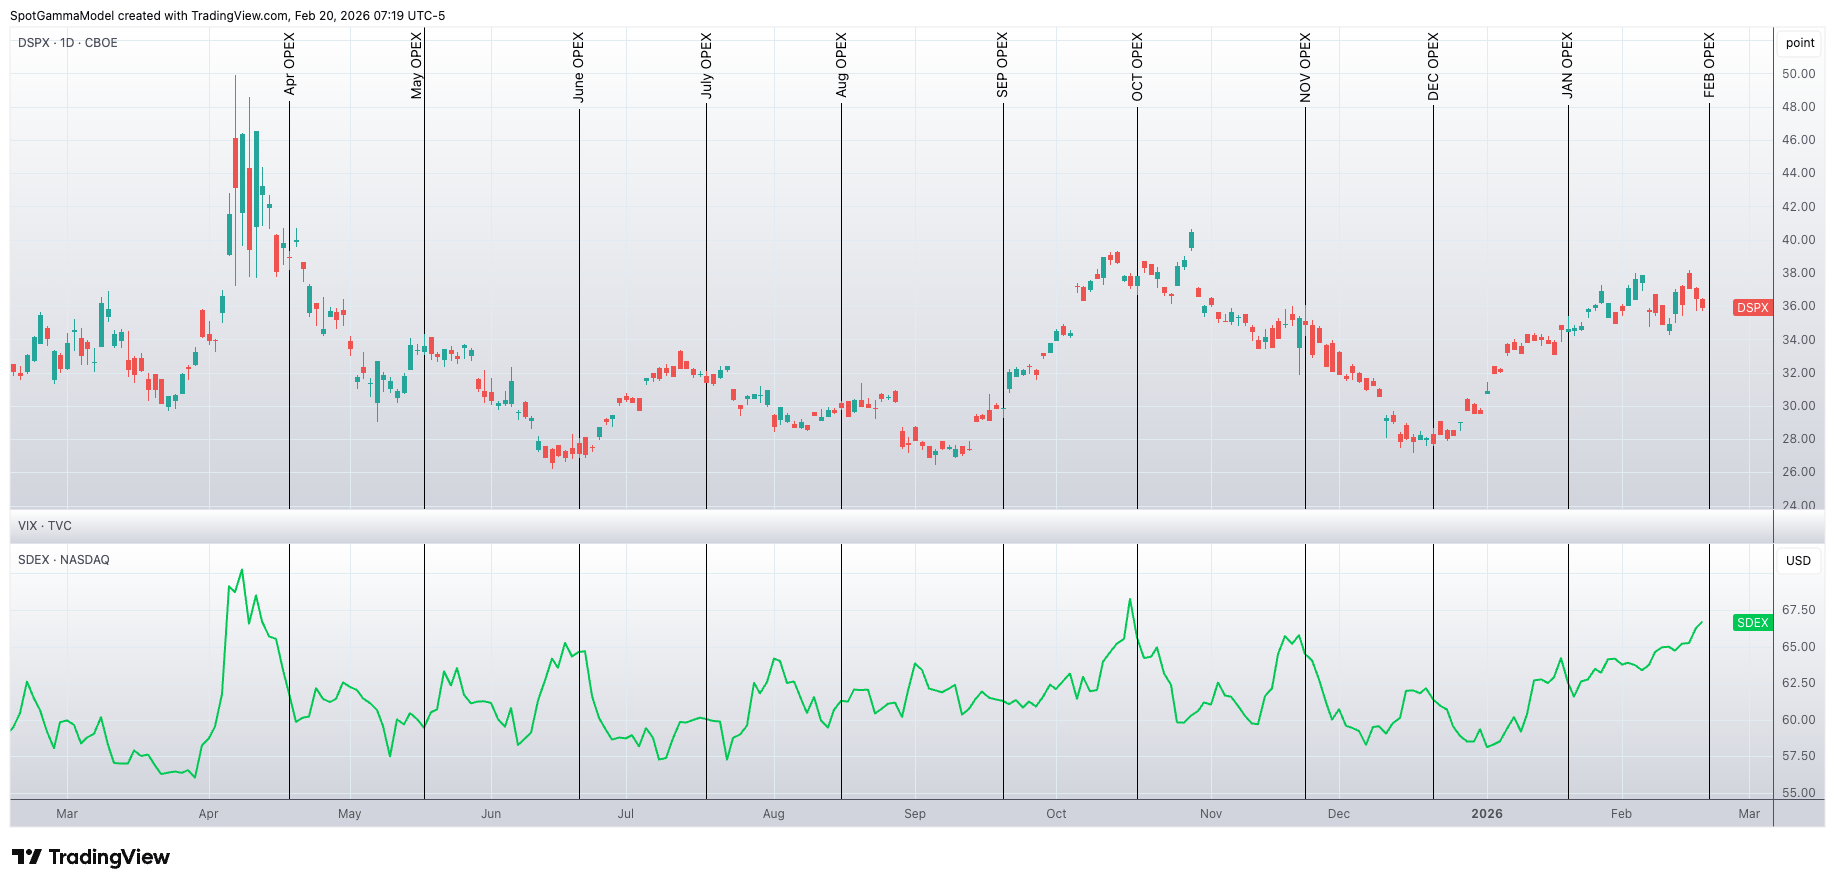
Here is the DSPX, the CBOE Dispersion Index (top) vs SDEX (SPY Put Skew Index). We marked options expirations against these metrics, and what you see is that OPEX can mark as a turning point in this space – essentially the vol space. You can also see that both dispersion and SPY skew are at highs – although not matching the pure insanity of last April. It’s hard to look at this chart and think “vol has more room to the upside”…
©2026 TenTen Capital LLC DBA SpotGamma
All TenTen Capital LLC DBA SpotGamma materials, information, and presentations are for educational purposes only and should not be considered specific investment advice nor recommendations. Futures, foreign currency and options trading contains substantial risk and is not for every investor. An investor could potentially lose all or more than the initial investment. Risk capital is money that can be lost without jeopardizing one’s financial security or lifestyle. Only risk capital should be used for trading and only those with sufficient risk capital should consider trading. Past performance is not necessarily indicative of future results. VIEW FULL RISK DISCLOSURE https://spotgamma.com/model-faq/disclaimer/
Market Recap
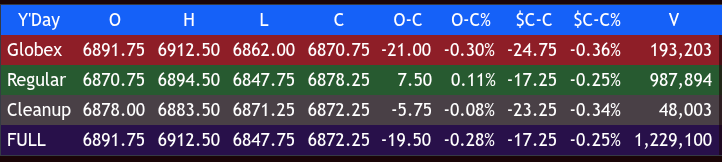
The ES traded up to 6915.50 on Globex around 3:30 am, sold off down to 6866.25 at 5:35, and rallied back up to 6866.25 after Walmart reported disappointing earnings. It then dropped down to a new low at 6862.50 and rallied back up to 6880.00 at 8:35, and opened Thursday’s regular session at 6870.75, down 24.75 points or -0.36%.
After the open, the ES sold off down to 6856.75 at 9:35, rallied up to 6990.75, and pulled back to 6876.00. It then rallied up to 6894.50 at 10:00; in the first half hour, almost 240k ES traded.
The ES sold back off down to 6869.75 at 10:30, rallied back up to 6891.50, and sold off down to 6871.25 at 11:05. It rallied up to 6891.00, traded down to 6859.25 at 12:05, and rallied back just above the VWAP up to 6880.50.
The ES then sold off down to 6847.50 at 1:20, rallied up to 6873.00 and sold off down to 6851.00 at 2:20 as MSFT made new lows. It traded up to 6872.50 at 3:48 and traded 6871.00 as the 3:50 cash imbalance showed $950 million to sell, pulled back a few points, and traded 6878.25 on the 4:00 cash close.
After 4:00, the ES traded 6883.50, then traded back down to 6871.75 and settled at 6877.00, down 17.25 points or -0.25%, and down 5 of the last 7 sessions. The NQ settled at 24,858.75, down 97.25 points or -0.39%. Oddly enough, the NQ has been up a day and down a day the last 8 sessions. The YM settled at 49,458.00, down 264 points or -0.53%, and up 3 of the last 4 sessions, and the RTY settled at 2,669.10, up 6.20 points or +0.23%, up 4 in a row.
In the end, it was a very choppy session, highlighted by weak Walmart earnings and the ongoing US/Iran war tensions. In terms of the ES’s overall tone, it saw chop up, chop down, and all around. In terms of the ES’s overall trade, volume was lower, with Globex volume of 285k and a total of 951k in the day session, for a total of 1.236 million contracts traded.
MiM
Market-On-Close Recap
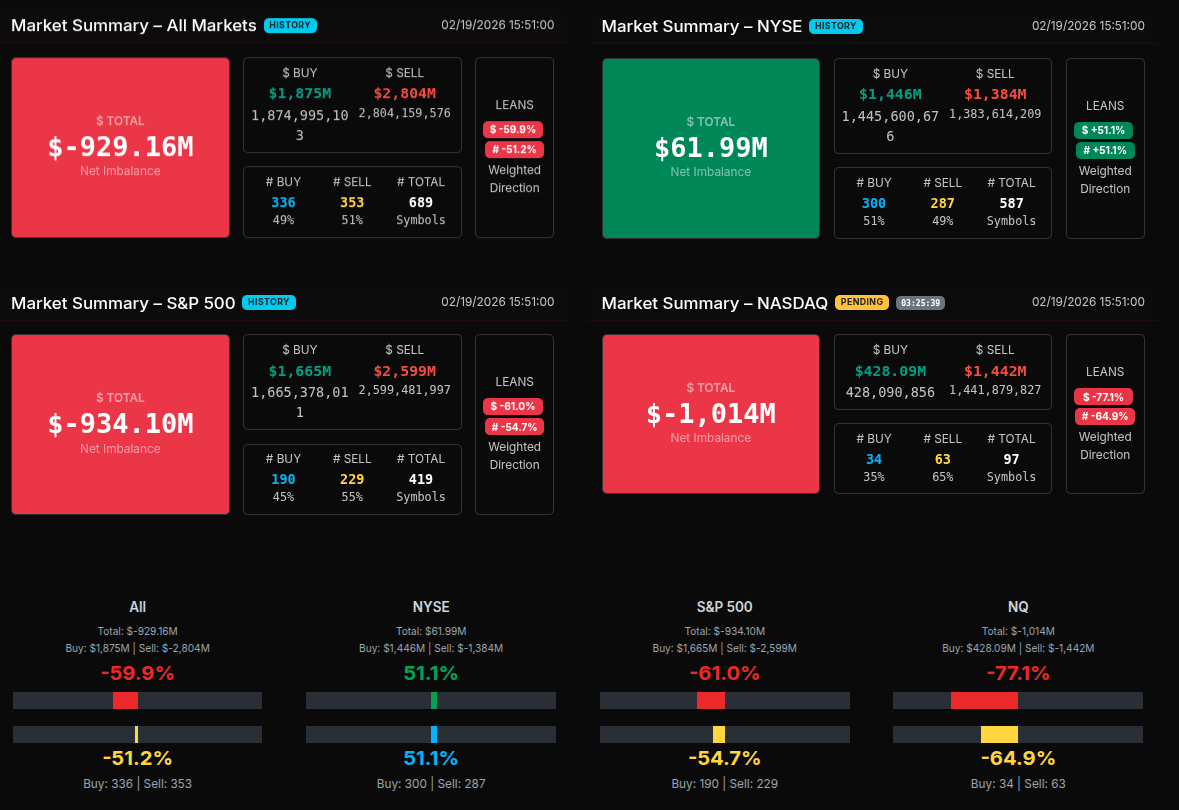
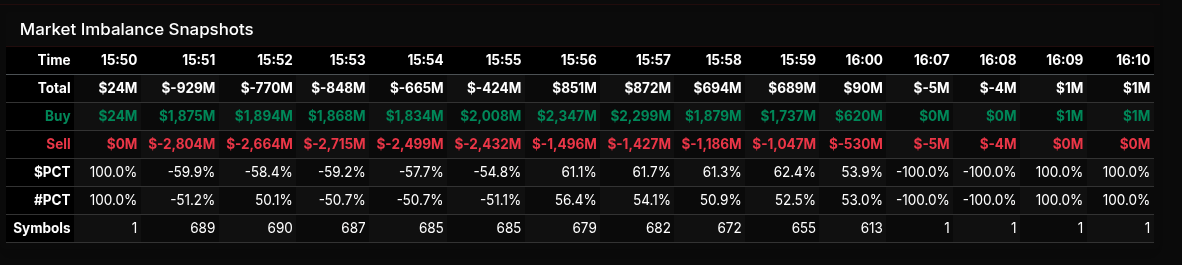
The February 19th close saw a dramatic shift in the MOC landscape, beginning with a heavy sell imbalance before rotating sharply into buy programs and then flattening into the bell.
At 15:51, the market opened with a sizeable -$929M net sell imbalance across all markets, with $1.87B to buy versus $2.80B to sell. The lean registered -59.9%, shy of the -66% threshold that signals wholesale pressure, but still clearly sell-dominated. The S&P 500 echoed this at -61%, while the Nasdaq was particularly weak at -77.1%, a notable extreme indicating broad-based institutional selling in tech-heavy names.
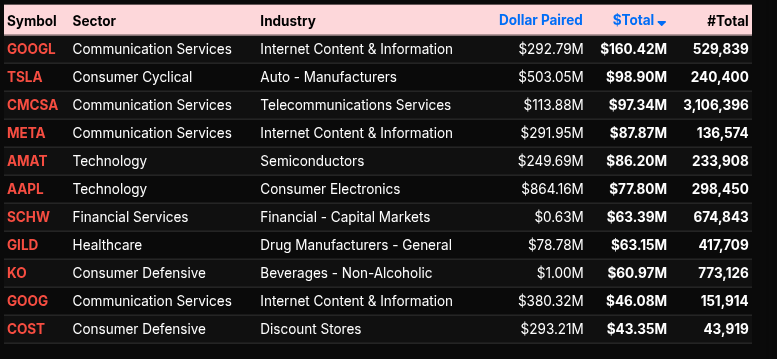
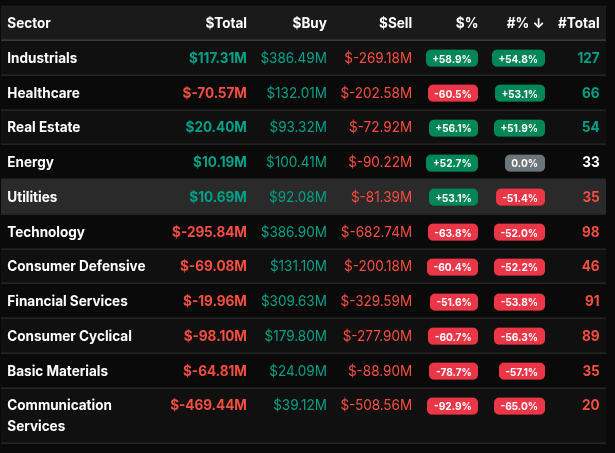
Sector data confirmed the early pressure. Communication Services was the standout on the downside at -92.9%, a wholesale sell program led by GOOGL (-$160M), GOOG (-$46M), META (-$87M) and CMCSA (-$97M). Basic Materials also showed a notable -78.7% lean, while Consumer Cyclical (-60.7%), Consumer Defensive (-60.4%), and Healthcare (-60.5%) reflected steady distribution. Technology overall printed -63.8%, nearing wholesale territory, driven by AMAT, AAPL and semiconductor names.
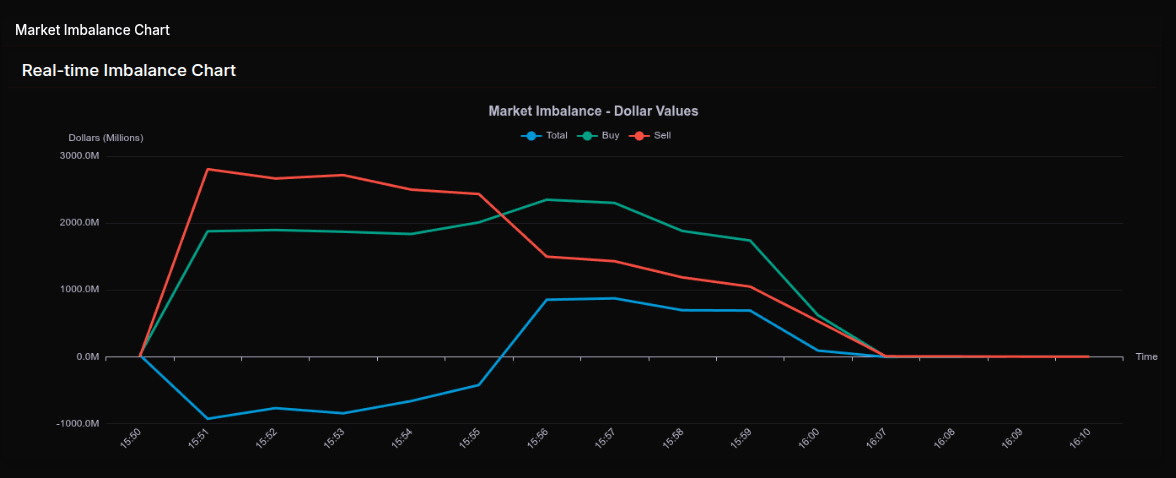
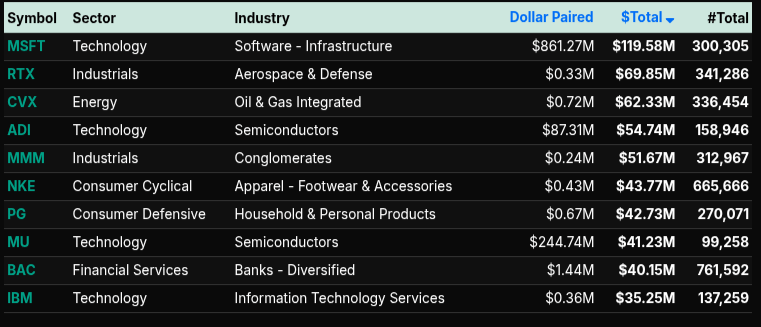
However, the tape began rotating into 15:56. The imbalance flipped to +$851M and built to +$872M by 15:57, with $PCT readings above +61%. This was not wholesale buying but a strong directional shift. Industrials (+58.9%) and Energy (+52.7%) showed consistent buy programs, with MSFT (+$119M), RTX (+$69M), and CVX (+$62M) leading the charge. Real Estate and Utilities also leaned positive, suggesting defensive rotation rather than outright risk-on aggression.
By 16:00, the imbalance had moderated to +$90M before flattening into the close. The session ultimately reflected early broad tech and communication liquidation, followed by cross-sector rotation into industrials, energy and select mega-cap support. The Nasdaq weakness versus NYSE strength (+51% lean) highlights the divergence: tech distribution offset by old-economy buying into the bell.r.
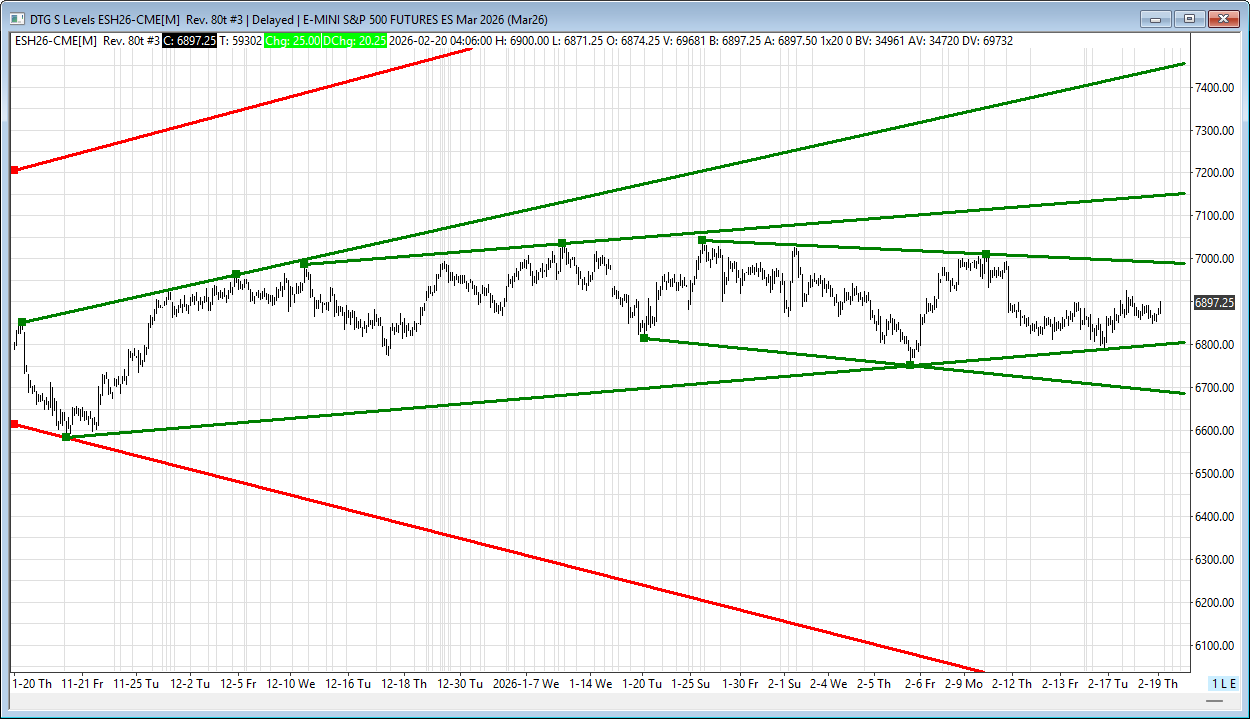
ES Levels
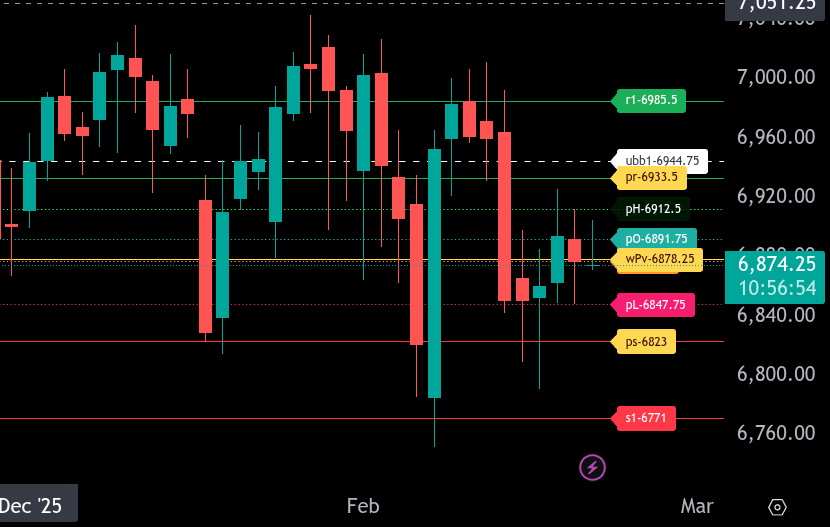
The bull/bear line for the ES is at 6878.25. This is the key pivot for today’s session. Acceptance above this level shifts short-term sentiment back to bullish, while continued trade below it keeps pressure on the downside.
ES is currently trading around 6875.25, slightly below the bull/bear line, indicating a fragile tone in the overnight session. If price remains below 6878.25, look for sellers to press toward 6847.75. A break and hold below 6847.75 opens the door to 6823, which is the lower range target for today. If 6823 fails, the next downside level to watch is 6771.
On the upside, bulls need to reclaim and hold above 6878.25 to regain control. Initial resistance comes in at 6891.75, followed by 6912.50. Above that, 6933.50 is the upper intraday range target. If momentum builds through 6933.50, the next key resistance levels are 6944.75 and 6985.50.
Overall, the market is balanced but leaning slightly bearish below 6878.25. Watch for acceptance above or rejection at this level to determine directional conviction for the regular session.
NQ Levels
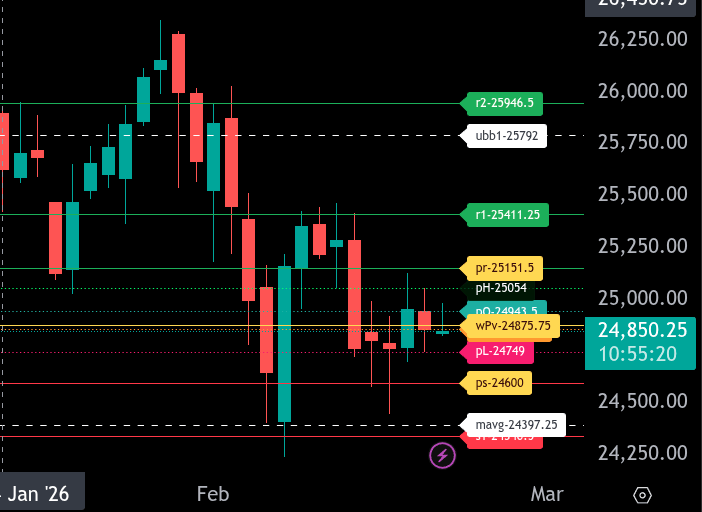
The bull/bear line for NQ is at 24,875.75. This is the key pivot for today’s trade. Holding below this level keeps the market in a defensive posture, while acceptance back above it would shift short-term momentum back to the bulls.
NQ is currently trading around 24,862.50, slightly below the bull/bear line, reflecting hesitation after the recent selloff. As long as price remains under 24,875.75, sellers have the edge and can press toward 24,749.00 and then 24,600.00, which is today’s lower range target. A break and acceptance below 24,600.00 opens the door for an extension toward 24,397.25 and potentially 24,340.50.
On the upside, reclaiming and holding above 24,875.75 puts 24,943.50 back in play, followed by 25,054.00. The main intraday objective for bulls is 25,151.50, our upper range target. If buyers can build value above 25,151.50, we could see continuation toward 25,411.25 and ultimately 25,946.50.
Immediate resistance sits at 24,943.50 and 25,054.00. Immediate support comes in at 24,749.00, followed by 24,600.00. Expect responsive trade around the bull/bear line early in the session, with conviction likely to expand the range toward either 25,151.50 above or 24,600.00 below.
Overall bias remains bearish below 24,875.75 and turns constructive only with sustained trade back above that level.
Technical Edge
Fair Values for February 20, 2026
-
SP: 12.97
-
NQ: 55.61
-
Dow: 44.14
Daily Breadth Data 📊
For Thursday, February 19, 2026
• NYSE Breadth: 52% Upside Volume
• Nasdaq Breadth: 57% Upside Volume
• Total Breadth: 55% Upside Volume
• NYSE Advance/Decline: 48% Advance
• Nasdaq Advance/Decline: 49% Advance
• Total Advance/Decline: 49% Advance
• NYSE New Highs/New Lows: 136 / 33
• Nasdaq New Highs/New Lows: 97 / 173
• NYSE TRIN: 0.86
• Nasdaq TRIN: 0.73
Weekly Breadth Data 📈
Week Ending Friday, February 13, 2026
• NYSE Breadth: 51% Upside Volume
• Nasdaq Breadth: 53% Upside Volume
• Total Breadth: 52% Upside Volume
• NYSE Advance/Decline: 55% Advance
• Nasdaq Advance/Decline: 42% Advance
• Total Advance/Decline: 46% Advance
• NYSE New Highs/New Lows: 653 / 174
• Nasdaq New Highs/New Lows: 675 / 590
• NYSE TRIN: 1.21
• Nasdaq TRIN: 0.63
Calendars
Economic Calendar Today
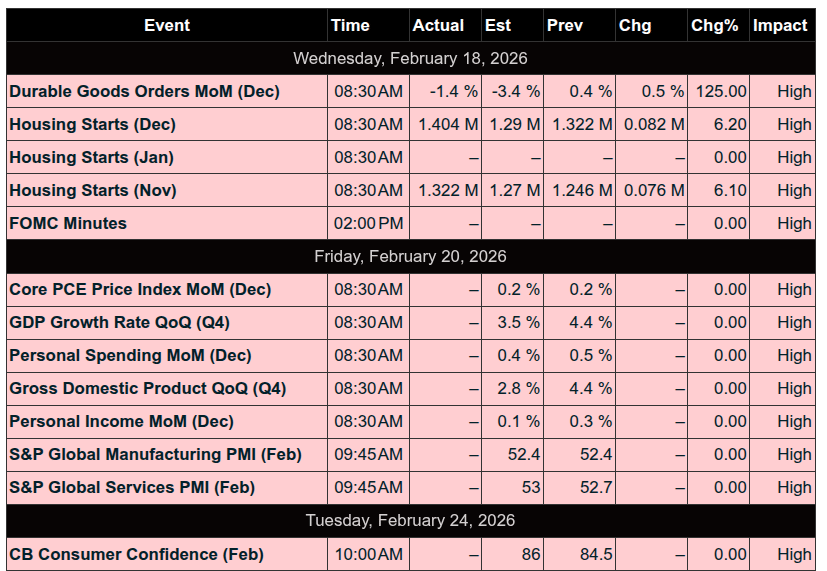
This Week’s High Importance
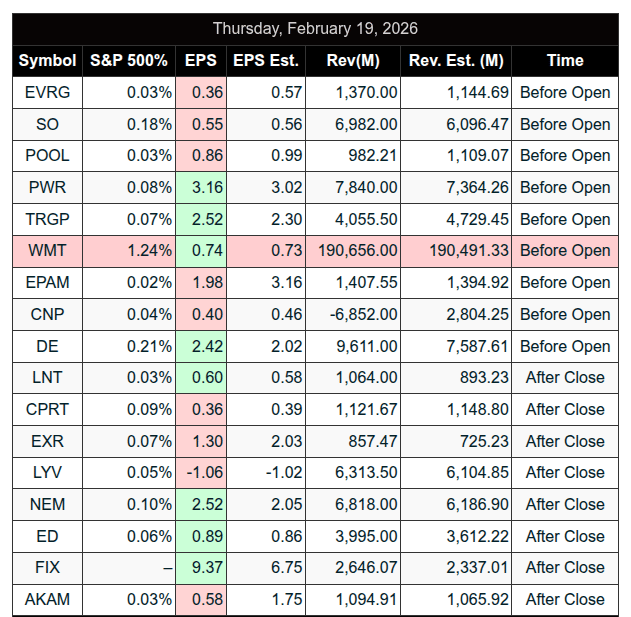
S&P 500 Earnings:
Upcoming:
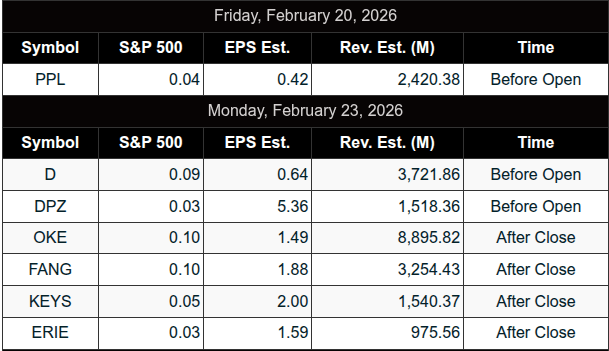
Recent:
Trading Room News:
Polaris Trading Group Summary – For Thursday, February 19, 2026
Morning Plan & Early Structure
The day began with Manny setting the tone: “New day, fresh start.” The trade plan was posted early, reinforcing PTG’s core principles — consistency, clean setups, disciplined execution.
David identified it as Cycle Day 3 and laid out clear levels:
-
Bull Case: Acceptance above 6895 → 6905 / 6915 / 6925
-
Bear Case: Acceptance below 6895 → 6885 / 6875 / 6865
Bear case triggered early and the 6865 downside objective was fulfilled quickly.
Strong directional clarity early — traders who followed structure were rewarded.
CL Trade – Clean Execution
A high-quality opportunity unfolded in Crude:
-
@CL OPR Short triggered
-
Target 1 filled
-
Target 2 filled
-
Trade marked complete with screenshot confirmation
This was textbook: signal → trigger → scale out → complete.
Clear process. Clean execution. No drama.
Market Environment – From Initiative to Inventory
Once the 3-Day Cycle objective was fulfilled, David shifted the room’s mindset:
“The easy money phase is over.”
He emphasized that after fulfillment, the market transitions from initiative behavior to inventory management behavior — what he calls the Wild-Card phase.
Key statistics shared reinforced the structural edge of the 3-Day Cycle:
-
92.35% positive cycles
-
Avg +95 points
-
2.71:1 win/loss ratio
-
Avg profit +76 points
The message:
-
The edge is real.
-
But after fulfillment, conditions change.
Wild-Card characteristics:
-
Late longs chase
-
Early longs defend
-
Shorts probe
-
Dealers rebalance
-
Volatility compresses, then expands
The guidance:
-
Fade extremes, not breakouts
-
Reduce size
-
Trade levels, not narratives
-
Protect cycle profits
This was a major lesson of the day.
Midday: Chop, Bots & Balance
After the early move:
-
“Sandbox 60–80”
-
“Battle of the Bots @ Prior Close 6892”
-
“Chunky Munky Balancing Consolidation”
-
“Trap City”
-
“Chop city”
Price action became rotational and whippy — exactly the environment that punishes overtrading.
David clearly communicated flexibility:
-
Early lean favored sellers
-
Later: favoring longs
-
“Both sides are playable… just need to be nimble”
When conditions degraded, he modeled discipline:
SOH – Sitting On Hands
This was powerful leadership. Instead of forcing trades in chop, he demonstrated restraint.
Education & Development
Several valuable learning moments:
-
John B shared detailed execution mechanics for trading MES off ES signals using Sierra Chart — including risk normalization and psychological conditioning through PnL scaling.
-
Clarification on Cycle Day counting (CD2 high counts as cycle high, but CD1 average decline projection measures from CD3 high).
-
“Break of Range Structure” was highlighted as a playbook addition.
The room wasn’t just trading — it was building skill and process.
Big Lessons from Yesterday
-
Structure first, emotion second.
The bear target hit because the plan was clear. -
After objectives are fulfilled, mindset must shift.
Initiative → Tactical. -
Wild-Card days require defense.
This is where traders give back profits if they don’t adjust. -
Chop is a position.
SOH preserved capital and mental clarity. -
Playbook expansion never stops.
Break of Range Structure added to the tactical toolkit.
DTG Room Preview – Friday, February 20, 2026
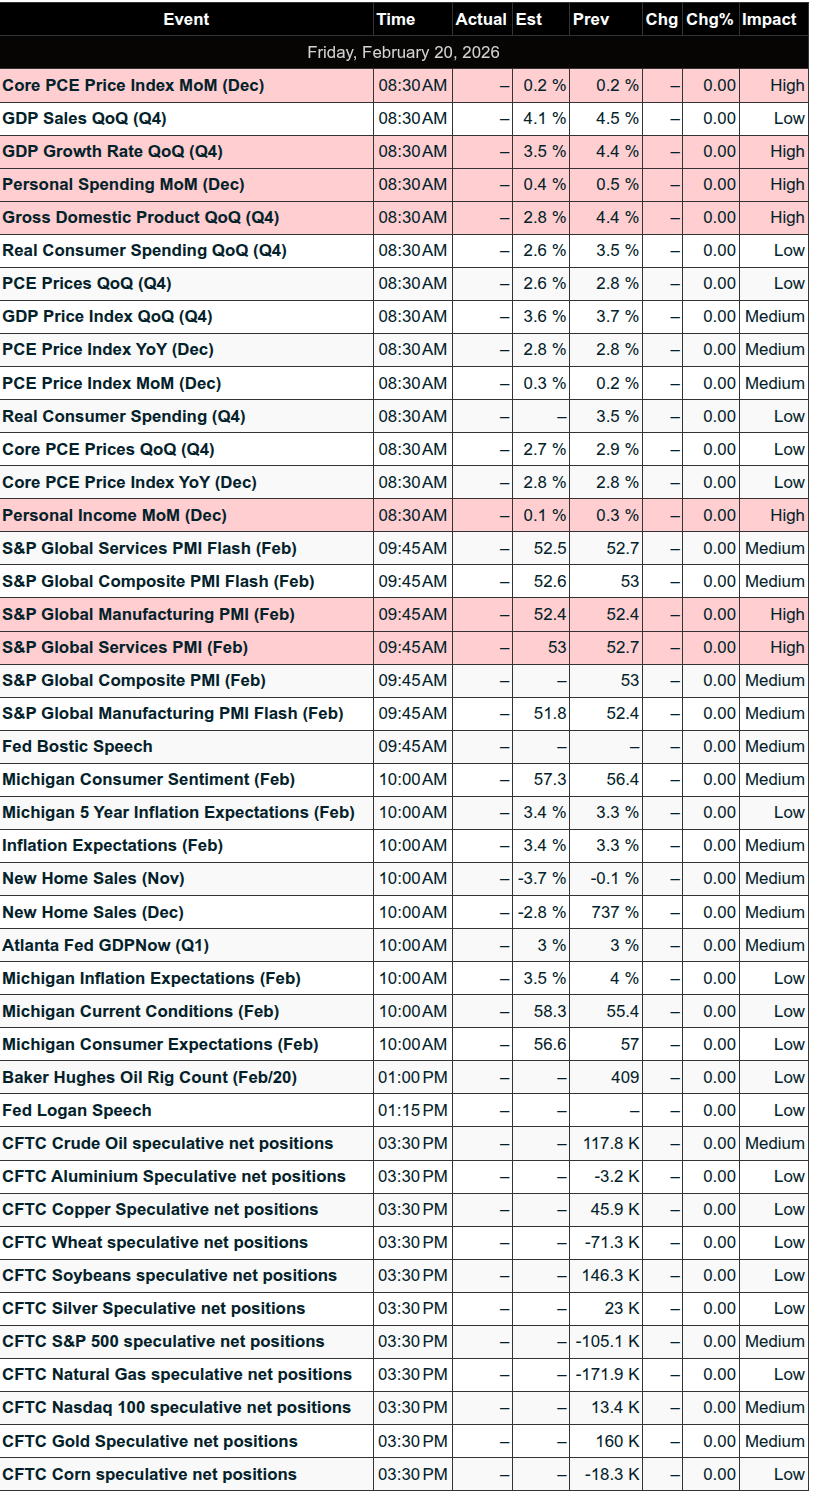
Markets are focused on several major catalysts today, led by the Core PCE Price Index (8:30am ET) and a potentially market-moving Supreme Court ruling on Trump-era tariffs. The Court convenes at 10:00am ET and could rule on whether tariffs imposed under the 1977 IEEPA law are legal. Any decision is expected to trigger sharp volatility in either direction.
Inflation & Economic Data
-
Core PCE expected at 2.8%, above the Fed’s 2% target.
-
Q4 GDP (first reading) also out at 8:30am ET.
-
Busy calendar includes Personal Income/Spending, PMIs (9:45am), New Home Sales, UoM Sentiment & Inflation Expectations (10:00am).
-
Fed speakers: Bostic (9:45am), Logan (12:45pm).
Global Trade & Geopolitics
-
US imports from Taiwan now exceed China for the first time in decades, driven largely by AI chip demand. Taiwan exports of tech products to the US surged over 200% YoY.
-
Chinese goods shipped to the US fell 44% YoY.
-
Oil prices are rising amid escalating US-Iran tensions, with Trump signaling a decision within 10 days on possible military action.
-
US also negotiating Venezuelan oil sales to India as trade/tariff dynamics shift.
Corporate Notes
-
Amazon Cloud experienced two December outages tied to internal AI tooling errors.
-
Premarket earnings: AngloGold Ashanti (AU), PPL.
-
Monday: Dominion Energy (D).
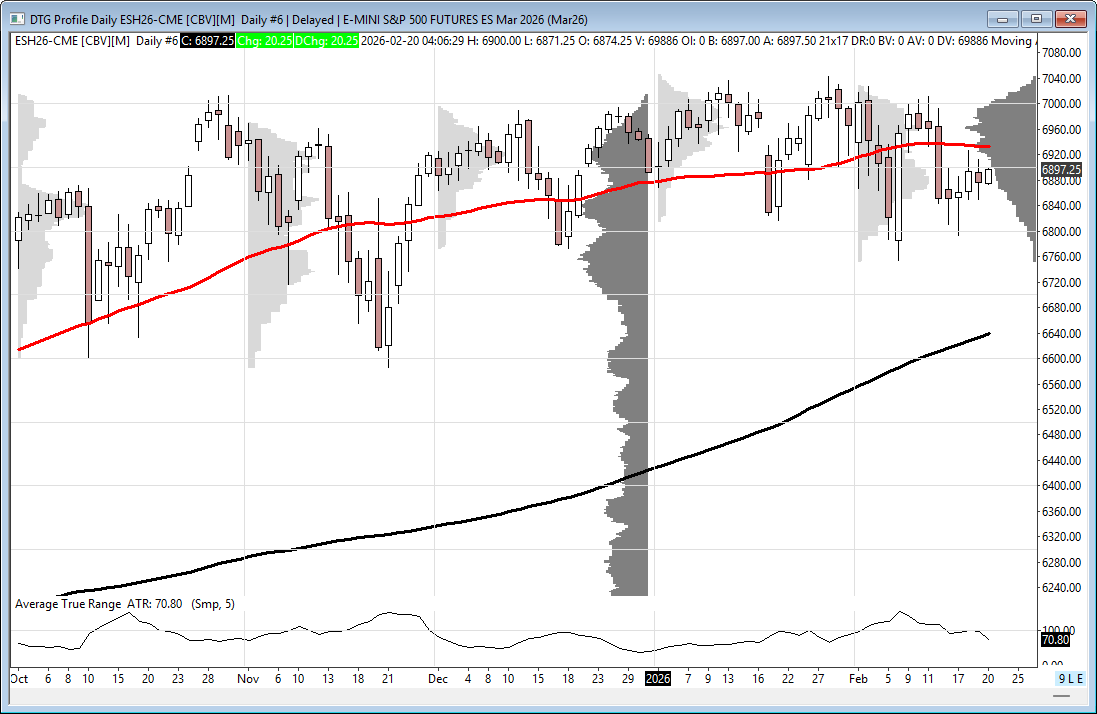
ES Technical Overview
-
Volatility remains elevated within a 3-month sideways consolidation beneath all-time highs.
-
5-day ADR: 95.25 points.
-
Price action remains mid short-term downtrend channel but within intermediate-term uptrend.
-
50-day MA at 6933 acting as loose resistance.
-
No strong overnight large trader (“whale”) bias.
Key ES Levels
-
Resistance: 6994/91s, 7145/50s
-
Support: 6800/03s, 6695/90s
Both bulls and bears have room to operate within current trend structures. Expect heightened volatility around data and any Supreme Court headlines.
Affiliate Disclosure: This newsletter may contain affiliate links, which means we may earn a commission if you click through and make a purchase. This comes at no additional cost to you and helps us continue providing valuable content. We only recommend products or services we genuinely believe in. Thank you for your support!
Disclaimer: Charts and analysis are for discussion and education purposes only. I am not a financial advisor, do not give financial advice and am not recommending the buying or selling of any security.
Remember: Not all setups will trigger. Not all setups will be profitable. Not all setups should be taken. These are simply the setups that I have put together for years on my own and what I watch as part of my own “game plan” coming into each day. Good luck!!
Follow @MrTopStep on Twitter and please share if you find our work valuable!
This post goes out as an email to our subscribers every day and is posted for free here around 2 PM ET. To get your real-time copy, sign up for the free or premium version here: Opening Print Subscribe.
Comments are closed