This post goes out as an email to our subscribers every day and is posted for free here around 2 PM ET. To get your real-time copy, sign up for the free or premium version here: Opening Print Subscribe.
Powell Cuts, Robots Rally, Humans Panic
Follow @MrTopStep on Twitter and please share if you find our work valuable!
FREE Two-Week Offer for the Opening Print Premium. Open up the Lean and other premium features for the next Two Weeks!
Our View
The ES made its 34th new all-time high on Monday and is on its way to its 35th. The NQ has made its 33rd new high and is on its way to its 34th. Has the public been hoodwinked again? It sure looks that way!!!
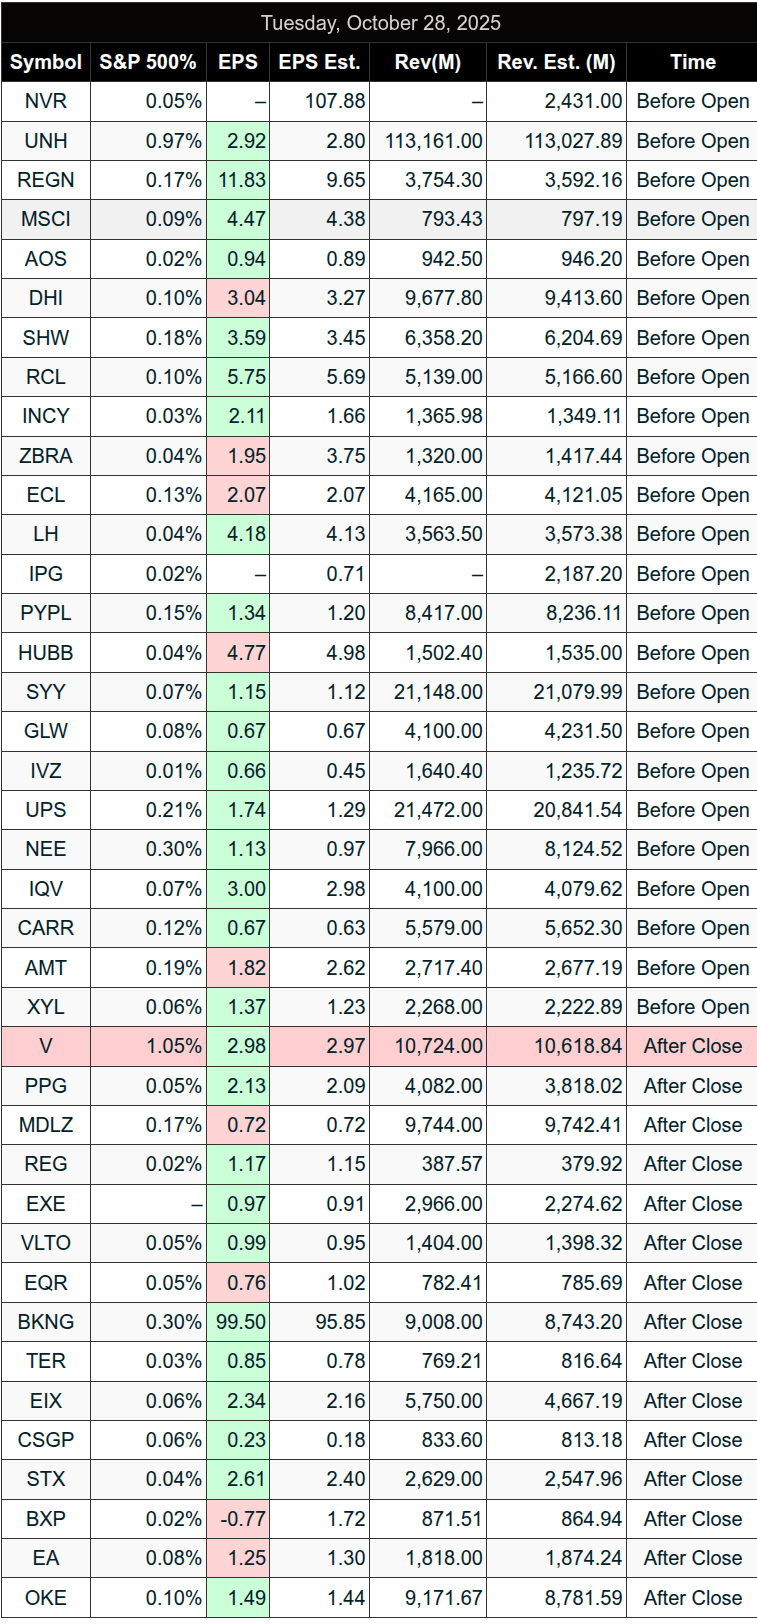
It’s not very often that there are so many events colliding at once—and today is one of those days. The Fed decision, plus MSFT, GOOG, and META all report after the close.
I asked GROK how much the Magnificent 7 have gained since their April 7 lows, and the answer is quite astonishing:
The Magnificent 7 stocks (AAPL, AMZN, GOOG, META, MSFT, NVDA, TSLA) have collectively gained approximately $8.9 trillion in market capitalization from April 7, 2025, to October 28, 2025. This represents a roughly 66% increase in their combined value over that period, driven by strong performances in AI-related leaders like NVDA and a broader tech recovery.
Stock
April 7 Price (Adj Close)
October 28 Price (Adj Close)
% Gain
AAPL
$169.21
$269.00
59%
AMZN
$190 (est)
$229.25
21%
GOOG
$142.66
$268.43
88%
META
$479.80
$751.44
57%
MSFT
$344.79
$542.07
57%
NVDA
$86.62
$201.03
132%
TSLA
$250 (est)
$460.55
84%
Total Market Cap: $21.68 trillion
There were some other stats, but they were so big I thought they were wrong. Either way, the Magnificent 7 continues to outperform and will more than likely continue to do so into the end of the year and into 2026.
On Tap
-
2:00 PM — Day 2 FOMC Interest Rate Decision
-
2:30 PM — Fed Chair Powell Press Conference
-
4:00 PM — After the Bell: MSFT, GOOGL, META
-
Late Evening — Trump/Xi Meeting
Our Lean
Barring some wayward headline, the ES and NQ should fall asleep after 10:30 and start to pick up around 1:30.
The ES’s four-day rally has added 150.75 points, and the NQ has gained a whopping 925 points. In the first part of the day, “thin to win” should play out. If the Fed is accommodative after the 0.25 bps rate cut, we could see another pop.
My concern is what happens if the ES and NQ rally too much after the Fed.
As for levels:
-
Downside: 6903, 6900, 6893, 6887, 6884, 6879–76, 6869–67, 6856, 6850, 6843
-
Upside: 5935, 5941–44, 5956, 5960, 5968–70, 6979, 6986, 6990, 6999
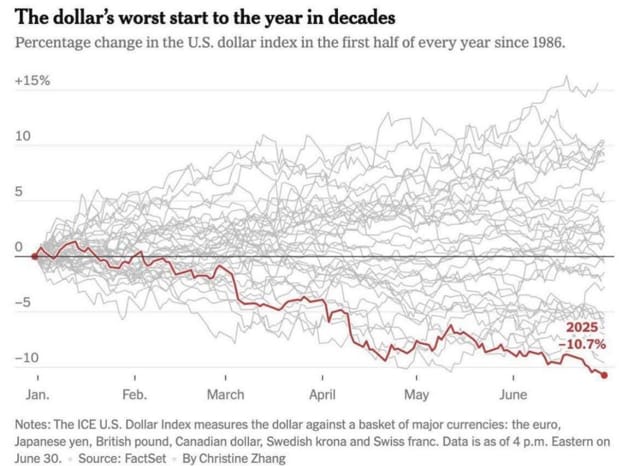
Dollar Decline 2025
This isn’t just a currency trend; it’s a lesson in wealth preservation. Fiat money erodes in value over time, while tangible assets—land, homes, and income-generating properties—retain their worth across economic cycles.
As the dollar weakens, real assets gain. It’s not chance, it’s economics—and this is one of the reasons I buy homes and property. I understand that if the dollar drops, real estate will fall, but people will still need homes to live in.
Is it a foolproof plan? Only time will tell.
Market Recap
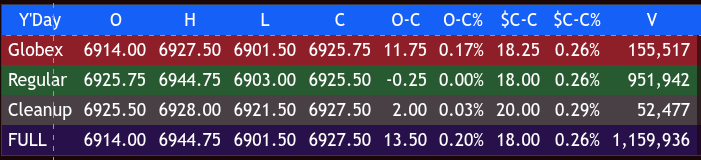
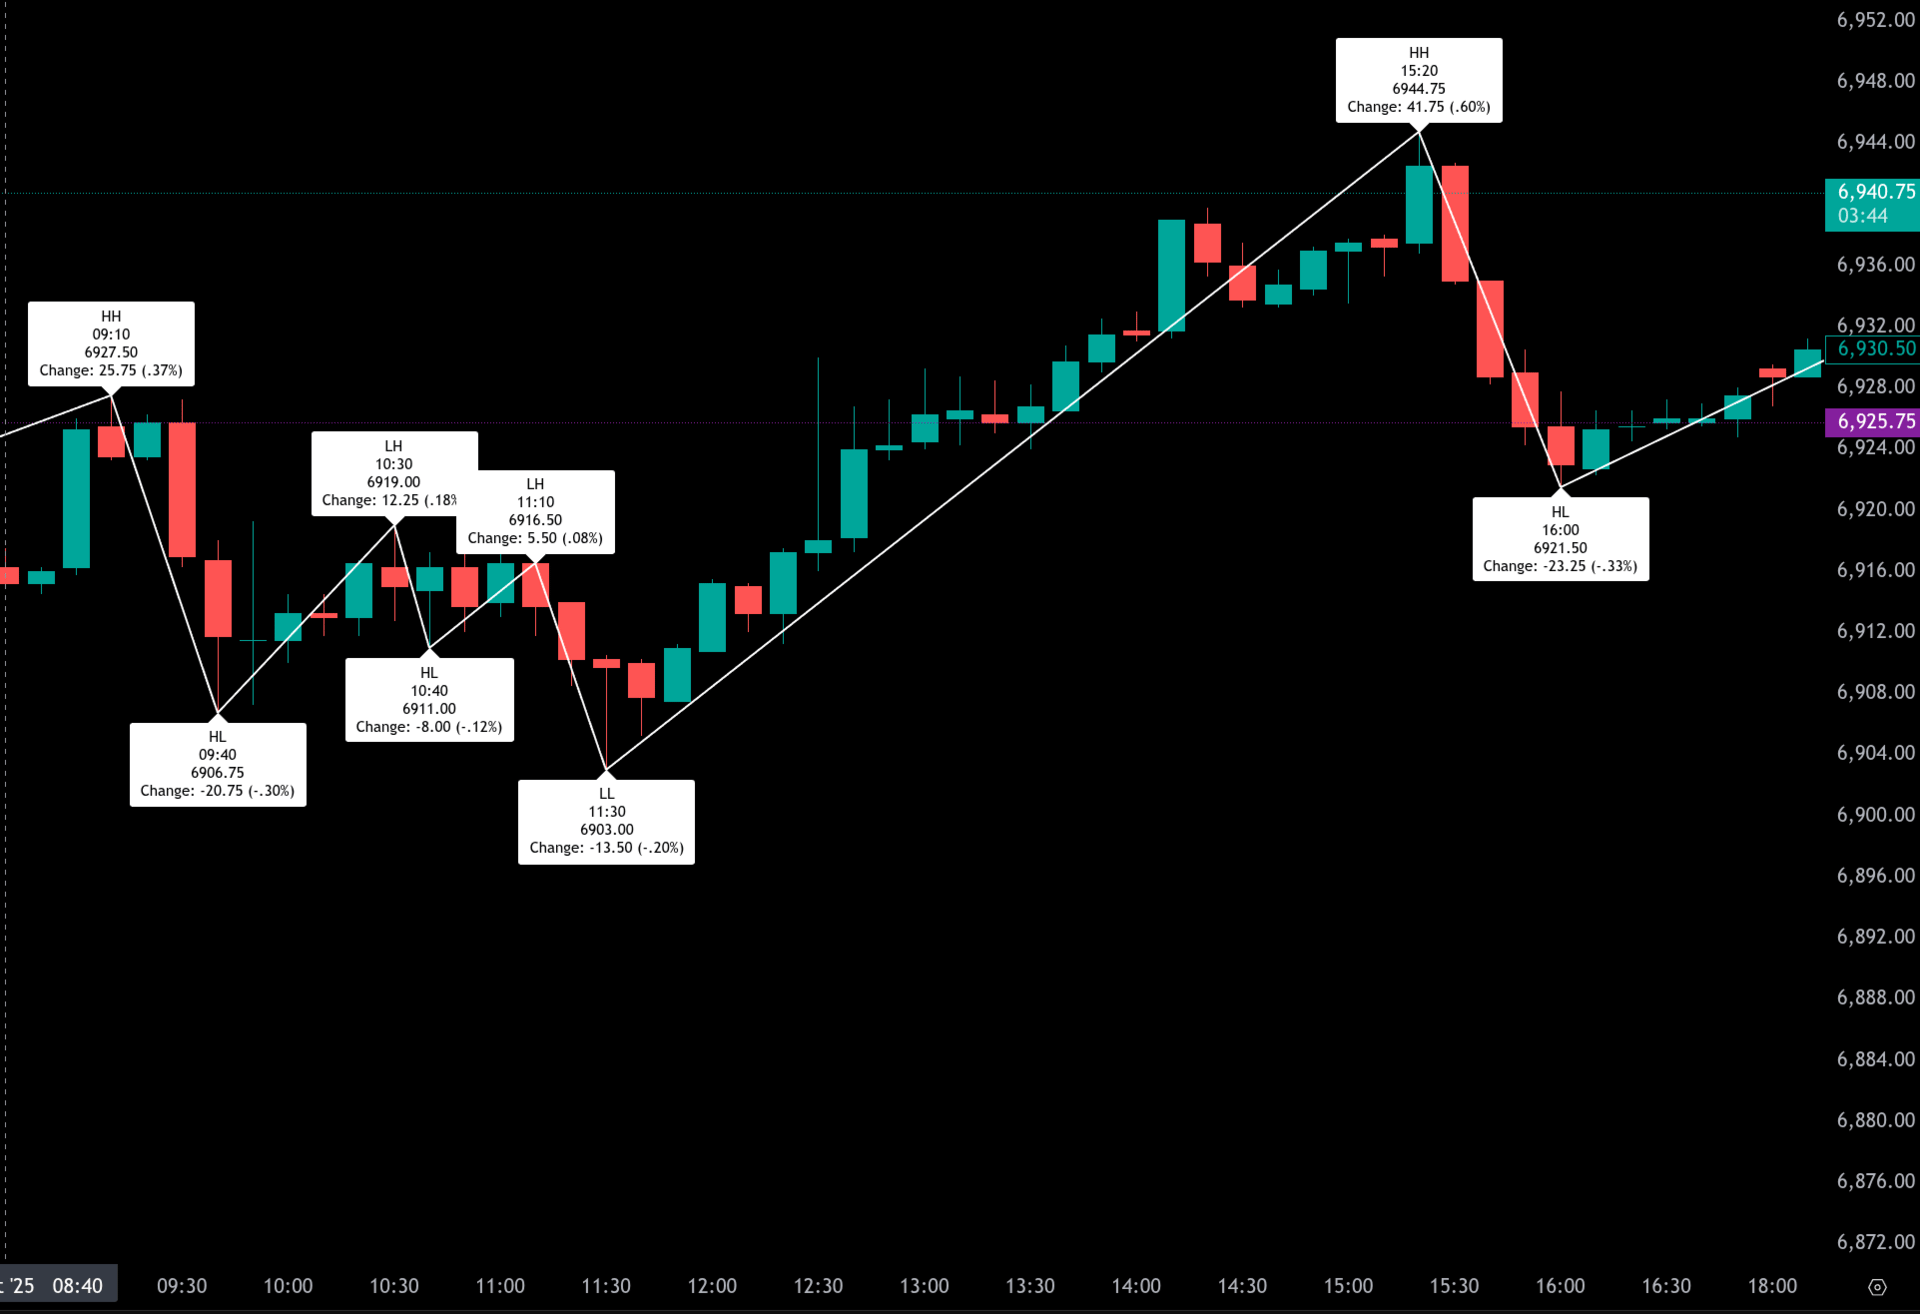
The ES made a low at 6901.00 and a high at 6927.50, with 155k contracts traded on Globex. It opened Tuesday’s regular session at 6925.75, rallied up to 6927.50 after the open, and then sold off
20.75 points down to 6906.75 at 9:51.
It rallied up to 6919.25, made a higher low, then a lower high at 6908.75, and stutter-stepped up to 6918.75. Weakness followed as the NQ started getting hit by some small sell programs, pushing the ES down to a new daily low at 6903 at 11:33.
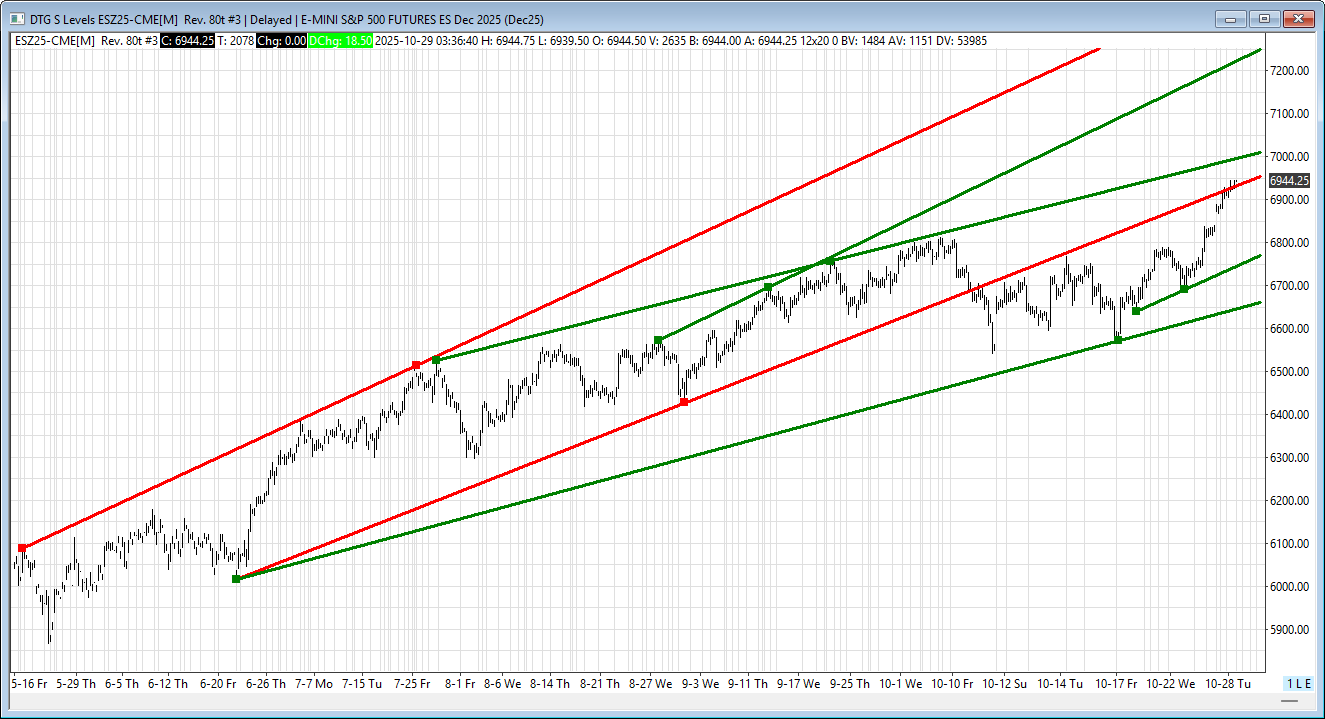
After the low, the ES traded up to the 6915.50 level, dropped 4 points, and then rallied up to 6930.00. It pulled back to 6917.00, traded up to a lower high at 6929.50 at 1:00, pulled back to the 6924 area at 1:36, traded up to 6939.75 at 2:21, then pulled back to 6933.50, chopped higher, and traded up to 6944.75 at 3:28.
The ES began to sell off, trading down to 6924.25 at 3:48. It traded 6929.00 as the 3:50 cash imbalance showed $1.8 billion to sell, with the Nasdaq showing $841 million for sale. It then traded up to 6930.25 at 3:57 and 6925.50 on the 4:00 cash close. After 4:00, the ES traded down to 6921.50, up to 6927.50, and settled at 6725.75, up 17.5 points or +0.25%.
The NQ settled at 26,163.50, up 199.75 points or +0.77% on the day.
Below is a table of the ES and NQ’s huge gains over the last four sessions:
Date
ES Change
ES % Change
NQ Change
NQ % Change
10/23/2025
+38.00
+0.56%
+214.75
+0.86%
10/24/2025
+52.00
+0.77%
+255.25
+1.01%
10/27/2025
+81.25
+1.19%
+454.50
+1.78%
10/28/2025
+17.50
+0.25%
+199.75
+0.77%
10/29/2025
unched
0.01%
+16.25
+0.06%
Total
+150.75
+2.22%
+925.75
+3.67%
No matter what the negatives are the S&P and NASDAQ continue to to march higher, the big question today, do they sell the news?
In the end, there is no fear.
In terms of the ES and NQ’s overall tone: they rallied, sold off, and rallied again.
In terms of the ES’s overall trade: volume was lower at 1.16 million contracts traded.
Guest Posts
Stock Trader’s Almanac
@AlmanacTrader #Jeff Hersch
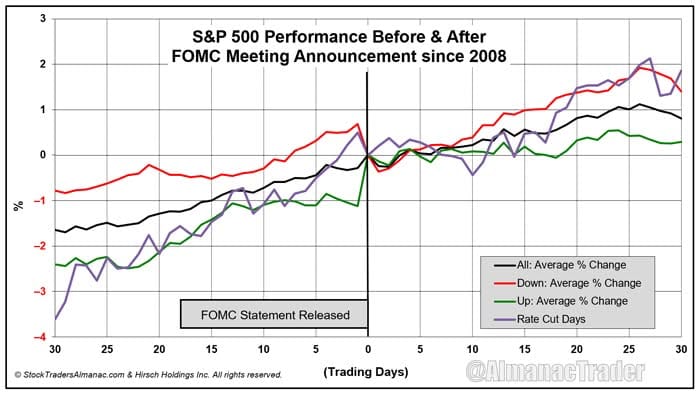
S&P 500 Down 4 of Last 7 Fed Rate Cut Announcement Days
In the accompanying chart the 30 trading days before and after the last 140 Fed meetings (back to March 2008) are graphed. There are four lines, “All,” “Up,” “Down,” and “Rate Cut Days.” Up means the S&P 500 finished announcement day with a gain, down it finished with a loss or unchanged.
In 140 scheduled Fed meetings, there have been just seven rate cuts. These seven cuts are represented by Rate Cut Days line. Of the seven cut days, S&P 500 was down 4 times and up 3 times with an average loss of 0.48% on all seven. The S&P 500’s worst decline when a rate cut was announced was 2.95% on December 18, 2024. On the day after the last seven rate cut announcements, S&P 500 has gained 0.18% on average (up 4 and down 3).
Historically, any weakness around the Fed meeting has been a “buy the dip” opportunity as S&P 500 has tended to rise after the Fed’s announcement over the following 30 trading days. Average S&P 500 gains were greatest when the S&P 500 closed down on announcement day.

S&P 500 (ES)
Prior Session was Cycle Day 1: Futures opened flat — a collective deep breath ahead of tomorrow’s FOMC decision and the double-feature of Trump–Xi talks + MegaCap earnings (6 of 7 Mag7). Translation: “Today’s mission — don’t blow yourself up before the main event.”
Price caught a bid mid morning and extended the prior “super-cycle” rally to the Money Box / CALL WALL zone before getting firmly rejected, closing lower, but securing a bullish session ahead of the FED.
🧠 PTG Takeaway
“Cycle Day 1 set the stage, not the climax.”
With the Fed and Mag7 earnings queued up midweek, today’s drift was the market’s version of a soundcheck — volume low, tension high. Tomorrow, the orchestra plays.
Range was 43 handles on 1.159M contracts exchanged
For greater detail of how this day unfolded, click on the Trading Room RECAP 10.28.25 link.
…Transition from Cycle Day 1 to Cycle Day 2
Transition into Cycle Day 2: Normally for CD2 we are anticipating some consolidation MATD rhythms to begin the session.
The BIG Event for today is the FOMC Statement and Presser which is expected to have “market impact.”
CME FedWatch Tool has a 99.5% chance for a cut.
Below we preview FOMC:
✅ What’s expected
-
Markets are overwhelmingly pricing in a 25 basis-point cut (0.25%) to move the federal funds rate from its current range of 4.00 %-4.25 % to 3.75 %-4.00 %. Reuters+3Reuters+3Trading Economics+3
-
Probability metrics: The CME Group’s FedWatch tool shows odds near ~98% for a 25 bp cut. Polymarket+1
🔍 Why they’re likely to cut
-
Labor market softness: Employment growth has decelerated, raising concerns about downside risks to jobs. Reuters+1
-
Cooling inflation (but still above target): The September Consumer Price Index (CPI) rose 3% year-over-year, slightly under expectations. Core inflation likewise eased a bit. Investopedia+1
-
Policy tilt/communication: The Fed’s language and speeches by Chair Jerome Powell suggest they’re tilting toward “another cut is appropriate” if conditions permit. Investopedia+1
-
Market/emphasis signal: Bond markets are reacting as though a cut is “baked in,” reducing longer-dated Treasury positions ahead of the meeting. Reuters
❗What to watch / risks-
Inflation stickiness: Even though inflation is easing, it’s still well above the Fed’s 2 % target, so any surprise uptick could cause the Fed to hesitate or moderate their language. Reuters+1
-
Data black-out / cloudiness: The U.S. government shutdown has delayed key labor and economic data, meaning the Fed is operating with more uncertainty than usual. Reuters+1
-
Forward guidance matters: The cut might happen—but the market really cares about what the Fed says it will do next. If they signal fewer or smaller cuts ahead, that matters a lot for markets and borrowing costs. Reuters+1
🎯 Bottom line for you
Yes — the Fed is very likely (≈ 99.5% odds) to announce a 25 bp rate cut at the October meeting, taking the target range to 3.75%-4.00%. The bigger story will be what they say about future cuts. Markets are expecting more easing later this year, so any signal that they’re less enthusiastic could shake things.
-
Of course, nothing changes for PTG…Simply follow your plan. Take only Triple A setups and manage the $risk. ALWAYS HAVE HARD STOP-LOSSES in-place on the exchange.
PTG’s Primary Directive (PD) is to ALWAYS STAY IN ALIGNMENT with the DOMINANT FORCE.
As such, scenarios to consider for today’s trading.
Bull Scenario: Price sustains a bid above 6925+-, initially targets 6940 – 6945 zone.
Bear Scenario: Price sustains an offer below 6925+-, initially targets 6910 – 6905 zone.
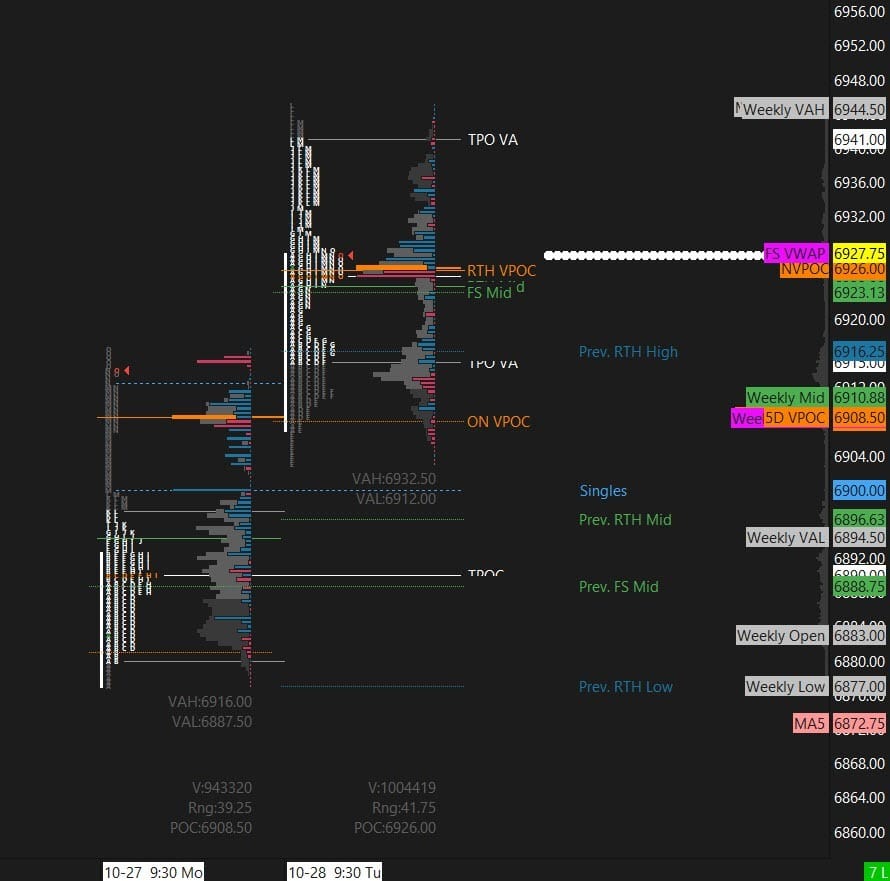
PVA High Edge = 6938 PVA Low Edge = 6913 Prior POC = 6926
ESZ
Thanks for reading, PTGDavid
MiM
MOC Recap – October 29, 2025
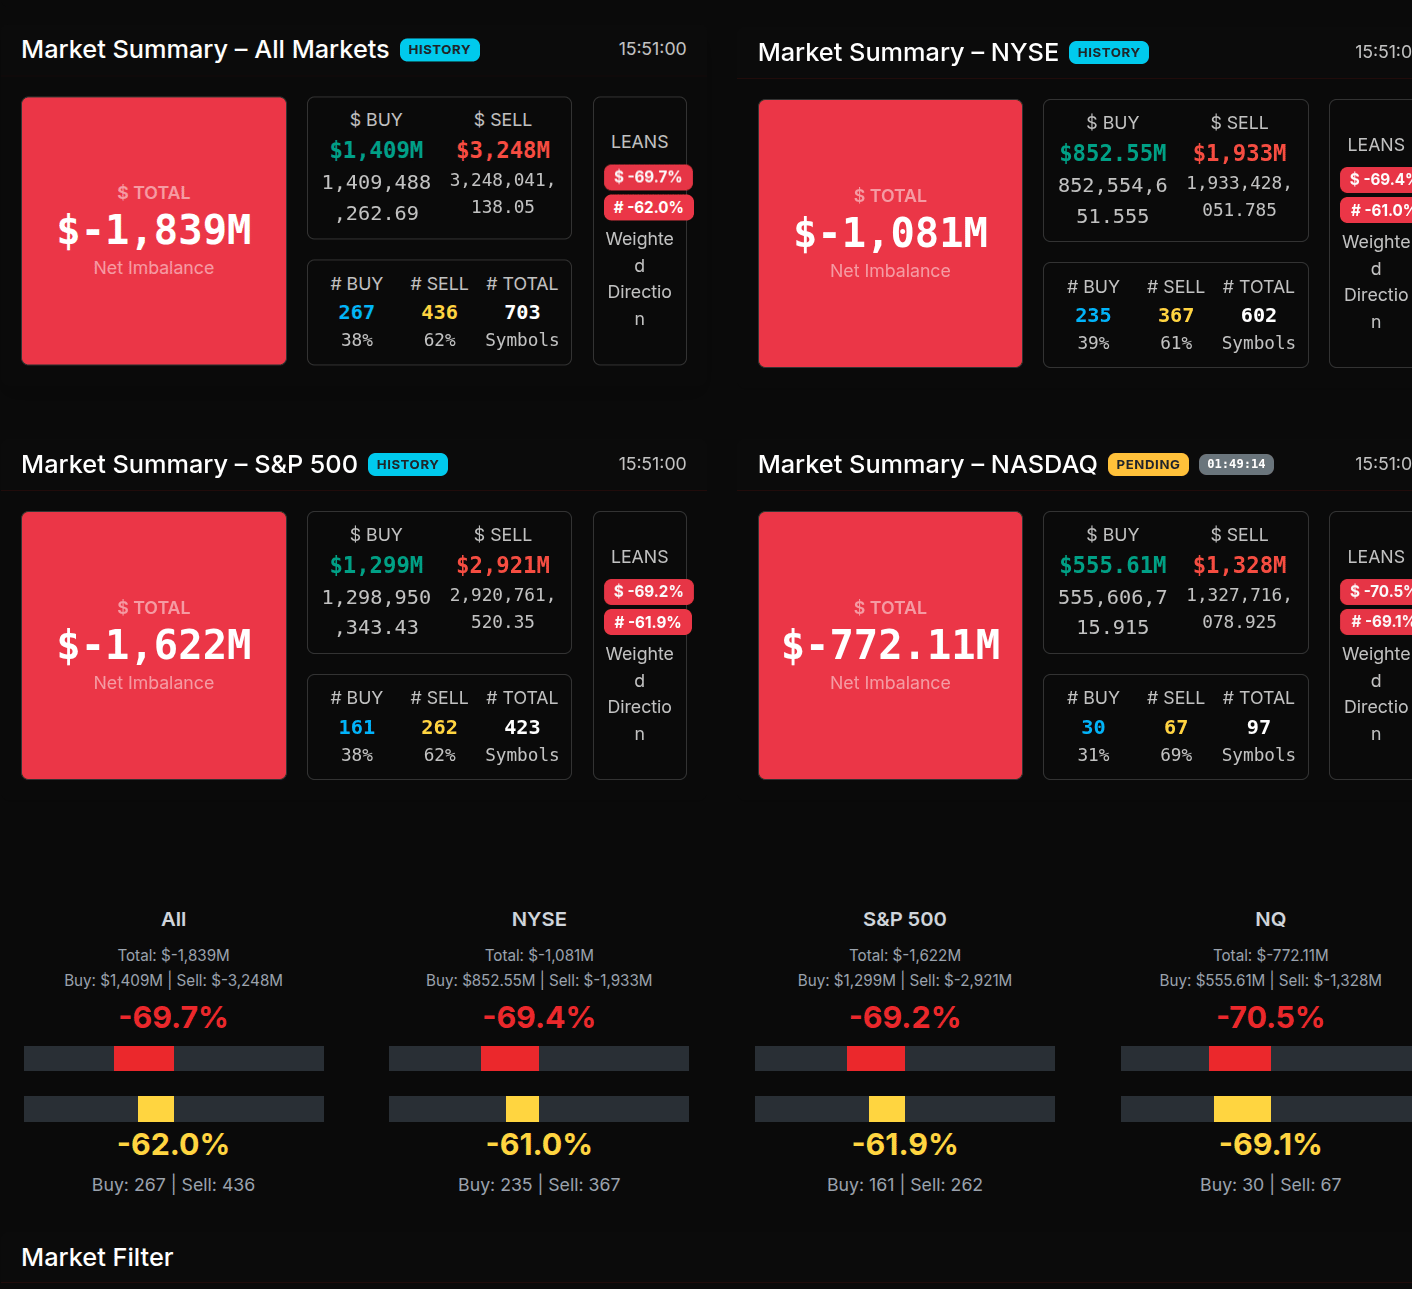
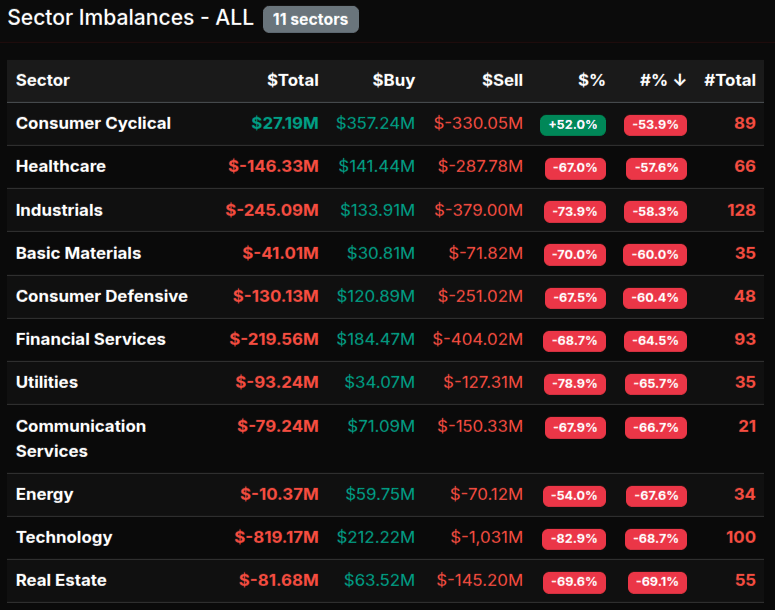
The Market-on-Close (MOC) session opened with moderate rotation but quickly leaned into heavy sell pressure. By 15:51 ET, total net imbalance across all markets reached –$1.84 billion, with sells outpacing buys by more than 2.3:1. The S&P 500 showed the deepest weight at –$1.62 billion (–69%), followed by the NYSE at –$1.08 billion (–69.4%) and NASDAQ at –$772 million (–70.5%).
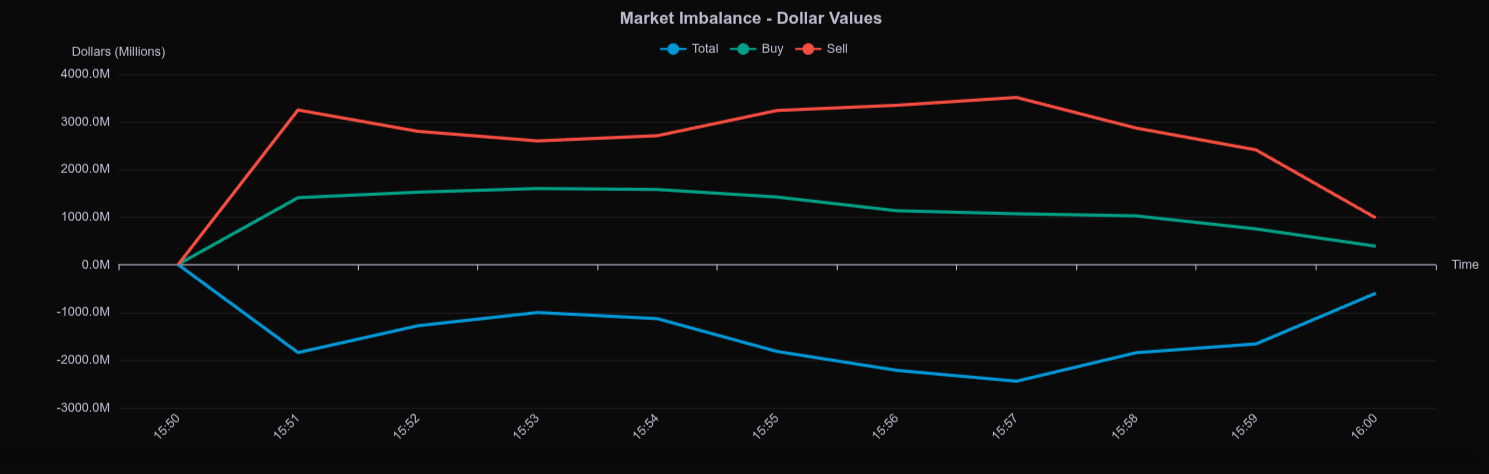
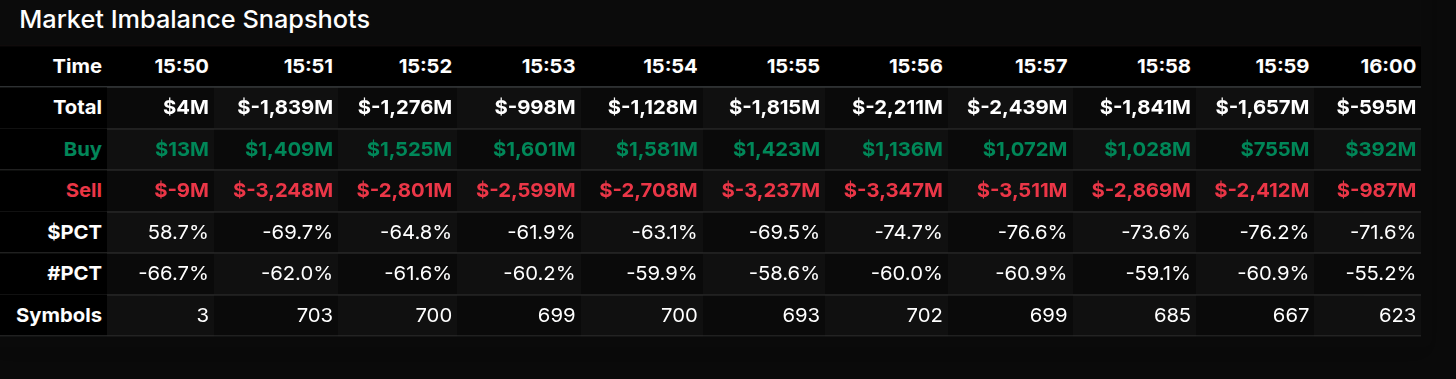
Although all exchanges opened the 15-minute auction window with mixed bids, sellers quickly took control, driving the weighted lean below –60% across every major index. The imbalance curve confirms a strong wave of selling between 15:53 and 15:57 before buyers stabilized the tape into the close, trimming the net deficit to –$595 million at 16:00.
Sector flow showed the clearest pressure in Technology (–$819 million, –82.9%), Industrials (–$245 million, –73.9%), and Financial Services (–$219 million, –68.7%), each showing broad-based selling across major components. Consumer Cyclical stood out as the lone bright spot, posting a small +$27 million net buy (+52%), reflecting some defensive repositioning ahead of earnings.
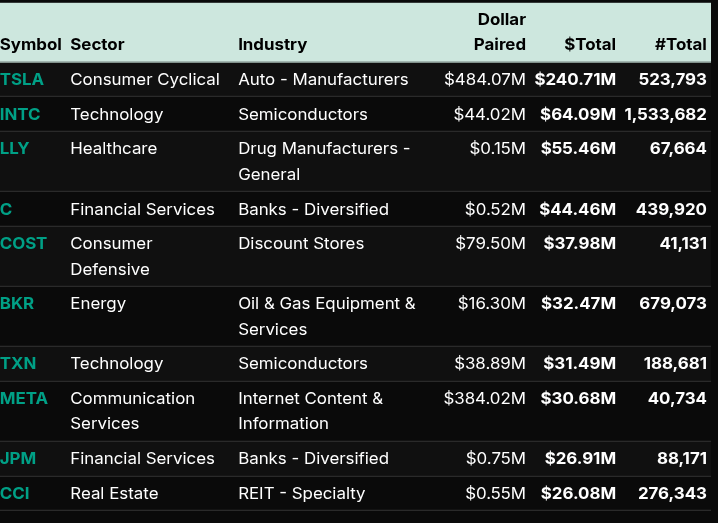
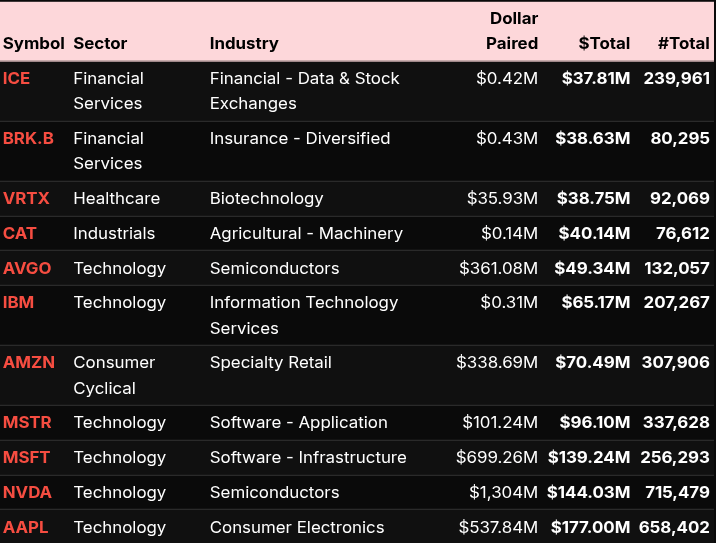
Among individual names, NVDA (–$1.30 billion paired), MSFT (–$699 million), and AAPL (–$537 million) dominated sell-side imbalances, continuing the technology sector’s unwind. On the buy side, notable support appeared in TSLA (+$484 million) and AMZN (+$338 million), suggesting selective rotation within large-cap growth. Financials such as JPM and C also saw mild bid interest, while BRK.B and ICE remained net sellers.
By symbol lean, readings exceeding |66%| confirm a wholesale sell environment, particularly in tech and industrials, while consumer cyclicals and energy showed more rotational profiles near the 50% threshold.
Overall, the MOC reflected a decisive end-of-day de-risking event dominated by technology and industrial liquidation, partially offset by opportunistic buying in consumer names. The late-session recovery trimmed the worst of the imbalance but left sentiment tilted firmly negative into the Fed announcement.
Technical Edge
Fair Values for October 22, 2025:
-
SP: 36.38
-
NQ: 156.2
-
Dow: 189.37
Daily Market Recap 📊
For Tuesday, October 21, 2025
• NYSE Breadth: 47% Upside Volume
• Nasdaq Breadth: 57% Upside Volume
• Total Breadth: 56% Upside Volume
• NYSE Advance/Decline: 57% Advance
• Nasdaq Advance/Decline: 48% Advance
• Total Advance/Decline: 51% Advance
• NYSE New Highs/New Lows: 68 / 20
• Nasdaq New Highs/New Lows: 186 / 72
• NYSE TRIN: 1.53
• Nasdaq TRIN: 0.68
Weekly Market 📈
For the week ending Friday, October 17, 2025
• NYSE Breadth: 57% Upside Volume
• Nasdaq Breadth: 55% Upside Volume
• Total Breadth: 55% Upside Volume
• NYSE Advance/Decline: 64% Advance
• Nasdaq Advance/Decline: 59% Advance
• Total Advance/Decline: 61% Advance
• NYSE New Highs/New Lows: 230 / 136
• Nasdaq New Highs/New Lows: 564 / 296
• NYSE TRIN: 1.36
• Nasdaq TRIN: 1.15
ES Levels
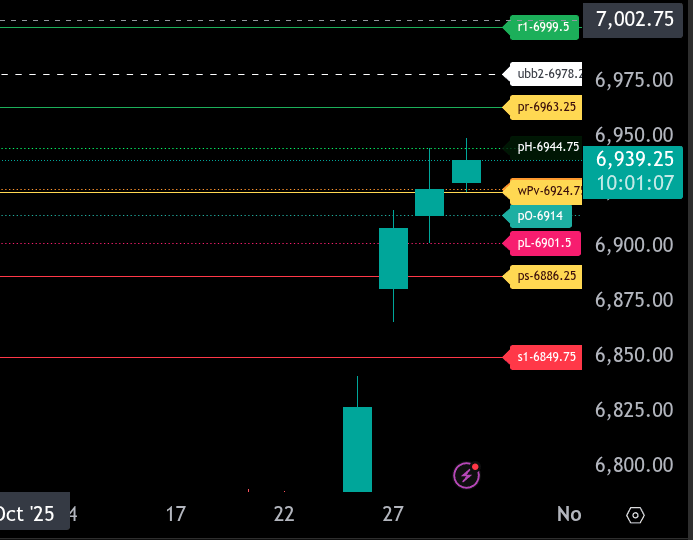
The bull/bear line for the ES is at 6924.75. This level will determine intraday sentiment; holding above favors continued upside, while trading below shifts bias to bearish.
Currently, ES is trading around 6939.25, showing early strength above the bull/bear line. If it can sustain above this area, the next upside targets are 6944.75 and 6963.25, our upper range target for today. A break over 6963.25 opens the door for a move toward 6978.25 and potentially 6999.50.
On the downside, initial support sits near 6914.00 and 6901.50. Losing 6901.50 would expose 6886.25, the lower range target. Below that, deeper support appears at 6849.75.
The overnight tone is constructive as long as price remains above 6924.75. Bulls need to defend that pivot to maintain momentum into the cash open. A failure below that line would likely bring a retest of 6886.25 before buyers step back in.
NQ Levels
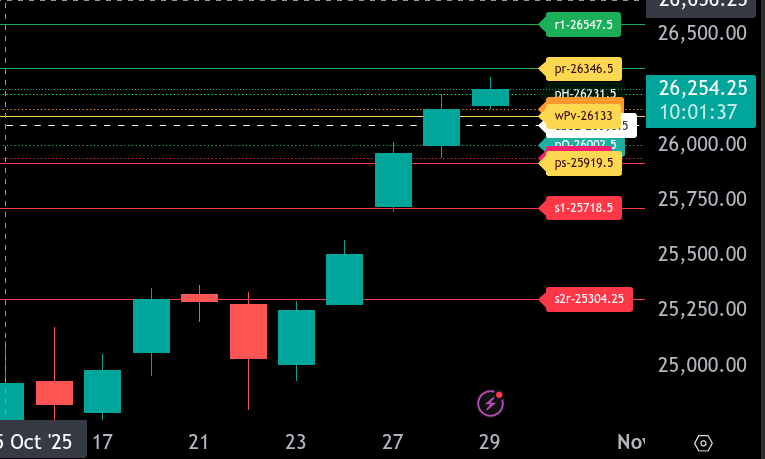
The bull/bear line for the NQ is at 26133. This is the key level separating bullish from bearish sentiment. Trading above this level keeps buyers in control, while a sustained move below would shift momentum back to the sellers.
Currently, NQ is trading around 26256.25, holding above the bull/bear line and indicating a positive tone early in the session. The market is attempting to establish value above yesterday’s pivot zone.
The upper range target for today is 26346.50. If the NQ can sustain trade above 26231.50 (recent high), a push toward that upper target is likely. A breakout above 26346.50 opens room toward 26547.50 as the next upside resistance.
On the downside, the lower range target sits at 25919.50. A move back below 26133 could trigger profit-taking and bring tests of 26002.50 and 25943.00. If those supports fail, expect follow-through selling toward 25718.50.
Overall, the trend bias remains bullish above 26133. As long as buyers defend that level, the path of least resistance points higher toward 26346.50 and 26547.50. However, losing 26133 would quickly neutralize momentum and expose the lower targets.
Calendars
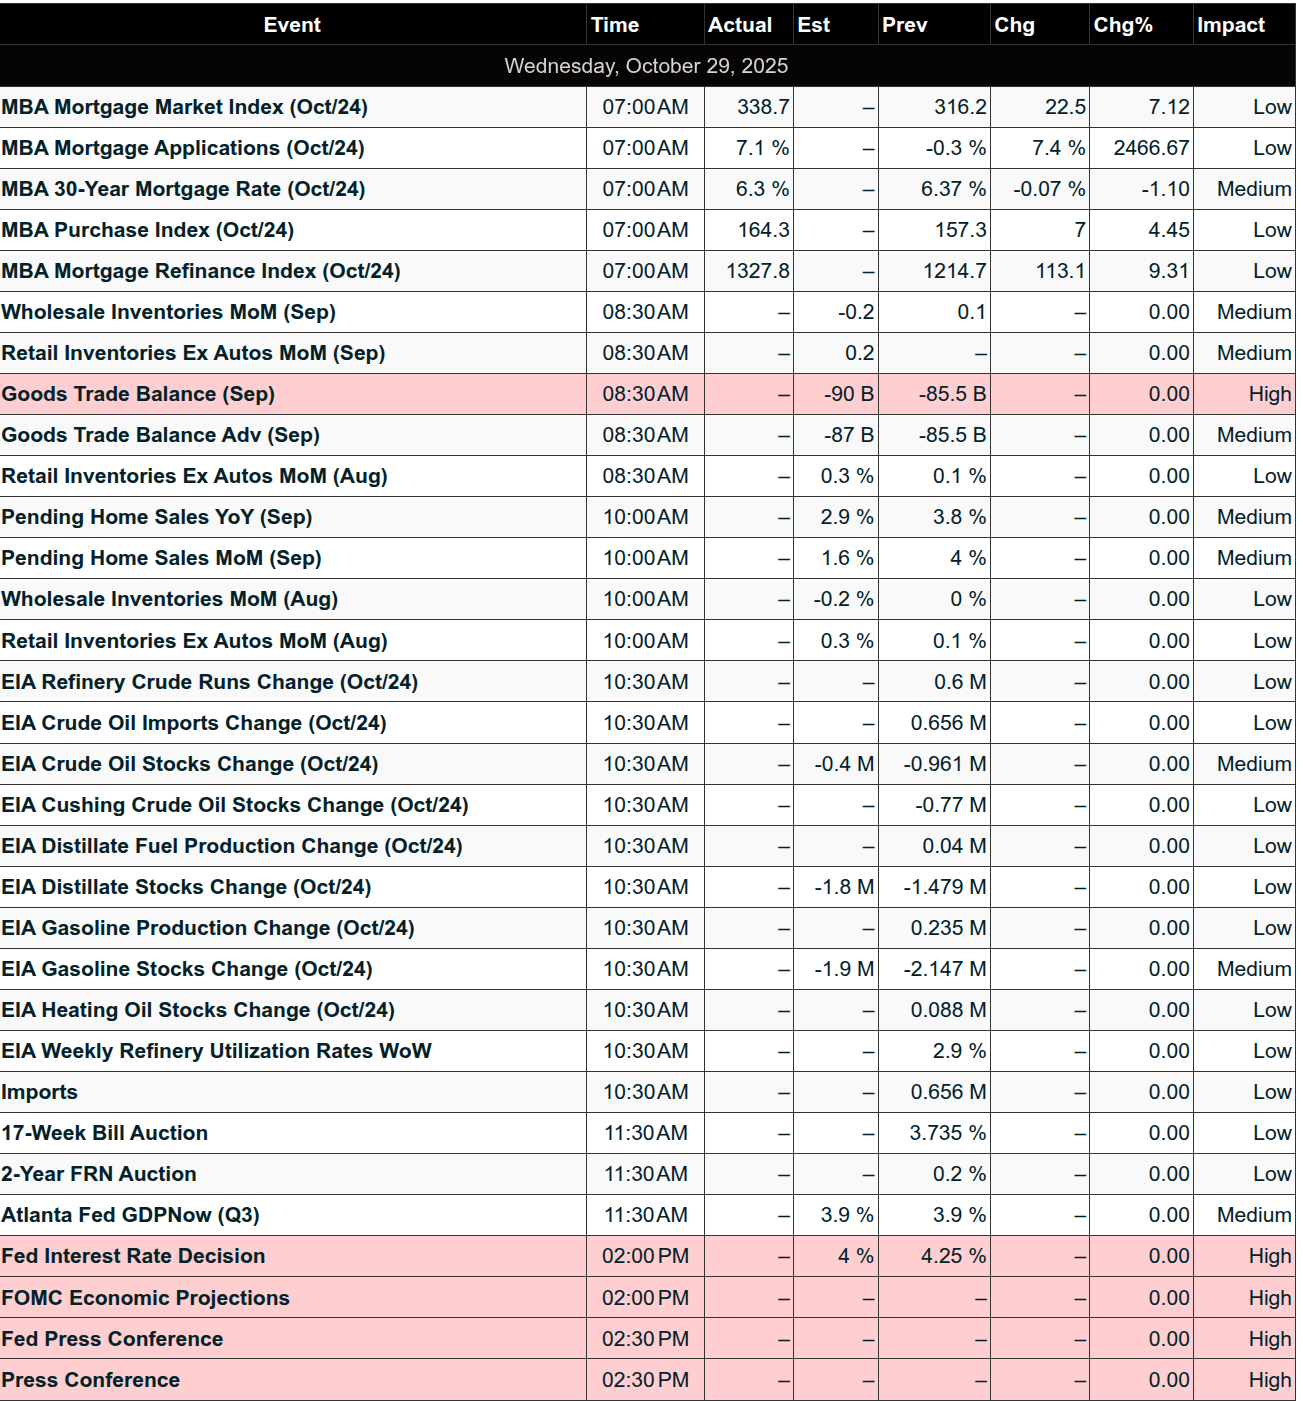
Economic
Today
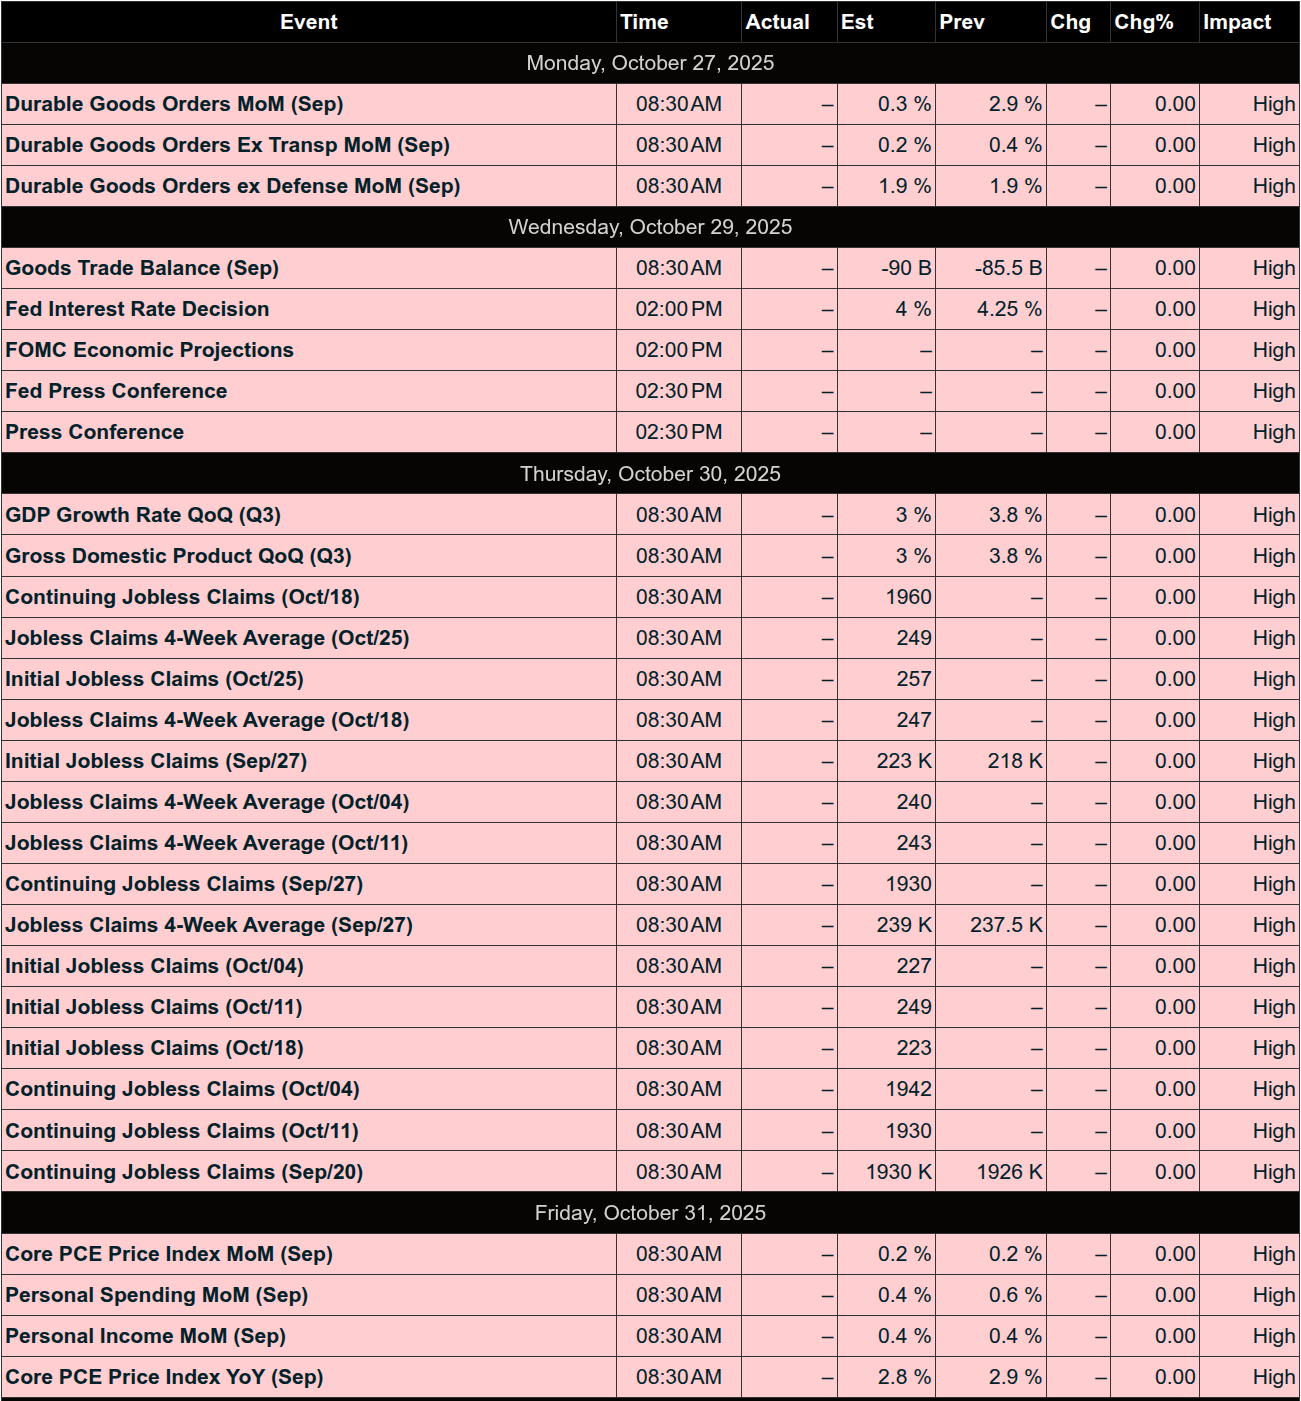
Important Upcoming / Recent
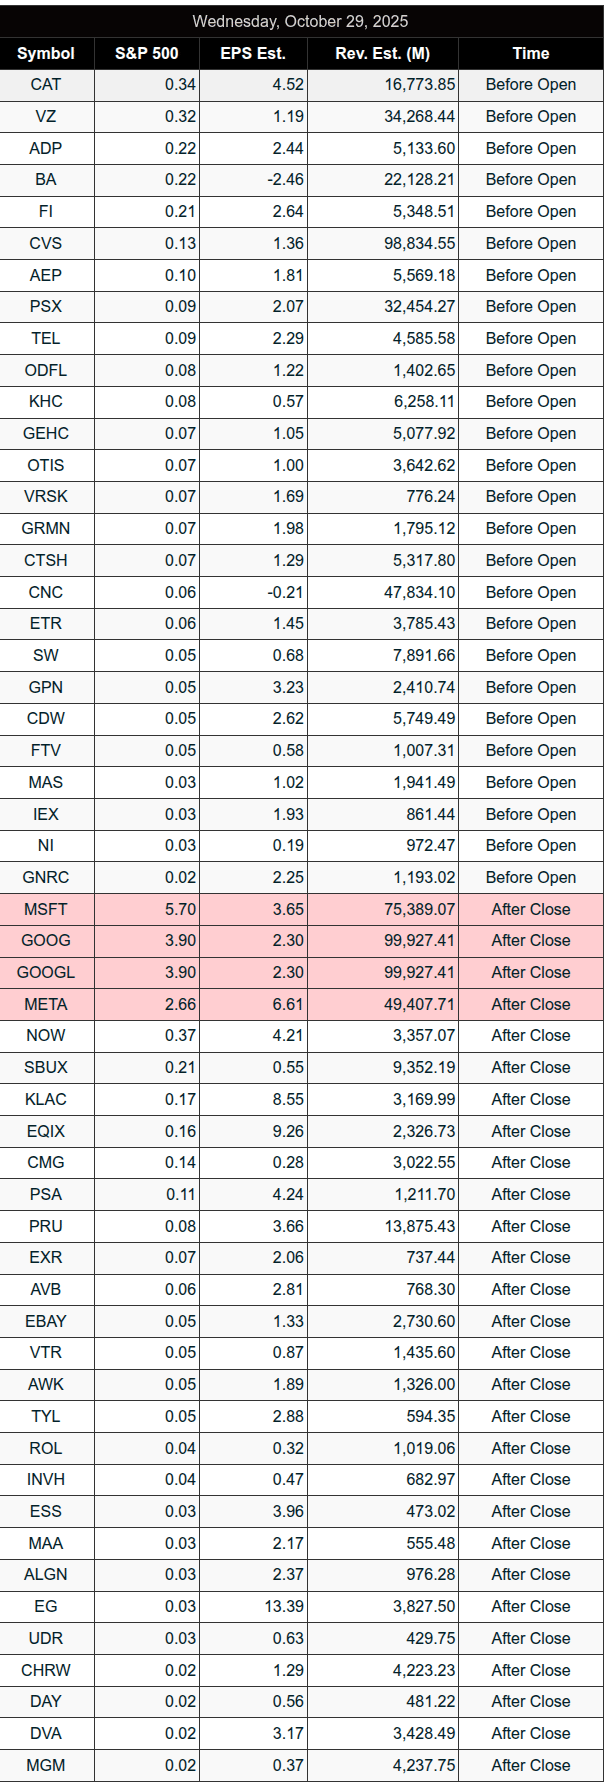
Earnings
Upcoming
Recent
Trading Room Summaries
Polaris Trading Group Summary – Tuesday, October 28, 2025
The day opened with a continuation of bullish momentum from Monday’s late spike, but with a cautious undertone ahead of Wednesday’s FOMC announcement. Despite early upward progress, the day featured mixed sentiment, order flow complexity, and ultimately driftier action, fitting a typical pre-FOMC market.
Key Trades and Setups
Morning Setups & Wins:
-
Pre-Market Structure Analysis (Manny):
-
Highlighted acceptance of yesterday’s late spike and poor structure ignored below singles, which primed for a continuation long setup.
-
Main trade level: 6902.75 ES
-
Triggered with a retest and rising delta
-
Targets: 6910 → 6916 → 6925 → 6932
-
First scale +5 points was achieved.
-
-
Also posted multiple structured Look Below & Fail (LB&F) trade plans for intraday reversals, including levels at 6676, 6901, and 6876.
-
-
7:48 AM: Manny reports first scale +5 pts from the overnight continuation setup — a solid early win.
-
9:01 AM: Manny with a sharp +15 pt fill — a standout highlight of the day’s trading.
Midday Plays:
-
PTGDavid called A4 and A10 long triggers, with Bruce F confirming targets 1-3 were hit on the ES — a clean and complete trade cycle.
-
John B also reported catching a quick win on a news-driven move around 12:30 PM, likely related to China headlines. Multiple members congratulated the play.
Lessons & Insights:
-
Discipline in Uncertainty:
Manny noted he didn’t get to full size on his earlier trade but still walked away with a win. This emphasized managing risk and adapting to market flow rather than forcing entries. -
Order Flow Mastery (Manny):
Shared personal reflections on order flow reading, reinforcing that while the look may change day-to-day, the edge comes from experience and context — a reminder that some skills are more “art” than formula. -
Gamma Awareness:
PTGDavid shared that the 6934 CALL WALL was a key gamma level. Though uncertain whether it would act as resistance, members were encouraged to monitor reactions, not assume outcomes. This was an important learning moment around non-linear behavior near option-driven inflection points. -
Market Rhythms:
-
Clock Timing Guide posted by Manny gave useful high/low timing windows throughout the day.
-
Despite a quiet midday, the Lunch Low → Afternoon High rhythm seemed to play out well, aligning with Manny’s early forecast.
-
Strategy & Flow Notes:
-
“Captain Condor” Positioning:
Gamma Guys’ note pointed out significant condor structures at 6895-6840, which created the key intraday “seek and destroy” targets. The market largely respected these zones in a range-bound fashion. -
PTGDavid emphasized a “short bias” into the afternoon, especially with weak breadth and a $1.8B MOC sell imbalance — signaling caution into the close.
Summary of Key Wins
-
+5 pts early scale (Manny)
-
+15 pts standout win mid-morning (Manny)
-
Complete target cycle on A10 long trade (PTGDavid/Bruce F)
-
Quick headline scalp (John B)
Final Takeaways:
-
Respect context, especially pre-FOMC.
The team recognized the “calm before the storm” and traded appropriately lighter and more surgically. -
Don’t force size; let the market prove it.
Manny’s quote “a W is a W” echoed across trades that respected the plan but didn’t need to max out risk. -
Options flow and gamma levels matter.
Gamma Call Wall around 6934-6937 gave clues into overhead resistance and caution zones.
Today (FOMC) promises more volatility. Yesterday was about staying sharp, booking gains where possible, and preserving capital for better setups.
On Deck: FOMC volatility + Big Tech earnings + Trump/Xi news = Potential fireworks. Stay tactical.
Discovery Trading Group Room Preview – Wednesday, October 29, 2025
-
Macro Focus:
All eyes on the Fed today. A 25 bps rate cut is fully priced in (99.9% probability per FedWatch), with the market focused on forward guidance into December and beyond. FOMC policy statement at 2:00pm ET, followed by Powell’s presser at 2:30pm ET. Expect elevated volatility around these events.Earnings Spotlight:
A pivotal two-day stretch for tech earnings kicks off with Alphabet, Microsoft, and Meta reporting after the bell today. Apple and Amazon follow tomorrow. AI spending and ROI will be key focus areas and could drive market direction into year-end.Nvidia Mania:
Nvidia (NVDA) is soaring, up over 7% and trading above $200 on a string of major announcements. Market cap nears $5T. Highlights include:-
DOE building 7 supercomputers with 10,000 Blackwell GPUs.
-
Partnerships with Uber, Nokia, Palantir, Oracle, Cisco, T-Mobile, and others.
-
NVQLink announced to drive quantum computing with Rigetti & IonQ.
-
CEO Jensen Huang projects $500B in GPU sales by 2026 and lauds Trump for AI policy support.
Corporate Earnings (Premarket):
Big names include Boeing (BA), CVS Health (CVS), Caterpillar (CAT), Kraft Heinz (KHC), Verizon (VZ), and dozens more.Earnings (After Hours):
Key reports: Alphabet (GOOG), Meta (META), Microsoft (MSFT), Chipotle (CMG), Starbucks (SBUX), and eBay (EBAY), among others.Other Headlines:
-
U.S. government shutdown persists.
-
Economic data: Pending Home Sales (10:00am ET), Crude Inventories (10:30am ET).
-
ES 5-day average daily range rises to 73 points.
-
Whale bias slightly bearish pre-open amid lighter large trader volume.
Key ES Technical Levels:
-
Resistance: 6933/38, 7000/05, 7250/55
-
Support: 6763/68, 6660/65
-
Affiliate Disclosure: This newsletter may contain affiliate links, which means we may earn a commission if you click through and make a purchase. This comes at no additional cost to you and helps us continue providing valuable content. We only recommend products or services we genuinely believe in. Thank you for your support!
Disclaimer: Charts and analysis are for discussion and education purposes only. I am not a financial advisor, do not give financial advice and am not recommending the buying or selling of any security.
Remember: Not all setups will trigger. Not all setups will be profitable. Not all setups should be taken. These are simply the setups that I have put together for years on my own and what I watch as part of my own “game plan” coming into each day. Good luck!
This post goes out as an email to our subscribers every day and is posted for free here around 2 PM ET. To get your real-time copy, sign up for the free or premium version here: Opening Print Subscribe.
Comments are closed