Q3 Kicks Off With a Short Trading Week
Follow @MrTopStep on Twitter and please share if you find our work valuable!
Our View
There are a few things to watch for, but largely, it’s expected to be a pretty quiet trading week.
That’s as there are just three full trading days this week as we kick off both the start of July and the start of Q3. Markets will be closed for July 4th on Thursday and equity markets will close early at 1 p.m. ET on Wednesday.
For many traders, that will have them taking off Friday too — and the low volumes we’ve seen over the past two months help support that idea as well.
Despite a short trading week and likely low volumes, this week features a few key economic reports. Aside from a few Fed speakers in the lineup this week, we have ISM data today, European CPI and the JOLTs report tomorrow, the Fed Minutes on Wednesday afternoon — after the market close by the way — and the monthly jobs report on Friday.
Our Lean
I won’t return from Chicago until tomorrow, so I am staying away from trading the markets until then. However, it must be reiterated that it’s the start of a new month and a new quarter, which should bring new inflows to the market.
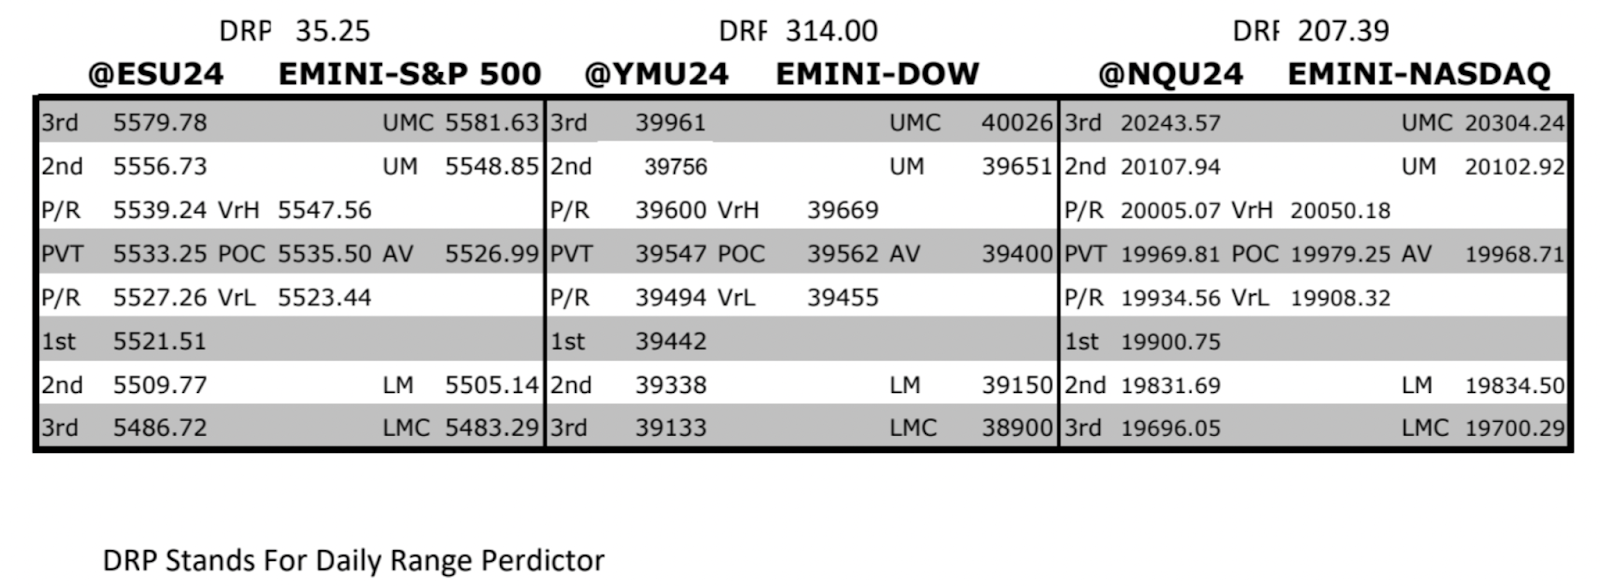
With last week’s 0.23% decline, the ES technically snapped its three-week win streak. We are now trading at the same level we were two weeks ago on Monday June 17, as we’ve had a lot of digestion and consolidation. Currently, 5,500 to 5,520 has been support, while 5,550 and 5,580-90 has been resistance. Until that changes, we’ll keep those levels in mind.
MrTopStep Levels:
Technical Edge
-
NYSE Breadth: 57% Upside Volume
-
Nasdaq Breadth: 51% Upside Volume
-
Advance/Decline: 60% Advance
-
VIX: ~13
ES

Zooming out to a weekly chart of the ES as we enter a new quarter and a month. Notice the rejection from the 5580+ area
Guest Post
SpotGamma is one the the shining stars of the options markets. If you have never heard of them or already know of them and have never signed up for their options flow products or the SG Academy, I fully suggest you check them out and add them to your trader’s toolbox.
Here’s a snippet from them:
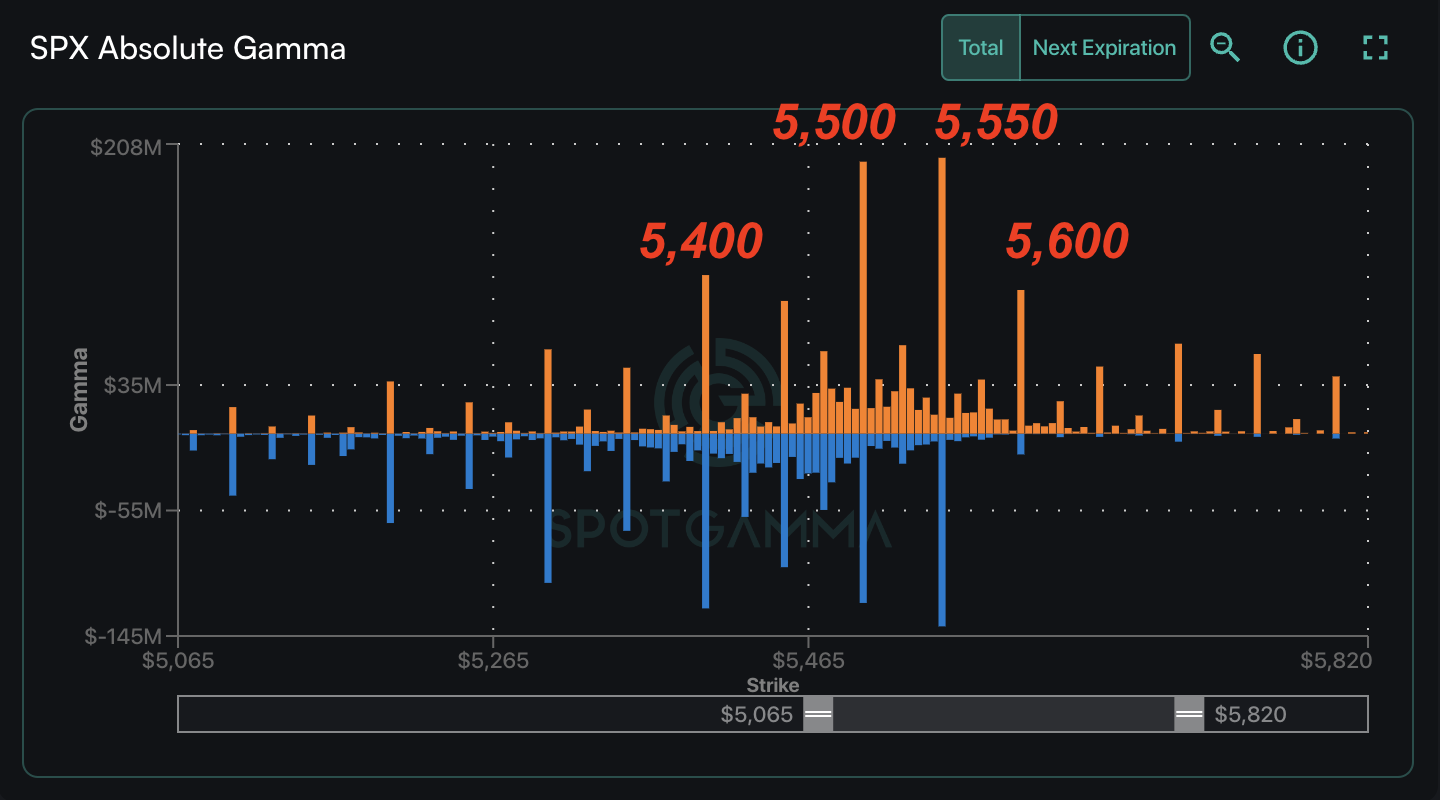
As we look forward, we see the SPX
Call Wall has jumped to 5,600, with the SPY Call Wall remaining at 550 (SPX 5,520). This informs us large positions have built up overhead, as can be seen in the gamma-by-strike plot below. As a result, should the SPX slide up into 5,500 area, dealer flows should be stabilizing due to positive gamma dynamics. We are still in the camp that we test 5,500, and continue higher into July OPEX. This is due to the upcoming holiday week + Powell tomorrow (more on this below).
The interesting counter side to this, is that the downside is deteriorating. You can see this in the chart below, wherein the gamma at 5,450 & 5,400 is relatively lower than at upside strikes. Therefore, should we break <5,450 we may see a quick jump to 5,400 as there is less stabilizing flow (i.e. less positive gamma) to the downsize. “Less stabilizing flow” is different from “destabilizing flow” (i.e. negative gamma), which would mean dealers short into lower equities. We do not see that scenario materially entering unless SPX breaks <5,300.
Economic Calendar
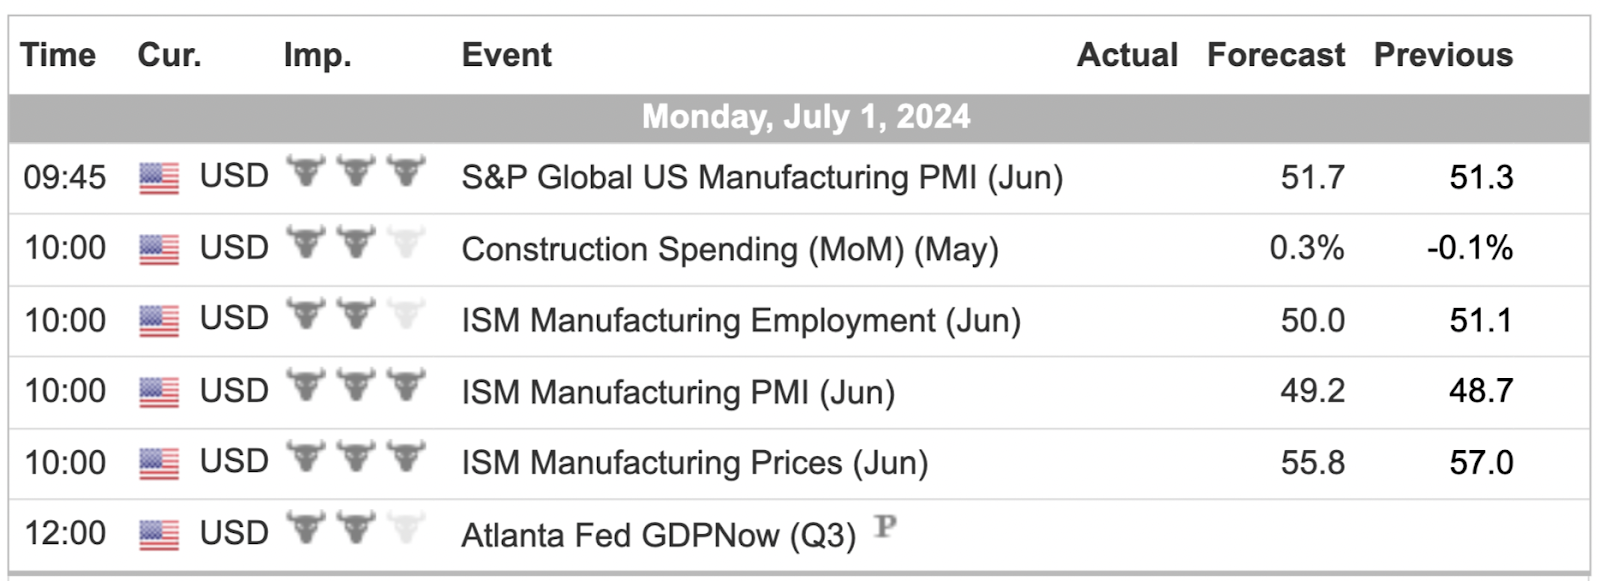
For a more complete Economic Calendar see: https://mrtopstep.com/economic-calendar/
Comments are closed