This post goes out as an email to our subscribers every day and is posted for free here around 2 PM ET. To get your real-time copy, sign up for the free or premium version here: Opening Print Subscribe.
Quad Witching, Santa Rally, and a Market That Refuses to Die
Follow @MrTopStep on Twitter and please share if you find our work valuable!
Our View
I think we all know that these are not our fathers’ markets and charts, nor will they ever be. One thing I can say about Friday’s price action is that it was a great example of how program trading can spin out of control quickly — but the markets will have to drop a lot more to be considered a real FLASH CRASH. What I think is a better name for Friday is a micro-Flash Crash.
Late in the day, after the ES rallied, I had a feeling the decline was stalling. Had they not done that and closed on the lows, I would probably have a different opinion. But in most cases, after big-name stocks get beaten up like Oracle and Broadcom, they end up being buying opportunities.
Will that be the case today? Well, there could be some mid-month rebalancing, and Tuesday is an 85% up day.
Our Lean
One of the things that bothers me is I felt strongly about maintaining a long position three weeks ago when everyone was selling — and I didn’t do it. That is where the money is made, not trying to scalp.
I know from my own trading that when people start talking about December, they think it’s just going up. But the majority of the gains occur in the second half of the month. December is one of the stronger months overall for the index — average return around 1.5% since 1950, positive about 75% of the time — with the key driver of late-December strength being the Santa Claus Rally, defined as the last five trading days of December plus the first two of January. The S&P 500 has averaged +1.3% gains during this 7-day window, positive 79% of the time since 1950, often starting around late December or post-Christmas trading days.
According to Stock Trader’s Almanac:
-
The Monday before the December Quad Witching (Chanukah) has been up 15 of the last 24.
-
The week of the December Quad Witching has been up 29 of the last 40.
-
Friday’s December Quad Witching day has been up 26 of the last 40 occasions.
-
The week after the Quad Witching has the Dow up 26 of the last 33 occasions, with an average gain of +0.80% since 1991.
-
Wednesday, December 24 (shortened trading day), or the last trading day before Christmas, has the Nasdaq up 13 of the last 17.
-
The last trading day of December has the Nasdaq down 18 of the last 24 occasions.
-
And January 2nd, the first trading day of January, has the Nasdaq up 18 of the last 27.
I find it very unlikely the market will go down during these periods. Bottom line: getting bullish too early in December is generally not a wise move.
Our lean: I think we could see a bounce on Globex. What I don’t know is if the ES will just go straight back up. You can sell the early rallies and buy the pullbacks — or just be patient and buy the pullbacks.

Goldman Sachs Asset Management Makes Big Bet On ETFs Specializing In Downside Protection
Goldman Sachs Asset Management is significantly expanding its focus on defined outcome (buffer) ETFs—innovative products that employ options strategies to offer investors downside protection by buffering a portion of losses in exchange for capped upside potential. On December 1, 2025, Goldman Sachs announced its agreement to acquire Innovator Capital Management, a pioneer and leading provider in this category, for approximately $2 billion in cash and stock (subject to performance targets), with Innovator overseeing ~$28 billion in assets across 159 defined outcome ETFs as of September 30, 2025, and the transaction expected to close in the second quarter of 2026 subject to regulatory approvals. This acquisition, driven by surging investor demand for risk-managed equity exposure amid market uncertainty, high valuations, and volatility, complements Goldman’s existing buffered ETFs launched in 2025 (GBXA, GBXB, GBXC), instantly scaling its offerings so that the combined firms manage over 215 ETF strategies and more than $75 billion in assets, positioning Goldman among the top 10 active ETF providers globally. Industry analysis project defined outcome ETF assets could surpass $300 billion (with some estimates up to $334 billion) by 2030, reflecting strong advisor and investor interest in structured protection strategies, underscoring Goldman Sachs’ commitment to leading in high-growth, innovative investment categories within its $3.5 trillion asset management business.
Market Recap
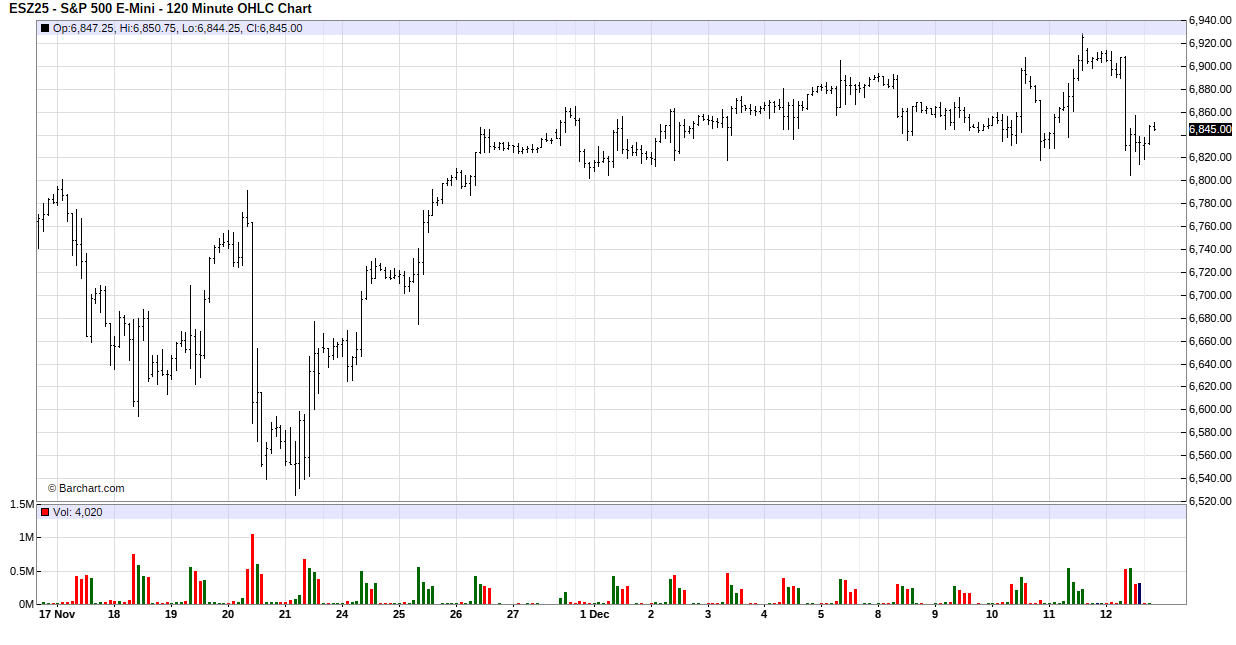
Monthly ES Chart
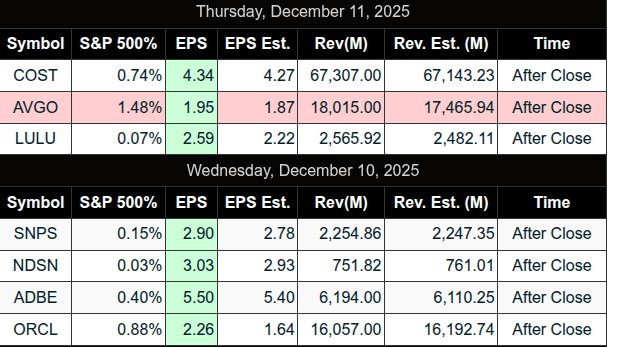
After the close, Oracle’s Q2 fiscal 2026 earnings disappointed investors due to a small revenue miss: $16.1B vs. $16.2B. The miss was driven by declining traditional software sales and negative free cash flow for AI infrastructure, which fueled concerns over rising debt and delayed returns on heavy spending. Shares plunged 11%.
Right after the Oracle earnings report, Broadcom beat estimates with record revenue, but shares dropped 10% amid worries about gross margin pressure from the growing mix of lower-margin AI business, a perceived shortfall in AI backlog growth or new major customers, and slight delays in certain projects.
Despite the earnings news, the ES closed up 43.50 points on Wednesday. On Thursday, the ES traded up to 6928.75, up 15.5 points. Additionally, the NQ closed up 98 points on Wednesday. On Thursday, the NQ traded up to 25,861.50 but lost most of the gains, closing down 85.50 points.
I voiced my concern about the Fed speakers (not as many as I wrote about), but just the same, the weight of the tech and AI weakness pushed the Nasdaq and S&P sharply lower during Friday’s trade.
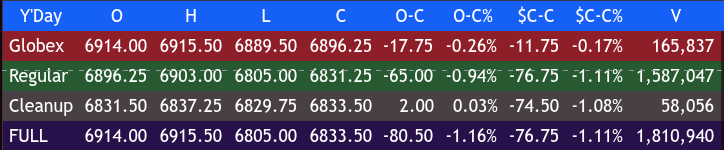
I’m not going to do a blow-by-blow, but here’s a quick recap: the ES made a Globex high at 6915.50 and opened Friday’s regular session at 6896.25, down -11.75 or 0.17%. It traded up to 6903.00 at 9:40 as the NQ poured lower, then sold off down to 6805.00 at 11:35. It made a higher low at 11:40, rallied 38.75 points up to 6843.75 at 12:20, pulled back to 6823.00 at 12:30, then rallied up to 6857.00 at 1:15.
From there, it sold off down to 6825.50 at 2:25, traded up to 6839.00 at 3:10, sold off again down to 6814.50 at 3:35, traded up to 6832.50 at 3:45, and was at 6827.50 as the 3:50 cash imbalance showed $3.1 billion to buy. It then traded up to 6837.25 and flatlined into the 5:00 futures close, settling at 6830.75 — down 76.50 points or 1.11%, the largest drop since November 12, 2025.
The NQ settled at 25,213.50, down 500 points or -1.94%, its worst day since the 590.25 point drop on November 20, 2025.
In the end, the longs got hoodwinked by the AI/tech weakness, as investors dumped growth/tech stocks while rotating into defensive and value areas. Utilities rose +1.8%, Energy +1.5%, and Financials +1.2%. The Dow rose +0.3% on broad participation. The move broadened market leadership, erasing -$200B in AI market cap.
In terms of the ES and NQ’s overall tone, it was like someone flipped the switch. As for the ES’s overall trade, volume was high at 2.45 million contracts traded.
In all honesty, I did not see that coming — but the PitBull warned me about a newsletter he gets that was calling for a FLASH CRASH. I got a little spooked. Did I believe it? Not really, but as the NQ and ES were falling, I started thinking it was possible. Then I started to reflect back to the May 2010 Flash Crash that cost my S&P 500 futures and options desk $9.6 million — and it didn’t really look like that.
Back then, I think the ES was down over 4% by midday and then dropped 6% from 2:30 to 2:45. The YM (Dow Jones future) dropped 600 points in 5 minutes or -9%. That’s when a hedge fund enters an order or gets out of the long-side protection of a 2,000-lot put spread, leaving the trader naked short.
From the low, and over the next 20 to 30 minutes, the market rallied sharply, recovering most of the crash losses within 20 to 30 minutes around 3:05 — regaining approximately 70% of the plunge, or +6% upward from the bottom.
While I believe there have been many ‘little’ FLASH CRASHES over the years, there hasn’t been anything like May 2010. I think it’s nearly impossible to predict the timing of a real flash crash — even if you are Michael Burry.
The Week Ahead
Key Upcoming Events (December 15–19, 2025)
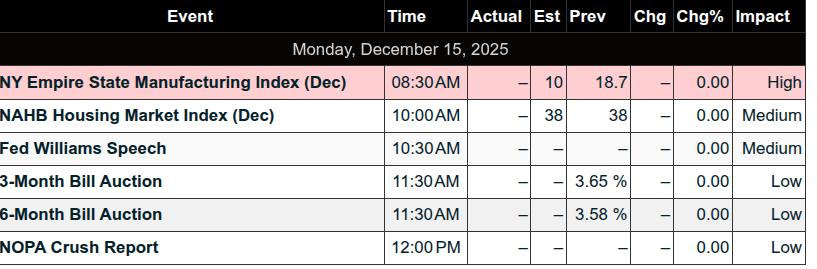
Monday, December 15
-
8:30 AM ET: Empire State Manufacturing Survey (Dec)
– Forecast: 10.0 | Previous: 18.7 -
10:00 AM ET: Home Builders’ Confidence Index (Dec)
– Forecast: 38 | Previous: 38 -
Various Fed speeches (e.g., NY Fed President John Williams)
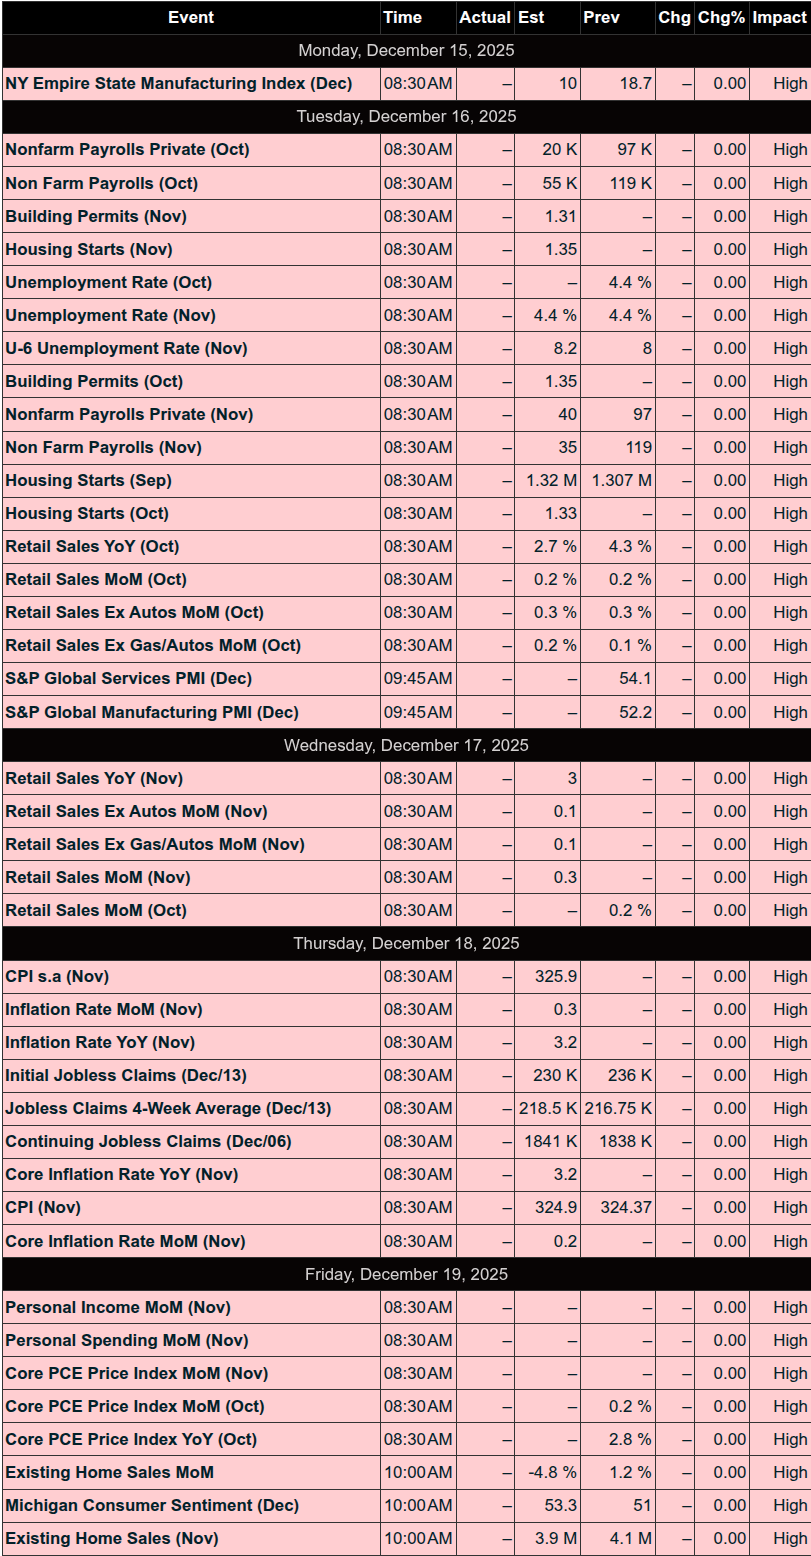
Tuesday, December 16 (High-impact: Delayed labor and retail data)
-
8:30 AM ET: Nonfarm Payrolls (Nov, delayed)
– Forecast: +50,000 | Previous: +119,000 -
8:30 AM ET: Unemployment Rate (Nov)
– Forecast: 4.5% | Previous: 4.4% -
8:30 AM ET: Hourly Earnings MoM (Nov)
– Forecast: +0.3% | Previous: +0.25% -
8:30 AM ET: Retail Sales (Oct, delayed)
– Forecast: +0.1% | Previous: +0.2% -
8:30 AM ET: Retail Sales ex-Autos (Oct)
– Forecast: +0.2% | Previous: +0.3% -
9:45 AM ET: S&P Global Services & Manufacturing PMI Flash (Dec)
Wednesday, December 17
-
Mostly Fed speeches
(e.g., Chris Waller, John Williams, Raphael Bostic)
Thursday, December 18 (High-impact: Inflation data)
-
8:30 AM ET: Initial Jobless Claims (week ending Dec 13)
– Forecast: 223K | Previous: 236K -
8:30 AM ET: CPI YoY (Nov)
– Forecast: 3.1% | Previous: 3.0% -
8:30 AM ET: Core CPI YoY (Nov)
– Forecast: 3.0% | Previous: 3.0% -
8:30 AM ET: Philadelphia Fed Manufacturing Survey (Dec)
– Forecast: 3.6 | Previous: -1.7
Friday, December 19
-
10:00 AM ET: Existing Home Sales (Nov)
– Forecast: 4.1M | Previous: 4.1M -
10:00 AM ET: Consumer Sentiment (Final, Dec)
– Forecast: 53.8 | Previous: 53.3
MiM
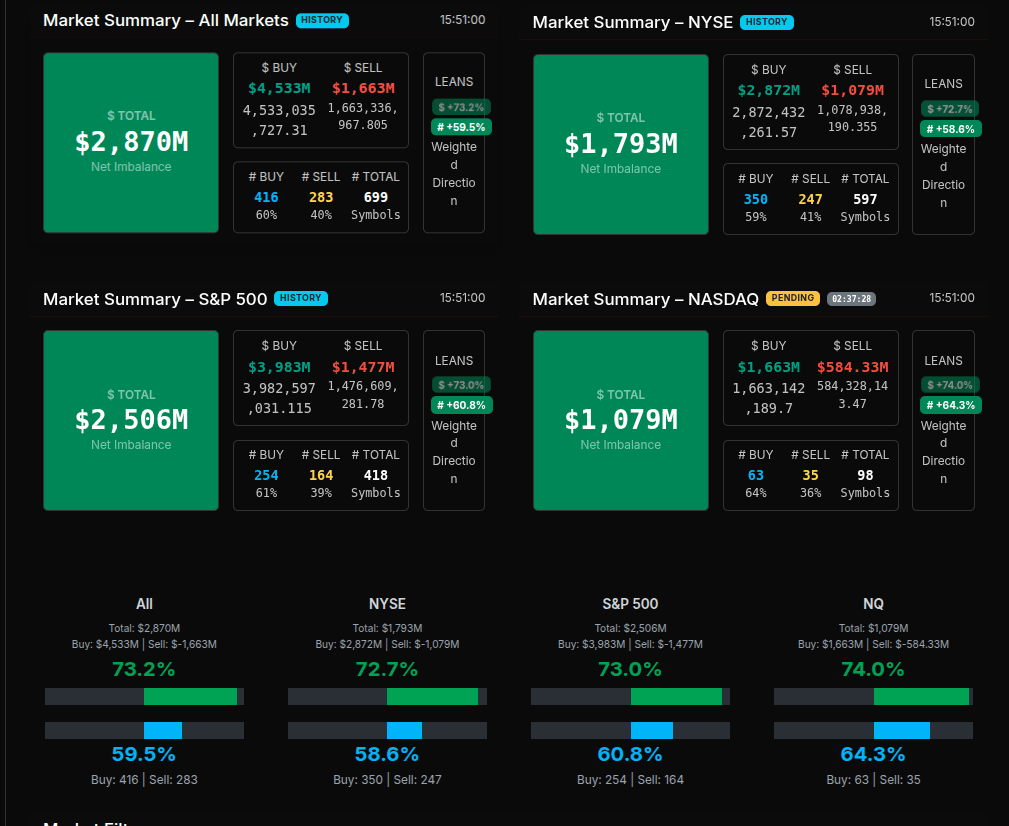
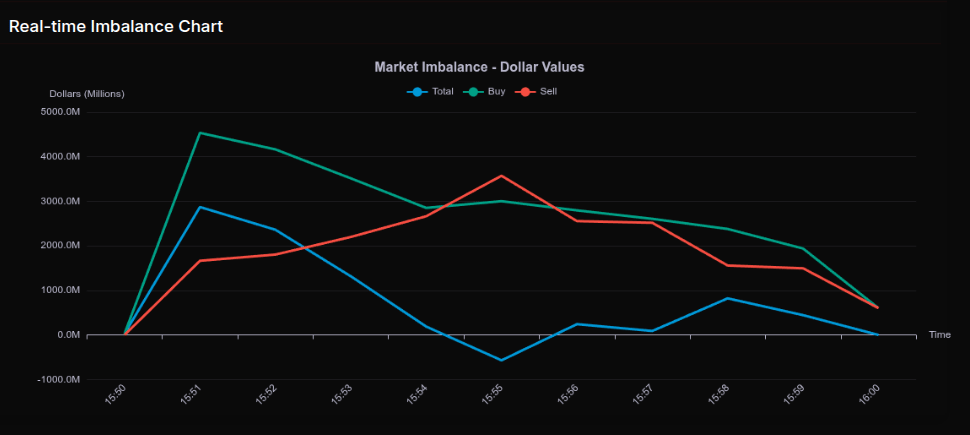
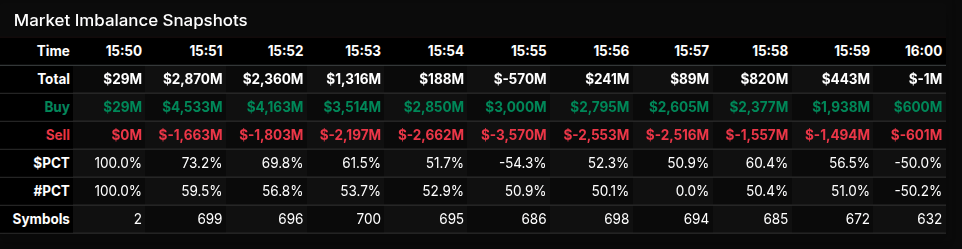
The Market-on-Close auction opened with a decisive buy-side tone that quickly established control across the tape, particularly once the clock rolled past 15:51. Early prints showed a sharp expansion in buy dollars, peaking near $4.5B against $1.6B in sell interest, producing a net imbalance of roughly $2.9B. While total imbalance fluctuated through the final ten minutes, the underlying story was persistent demand rather than a one-off spike, with buyers repeatedly reasserting control after brief pauses.
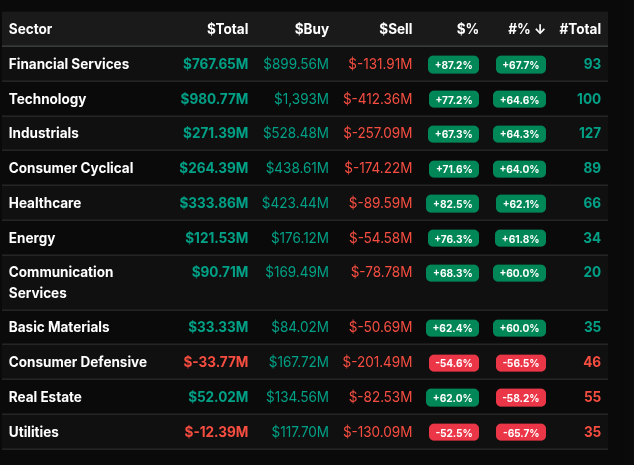
From a sector perspective, the flow was clearly growth- and risk-oriented. Technology led both in dollars and participation, posting nearly $981M in total imbalance with buy-side dominance above 77%, a level consistent with wholesale accumulation rather than simple rotation. Financial Services followed closely, with an 87% buy skew and strong symbol breadth, signaling institutional allocation rather than narrow stock-specific demand. Industrials and Consumer Cyclical also showed buy leans north of 67%, reinforcing the idea of broad-based risk engagement rather than defensive positioning.
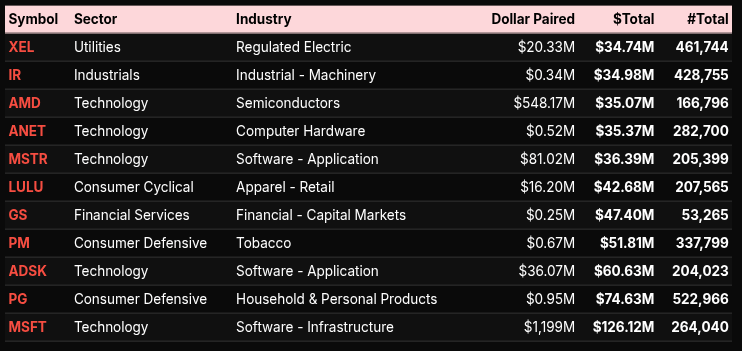
Healthcare and Energy added confirmation, each maintaining buy-side percentages in the mid-to-high 70s. In contrast, Consumer Defensive and Utilities stood out on the sell side, both registering negative total imbalances and sell leans beyond -50%, marking them as clear funding sources for the broader risk bid. Real Estate also remained pressured, failing to attract meaningful late-day sponsorship.
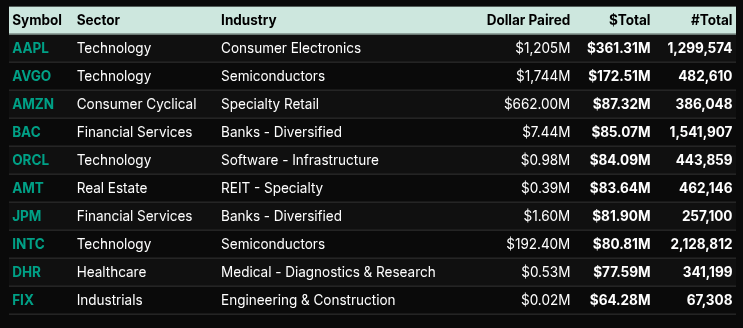
At the symbol level, mega-cap technology dominated the auction. AAPL, MSFT, AVGO, and ORCL absorbed substantial dollar flows, with AAPL alone accounting for over $360M in paired dollars. Financials such as BAC and JPM reinforced the sector-level signal, while selective industrial and healthcare names rounded out the buy list. Notably, many of these symbols exhibited leans well above 66%, underscoring institutional-style buying rather than rotational churn.
Into the close, the imbalance oscillated but never fully collapsed, finishing near flat only after significant absorption. The MOC ultimately reflected a market willing to press exposure into the bell, favoring growth and cyclicality while continuing to shed defensive ballast.
Technical Edge
Fair Values for December 15, 2025: (H Contracts – 2026)
-
SP: 63.14
-
NQ: 265.52
-
Dow: 402.17
Daily Breadth Data 📊
For Friday, December 12, 2025
-
NYSE Breadth: 39% Upside Volume
-
Nasdaq Breadth: 32% Upside Volume
-
Total Breadth: 33% Upside Volume
-
NYSE Advance/Decline: 33% Advance
-
Nasdaq Advance/Decline: 31% Advance
-
Total Advance/Decline: 32% Advance
-
NYSE New Highs/New Lows: 166 / 21
-
Nasdaq New Highs/New Lows: 234 / 144
-
NYSE TRIN: 0.85
-
Nasdaq TRIN: 0.92
Weekly Breadth Data 📈
For Week Ending December 12, 2025
-
NYSE Breadth: 53% Upside Volume
-
Nasdaq Breadth: 52% Upside Volume
-
Total Breadth: 52% Upside Volume
-
NYSE Advance/Decline: 56% Advance
-
Nasdaq Advance/Decline: 49% Advance
-
Total Advance/Decline: 52% Advance
-
NYSE New Highs/New Lows: 344 / 76
-
Nasdaq New Highs/New Lows: 616 / 306
-
NYSE TRIN: 1.05
-
Nasdaq TRIN: 0.89
Today’s BTS Levels: (Tomorrow we will switch to H26 contracts)
ES Z
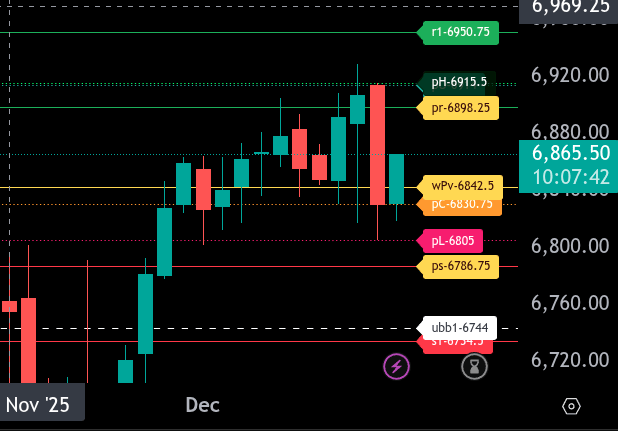
The bull/bear line for the ES is at 6842.50. This remains the key pivot for today. Holding above this level keeps the near-term tone constructive, while acceptance back below would shift control back to sellers.
ES is currently trading near 6865.25, above the bull/bear line, suggesting buyers still have control in the early Globex session. As long as price holds above 6842.50, look for rotation higher rather than aggressive downside continuation.
The upper range target for today is 6898.25. Initial resistance past the upper range target exists at 6915.50, followed by a larger upside extension toward 6950.75. A sustained push through 6898.25 would open the door to testing these higher resistance levels.
On the downside, first support is the bull/bear line at 6842.50, followed by 6830.75. The lower range target sits at 6786.75. A failure to hold 6842.50 increases the odds of a deeper test into 6805.00 and potentially the lower range target.
Overall, bias remains balanced-to-bullish above 6842.50. A clean break and hold below that level would shift focus toward the lower range targets, while strength above 6898.25 keeps upside continuation in play.
NQ Z

The bull/bear line for the NQ is at 25,298.25. This is the key pivot for intraday bias and will determine whether buyers or sellers maintain control.
NQ is currently trading near 25,350.50, holding above the bull/bear line, which keeps the near-term tone constructive. As long as price remains above 25,298.25, buyers can work for continuation toward higher resistance levels.
On the upside, resistance comes in at 25,572.25, followed by 25,701.00 and the prior high at 25,733.25. A sustained push through these levels opens the door toward 25,830.25 as the next upside objective.
On the downside, initial support is at 25,213.50, with stronger support below at 25,118.00. A failure back below the bull/bear line would shift focus to 25,057.50 and then 25,024.50 as the lower range target for today. A break of that zone risks extension toward 24,766.50.
Overall, NQ remains bullish above 25,298.25. Acceptance back below that level would negate the upside structure and favor rotation toward the lower targets.
Calendars
Today’s Economic Calendar
This Week’s Important Economic Events
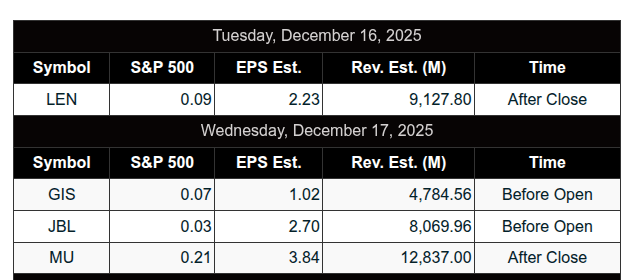
Upcoming Earnings
Recent Earnings
Room Summaries:
Polaris Trading Group Summary – Friday, December 12, 2025
It was a textbook Capital Preservation “FRYday”, with PTGDavid guiding the team through a well-structured, disciplined session. The day delivered a classic Cycle Day 1 (CD1) decline, hitting multiple downside targets highlighted in the Daily Trade Strategy (DTS) Briefing, and finishing with an impressive reversal that offered lessons in patience, alignment, and market rhythm.
Key Market Action & Trade Highlights:
-
Morning Alignment: Short Bias Confirmed Early
-
Price action began below the 6910 “Line in the Sand”, fulfilling the initial downside target at 6890–6885, confirming early short bias.
-
PTGDavid stressed that FRYday is statistically unforgiving, reinforcing tight stops and low risk—a valuable lesson in discipline for all traders.
-
-
Downside Targets Hit in Sequence
-
Market sold off through 6865–6860 structural support, then moved to the 6840 projected range low.
-
The Volume Trigger at 6850 offered a brief buy response, but the downside resumed, heading to 6817–6814, and even approached the 6802.50 D-level—a level several traders, including Bruce F and slatitude39, had marked.
-
-
Afternoon Reversal – “Smash ‘em in the Morning, Buy ‘em in the Afternoon”
-
A classic reversal kicked off near midday as bulls launched a “Noon Balloon” from the Money Box lower edge (MB(2)).
-
Price rallied back toward 6824, which David marked as the line in the sand for bulls to defend.
-
Though David mentioned missing a good entry at 6824, the bias flipped Long in the afternoon, reinforcing the “Ready… Aim… Fire” mindset for late-day trades.
-
-
2 PM “Shake & Bake” & Closing Rotation
-
At 2 PM, price action rolled back down again, staying aligned with CD1’s broader structure.
-
A reported $3.1B MOC buy imbalance was absorbed with ease, leading David to call it “trickery” and Bruce to quip: “The market said ‘Is that all you got?’”
-
PTGDavid confirmed the Picture Perfect CD1 structure—lower targets fulfilled, reinforcing the strength of the DTS Briefing roadmap.
-
Lessons & Highlights:
-
“The Prime Directive” of Capital Preservation was repeated multiple times—this was a day to survive, not force trades.
-
DTS Briefing alignment paid off, especially for those who followed downside levels and respected the bearish alignment early.
-
Adaptability: When structure shifted midday, the team was reminded to stay nimble—“Smash ‘em in the morning… Buy ‘em back in the afternoon.”
-
Participation & Insights: Manny provided a robust trade plan; the group shared insights on levels like 6802.50, and PeterN observed ATR stacker alignment—fostering a collaborative learning environment.
Looking Ahead:
-
Contract Roll to March (H26) happens Monday, so all traders are reminded to update their charts.
-
Winter weather expected in the Northeast—another reminder that preparation is key, in trading and in life.
DTG Room Preview – Monday, December 15, 2025
Macro & Fed Outlook:
-
Markets bullish post-Fed rate cut and Powell’s dovish press conference.
-
Powell likely to be replaced in May by a Trump-appointed dove.
-
Fed raised 2026 GDP forecast to 2.3% — bullish for revenue, margins, and earnings.
-
Delayed employment and inflation data due this week; December jobs report to follow in early January.
-
These releases will guide expectations for further Fed moves in 2026.
Corporate & Sector Highlights:
-
CEOs view the rate-cutting cycle as a multi-year growth window.
-
Global M&A rose 40% in 2025 to $4.5T — 2nd highest on record.
-
Positive readthrough for Big Banks.
-
-
Analysts raising 2026 price targets across the board:
-
Tailwinds: corporate tax cuts, AI boom, sector broadening.
-
-
Mag 7 = 25% of S&P 500 earnings; participation widening.
-
Goldman Sachs sees faster earnings growth in the S&P 493.
-
Sector standouts: transportation, homebuilders, healthcare, energy.
Company Spotlight:
-
Alphabet (GOOG, GOOGL) set for a major paper gain:
-
SpaceX tender may value company at ~$800B.
-
Alphabet’s 2015 $1B investment (~10%) now implies huge unrealized gains.
-
April filing showed $8B in non-marketable equity gains — likely SpaceX.
-
Today’s Calendar:
-
Economic Data:
-
Empire State Manufacturing (8:30am ET)
-
NAHB Housing Market Index (10:00am ET)
-
-
Fed Speakers:
-
Gov. Stephen Miran (9:30am & 11:00am ET)
-
NY Fed’s John Williams (10:30am ET)
-
-
No notable earnings today
Markets & Levels:
-
Volatility climbing — ES 5-day ADR: 77.5 points
-
No whale bias: overnight large trader volume light.
-
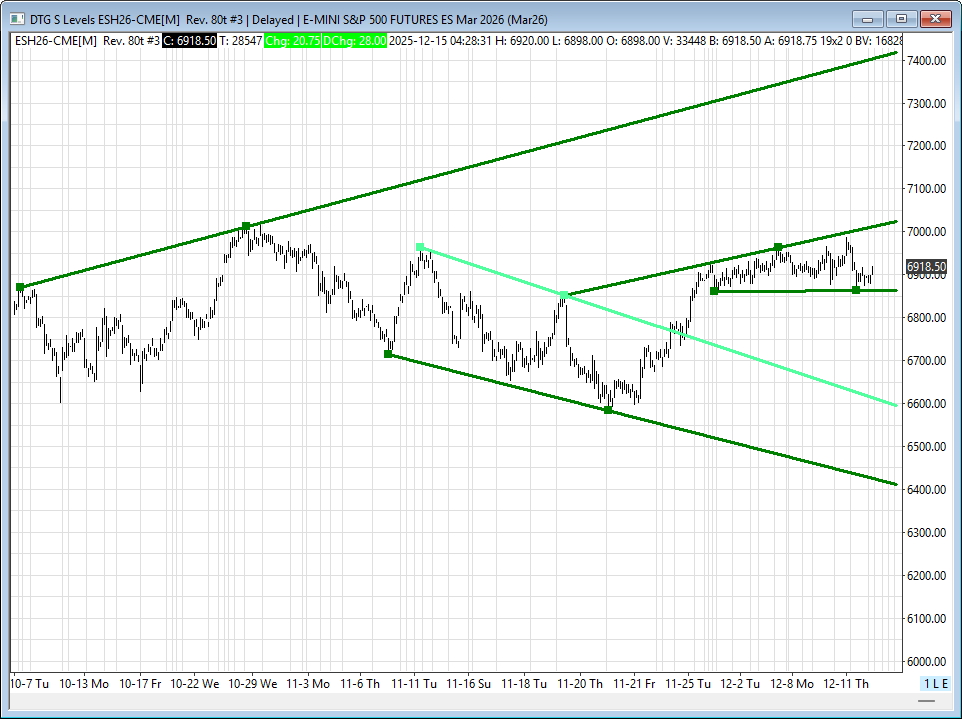
New ES contract in short-term flag-like channel:
-
Resistance: 7017/25s, 7415/20s
-
Support: 6861/64s, 6850.25 (50-day MA), 6407/02s
-
Tone: Constructive heading into 2026 if incoming data supports Fed pause.

Affiliate Disclosure: This newsletter may contain affiliate links, which means we may earn a commission if you click through and make a purchase. This comes at no additional cost to you and helps us continue providing valuable content. We only recommend products or services we genuinely believe in. Thank you for your support!
Disclaimer: Charts and analysis are for discussion and education purposes only. I am not a financial advisor, do not give financial advice and am not recommending the buying or selling of any security.
Remember: Not all setups will trigger. Not all setups will be profitable. Not all setups should be taken. These are simply the setups that I have put together for years on my own and what I watch as part of my own “game plan” coming into each day. Good luck!
This post goes out as an email to our subscribers every day and is posted for free here around 2 PM ET. To get your real-time copy, sign up for the free or premium version here: Opening Print Subscribe.
Comments are closed