Quarter-End Rotation Is in Focus
NVDA has played a big role lately
Follow @MrTopStep on Twitter and please share if you find our work valuable!
Every week, MrTopStep invites traders to an “Own the Close” contest where the closest guesstimate where the SPX will settle on Friday’s 4:00 cash close.
The winners get a free week’s access to the MrTopStep Chat and trading tools. Enter your guess now!
Our View
Ever since the ES made its 5588.00 all-time high on June 20, it’s been one failed rally after another.
I said yesterday that I do not think it’s a good idea to buy into the rallies. I think the answer is simple and it’s called the June quarter-end. So I went back and looked at what the net of all the recent 3:50 cash imbalances were and 9 out of 16 days were for sale for a total of $20.85 billion and 7 days were to buy for a total of $7.93 billion – for a net of $12.92 billion to sell.
It looked that way for the past week or so, as we fell into this funky price action where the ES is doing the exact opposite of the NQ or YM or RTY – it’s all part of the non-stop ETF/stock sector rotations for the end-of-the-quarter rebalance.
As you can see by the imbalance data, someone has been selling. According to Dow Jones Market Data, the Nasdaq and Dow have moved in different directions in eight out of the past 10 trading days, something that hasn’t happened since a 10-day stretch ending in April 1995. It’s a big stat that shows massive amounts of money moving in and out.
But maybe it’s about the rebalance story.
Our Lean
The buyers keep showing up on the dips and the stats are modestly bullish. The big question is what happens at the end-of-the-quarter rebalance? I’m not sure about that, but when you take a wider view of the ES it looks like it’s in a big back-and-fill pattern.
Should the ES gap lower today, I’m buying the open or the first drop under the gap down. If the ES gaps higher, I can’t rule out selling the early rallies – but that trade would be to look to cover and find a place to get long again…any 20 to 30 point dip should do it.
There could be some risk-off as we get close to the PCE number also. Sounds bad? Not really just looking for rips that don’t fail.
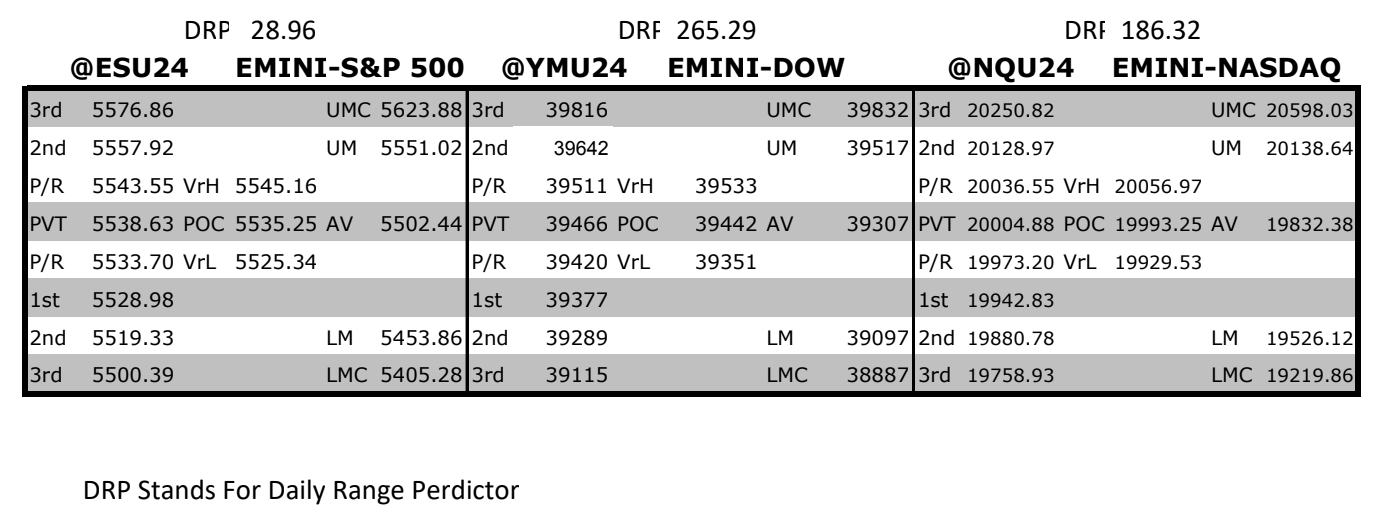
MrTopStep Levels:
MiM and Daily Recap
ES Recap
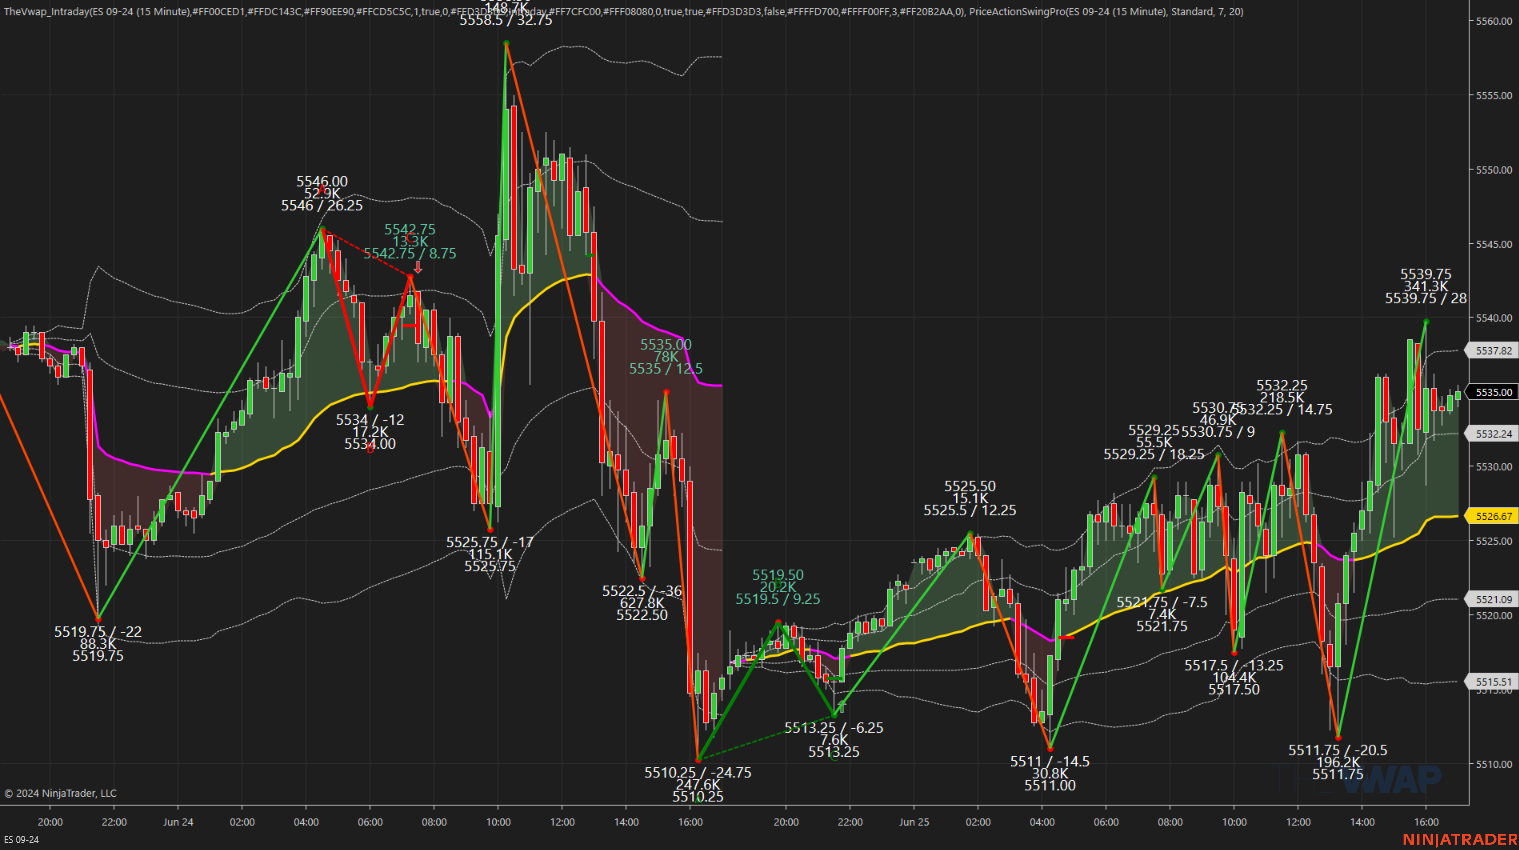
The ES traded down to 5511.00 on Globex and opened Tuesday’s regular session at 5527.25. After the open, the ES sold off down to 5521.25, rallied up to 5528.25 and then sold off down to a new low at 5517.50 at 10:00. From there, it rallied up to a 5529.00 double top, sold off down to 5523.50 at 10:20, rallied up to 5530.25 at 10:34 and sold back down to 5521.50 at 10:56. The ES then rallied up to 5526.00, sold off down to 5522.50 at 11:10, rallied up to 5532.25 at 11:20, sold off down to 5525.25 at 11:28 and rallied up to a lower high at 5531.75 at 11:56.
From there, the ES dumped down to a new session low at 5511.75 at 1:05 and rallied up to 5536.25 after the auction got a B+ rating at 1:16. After the high, the ES sold off down to 5225.25 at 2:50, chopped its way up to 5538.50 at 3:30 and then pulled back to 5530.75 at 3:44. The ES traded 5531.25 as the 3:50 cash imbalance showed $2.2 billion to sell, traded 5528.75 and then rallied up to 5539.75 and traded 5535.25 on the 4:00 cash close. After 4:00, the ES sold off down to 5531.75 and traded 5535.00, up 19.25 points or +0.35%, the NQ settled 19,970.50 up 216.50 points or +1.10%, the yield on the 10-year note fell to 4.237% from 4.248% on Monday. Gold fell 13.30 to 2,331.10, Bitcion closed up 4.93% at 62,525 and Brent crude futures lost 1.2% to $85.01 a barrel, the biggest one-day decline since early June.
In the end, NVDA pushed the index S&P down on Monday and up on Tuesday. In terms of the ES’s overall tone, both the ES and NQ were firm. In terms of the ES’s overall trade, volume was super low at 1.075 million contracts traded.
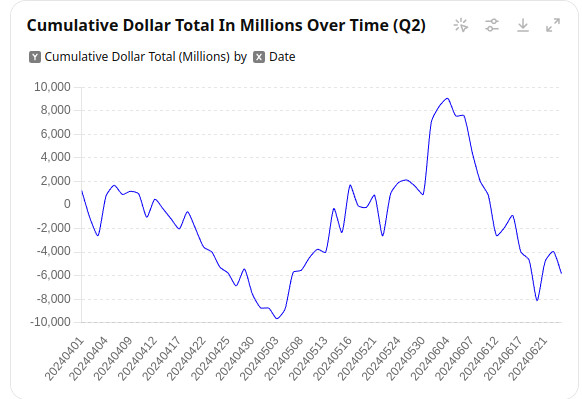
Q2 Net MIM flows
Guest Post — Polaris Trading
Daily Trade Strategy
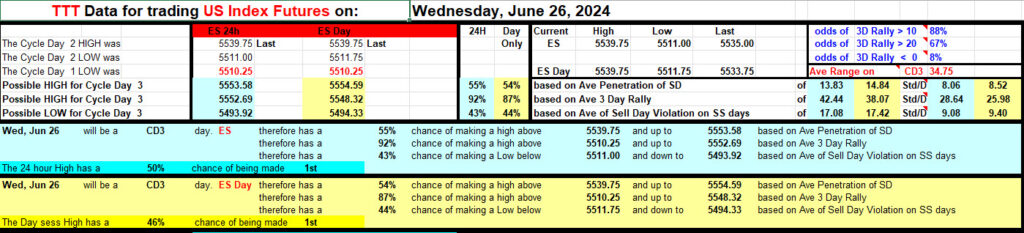
Prior Session was Cycle Day 2: Market successfully retested the CD1 Low (5510.25) during the RTH starting this cycle’s rally. Range for ES was 28 handles on 1.072M contracts exchanged.
…Transition from Cycle Day 2 to Cycle Day 3
This leads us into Cycle Day 3: There remains plenty of room for this cycle’s rally to continue, targeting 5552 handle. We’ll be monitoring for a conversion above 5540 level with a sustained bid for this session. Weakness below 5520 places this cycle’s rally in jeopardy of completing. You Know The Plan! Our discipline of maintaining positioning that is aligned with market forces continues to serve us well, so stay the course.
As such, scenarios to consider for today’s trading.
Bull Scenario: Price sustains a bid above 5540, initially targets 5550 – 5555 zone.
Bear Scenario: Price sustains an offer below 5540, initially targets 5525 – 5520 zone.
PVA High Edge = 5533 PVA Low Edge = 5522 Prior POC = 5526
*****The 3 Day Cycle has a 92.50% probability of fulfilling Positive Cycle Statistics covering 12 years of recorded tracking history.
Thanks for reading,
PTGDavid
Economic Calendar
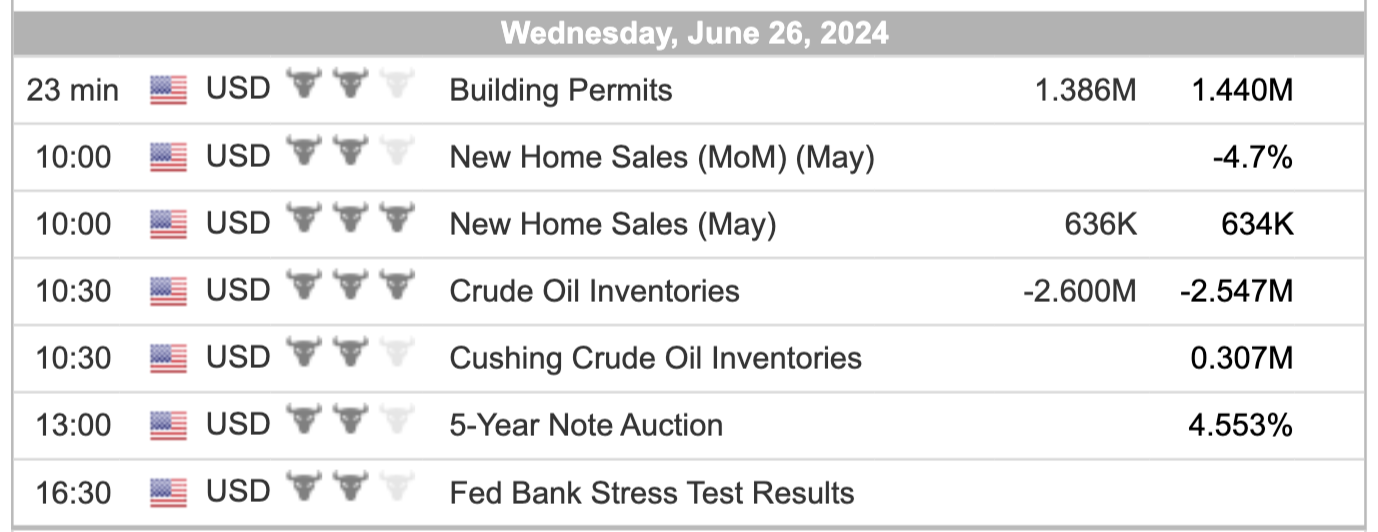
For a more complete Economic Calendar see: https://mrtopstep.com/economic-calendar/
Comments are closed