This post goes out as an email to our subscribers every day and is posted for free here around 2 PM ET. To get your real-time copy, sign up for the free or premium version here: Opening Print Subscribe.
Sell the Rip, Spin the Wheel — February’s Final Bell Could Get Wild
Follow @MrTopStep on Twitter and please share if you find our work valuable!
Our View
@HandelStats said that even if the ES sold off on Thursday, there was a good chance the ES would be up today. Rich and I are close friends, but he is what I call an eternal bull.
After such a big rip on Wednesday, it really felt like Thursday was a sell-the-earnings-news type trade. Right from the get-go, the NQ poured lower. As I said in yesterday’s lean, expect the unexpected.
Today could be another banger: PPI at 8:30, Chicago Business Barometer (PMI) at 9:45, and construction spending at 10:00. It’s the last trading day of February, the week 4 options expiration, and the end-of-the-month rebalance.
Yesterday’s rotation was selling the NQ and ES and buying YM and RTY. It’s very much like musical chairs—if you don’t move fast, you lose your seat. We could see more of the same today: buying small caps like Russell 2000 components amid the ongoing “Great Rotation” from mega-cap tech to value/small caps and selling laggards.
Our Lean
Yesterday’s price action was not great, nor was the early Globex session. When I researched the last trading day of February (despite @HandelStats), research says today is supposed to be weak.
I know this may sound like gibberish, but the PitBull knows a former Israeli officer who has family who lives in Israel and said that the attack on Iran is going to start Monday. Ask me what I think? I don’t know…
AP reported Iran and the United States held hours of indirect negotiations Thursday over Tehran’s nuclear program but walked away without a deal, while the BBC reported that US and Iranian officials have made “significant progress” in high-stakes nuclear talks in Geneva, the Omani foreign minister has said, but the chances of a deal that could avert a war remain unclear.
What I do think is this is a very fluid situation. I am going to leave it at that…
Ai Support / Resistance Map (High → Low)
🔴 6,975.29 – 6,970.25
Upper Excess | Fade 74% / Break 26% | VWAP +2σ
🔴 6,959.50 – 6,931.65
Upper HVN | Fade 62% / Break 38% | VWAP +0.5σ to +1σ
🟠 6,920.50 – 6,919.78
Primary Pivot / POC | Fade 58% / Break 42% | VWAP Mean
🟡 6,906.96 – 6,897.25
Micro Balance | Fade 55% / Break 45% | VWAP Mean
🟢 6,882.50 – 6,880.90
VAL Support | Fade 66% / Break 34% | VWAP −0.75σ
🟡 6,872.64 – 6,862.85
LVN Pocket | Fade 40% / Break 60% | VWAP −1σ
🟢 6,852.28 – 6,829.50
Composite Support | Fade 64% / Break 36% | VWAP −1σ to −1.5σ
🔵 6,820.50 – 6,803.50
Structural Shelf | Fade 68% / Break 32% | VWAP −1.5σ
🔵 6,770.25
Composite Tail | Fade 72% / Break 28% | VWAP −2σ

Guest Posts:

Get instant access to our partners’ real-time market data and insights not available anywhere else. Here is last night’s Founder’s note getting you ready for today’s market and explaining the constraints in yesterday’s market. – MrTopStep
Founder’s Note:
Futures are off 50 bps with PPI at 8:30 AM ET.
Post earnings:
-
INTU: -3.4%
-
ZS: -9.6%
-
CRWV: -11%
There were very high +80 IV Ranks for INTU & ZS, CRWV was much more normal at 50 IV Rank. Software via IGV -1% premarket.
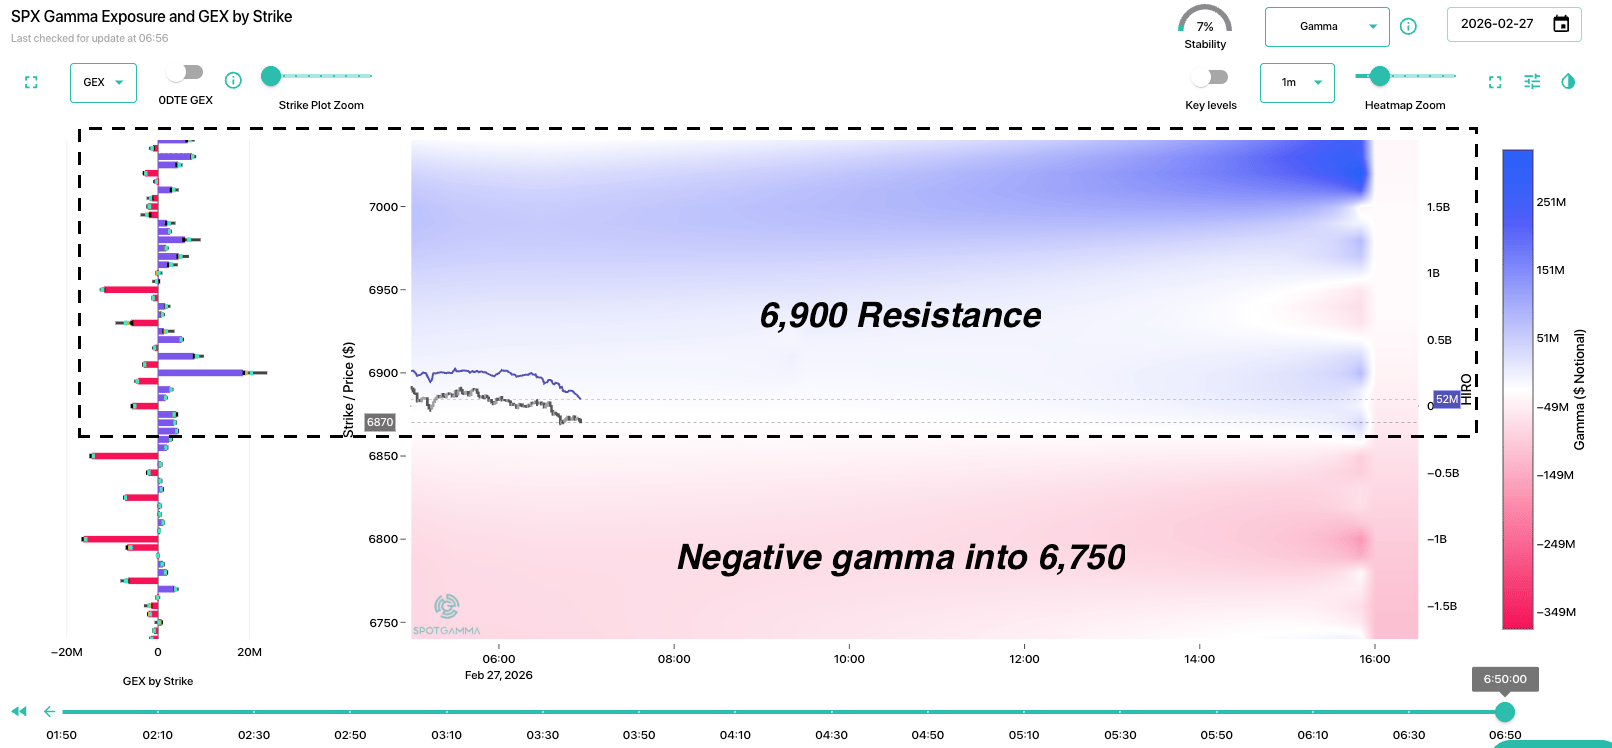
The gamma map for today is unchanged from that of recent weeks: positive gamma resistance >6,900, and negative gamma <6,900 into the 6,700s.
With PPI on deck, we are seeing a very mild bid for short dated puts, and call skew is offered. Selling calls into The 0DTE straddle is cheap at $45.5/66bps (ref 6,885). Why is 66bps cheap? Check the vol we’ve been seeing: 5-day & 1-month RV is 12% = 75bps daily moves.
The takeaway here is that while the SPX cannot seem to stage a rally, there remains no real fear about a broader selloff. Our Risk Pivot remains at 6,900 – but we will likely look to play a tradable bounce if the SPX revisits the 6,850 area. If the SPX does manage to break <6,800, we would be looking to add to downside plays, with short term 0DTE negative gamma into 6,750, but longer dated negative gamma building into the 6,600s.
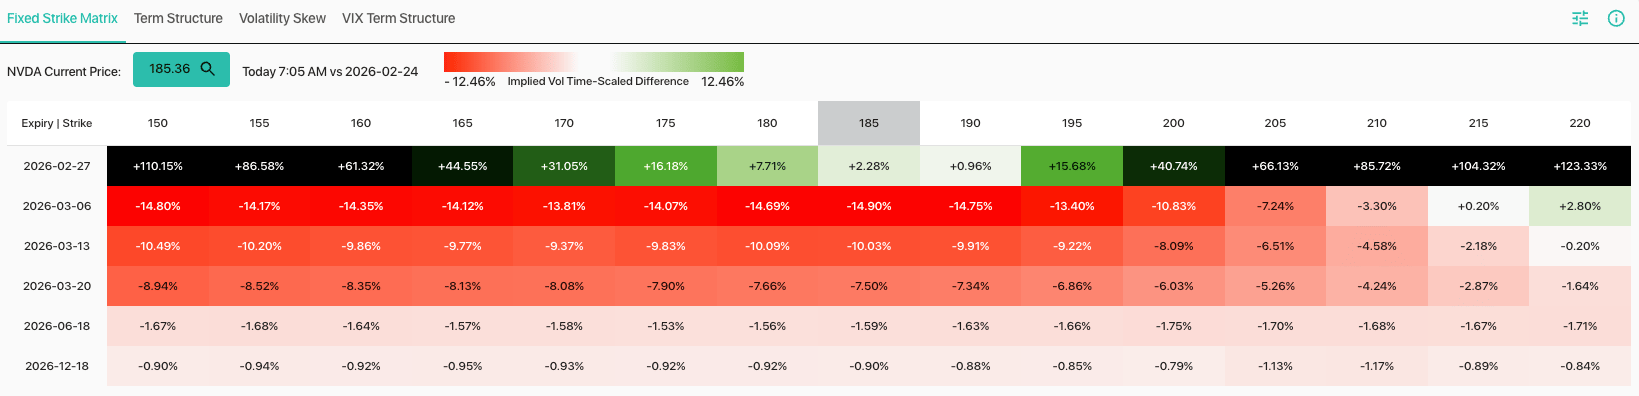
There was a lot of reaction to NVDA’s earnings, as AI and related sentiment seems quite dour. Its an interesting extreme because new and amazing tools are launched each day. On this topic, NVDA saw a very strong post-earnings IV crush despite the fact that the stock was down 15%. Here is the day/day change in fixed strike IV, and as you can see vols dropped 7 – 20 vol points across the next several expirations.
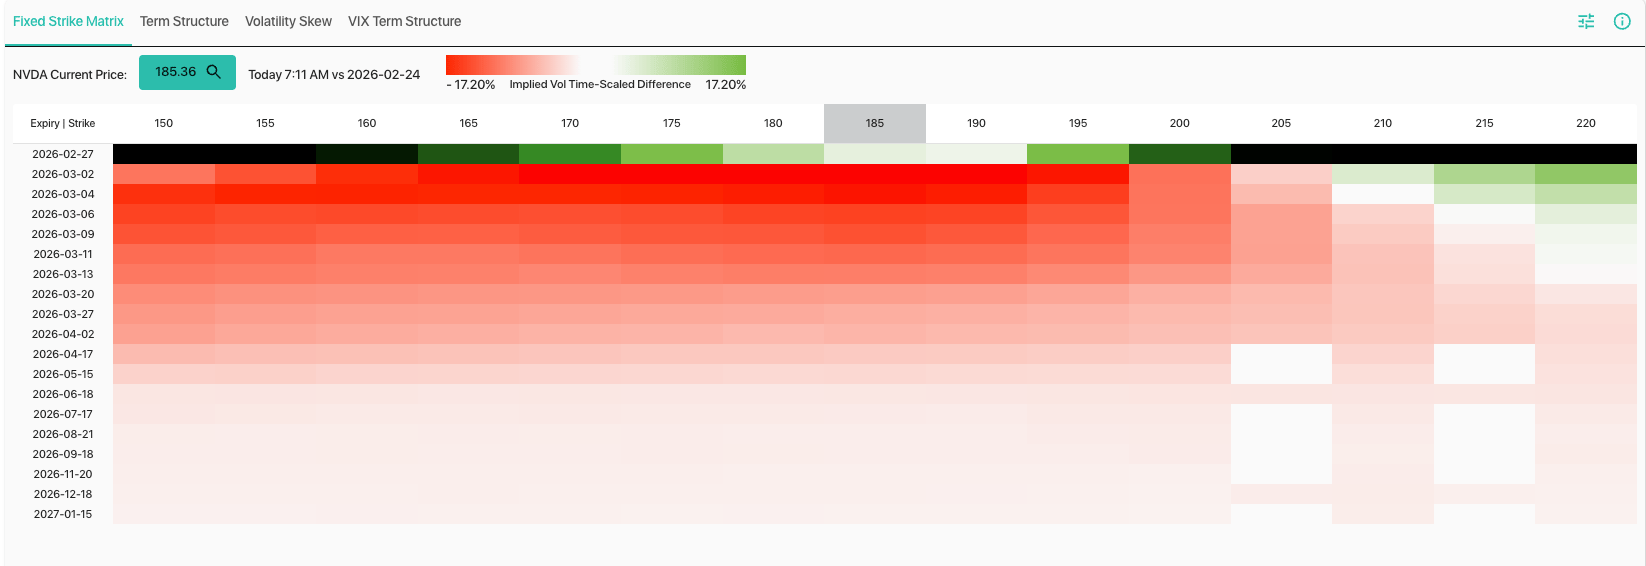
If you zoom way you to see more strikes, you see the put skew was hit the most, as shown by the left side of the map showing the brightest red. If traders think that NVDA has committed massive fraud (lol, just peruse X on the topic) and/or has reached its zenith – well that isn’t being reflected in put prices. The takeaway here is that this looks like pretty standard post-expiration stuff, in a name that exhibits a lot of positive gamma.
©2026 TenTen Capital LLC DBA SpotGamma
All TenTen Capital LLC DBA SpotGamma materials, information, and presentations are for educational purposes only and should not be considered specific investment advice nor recommendations. Futures, foreign currency and options trading contains substantial risk and is not for every investor. An investor could potentially lose all or more than the initial investment. Risk capital is money that can be lost without jeopardizing one’s financial security or lifestyle. Only risk capital should be used for trading and only those with sufficient risk capital should consider trading. Past performance is not necessarily indicative of future results. VIEW FULL RISK DISCLOSURE https://spotgamma.com/model-faq/disclaimer/
Market Recap
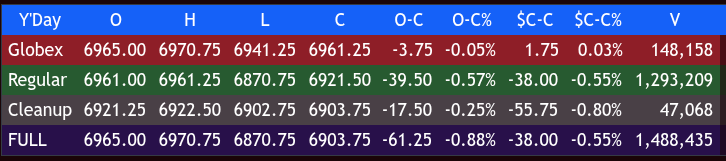
The ES traded down to 6941.00 and hit a high of 6970.75 with 263k contracts traded on Globex. Thursday’s regular session opened at 6961.00, down 3.5 points (-0.05%).
Following the open, the ES sold off 92.75 points to 6870.75 by 10:30 AM—a 117.25-point drop from the NVDA earnings high of 6988.00. The market then saw the following price action:
-
11:25 AM: Rallied to 6918.75
-
12:30 PM: Reached 6898.50
-
1:05 PM: Sold off to 6874.50
-
3:05 PM: Rallied to 6926.25
-
3:25 PM: Sold off to 6914.00
-
3:35 PM: Traded up to 6923.25
-
3:50 PM: Traded 6919.25 as the cash imbalance showed $1.2 billion to buy
-
4:00 PM: Traded 6921.50 at the cash close
After 4:00 PM, the ES sold off to 6902.75 and settled at 6920.00, down 39.75 points (-0.57%). Other settlements included the NQ at 25081.00 (-1.19%), the YM at 49531 (-0.01%), and the RTY at 2680.60 (+0.48%).
In the end, the downturn in the ES and NQ was primarily driven by Nvidia. After hitting a high of $197.63 (+2.71%) on record earnings, NVDA sold off to $184.32, closing down 5.46%. This was fueled by anxieties regarding China revenue risks and the sustainability of AI demand.
This pressure extended to the broader semiconductor sector, specifically impacting companies like Broadcom. While the Nasdaq and S&P 500 fell, the Dow remained stable, and the Russell closed up as investors rotated out of tech megacaps.
Regarding the overall market tone, when the crowd gets too long, the market goes down, and when it gets too short, it goes up. This is very similar to my experience with the UBS program business; while the first few programs would execute smoothly, the “pipe” eventually got clogged by the later rounds.
Total volume for the ES was higher yesterday, with 1.584 million contracts traded.
I can’t do a big OP today. I just got back from Mar-a-Lago for the PitBulls son’s wedding, and it’s 10:40 PM, and I am beat. Like Trump or not, it’s an absolutely beautiful place.
MiM
Market-On-Close Recap
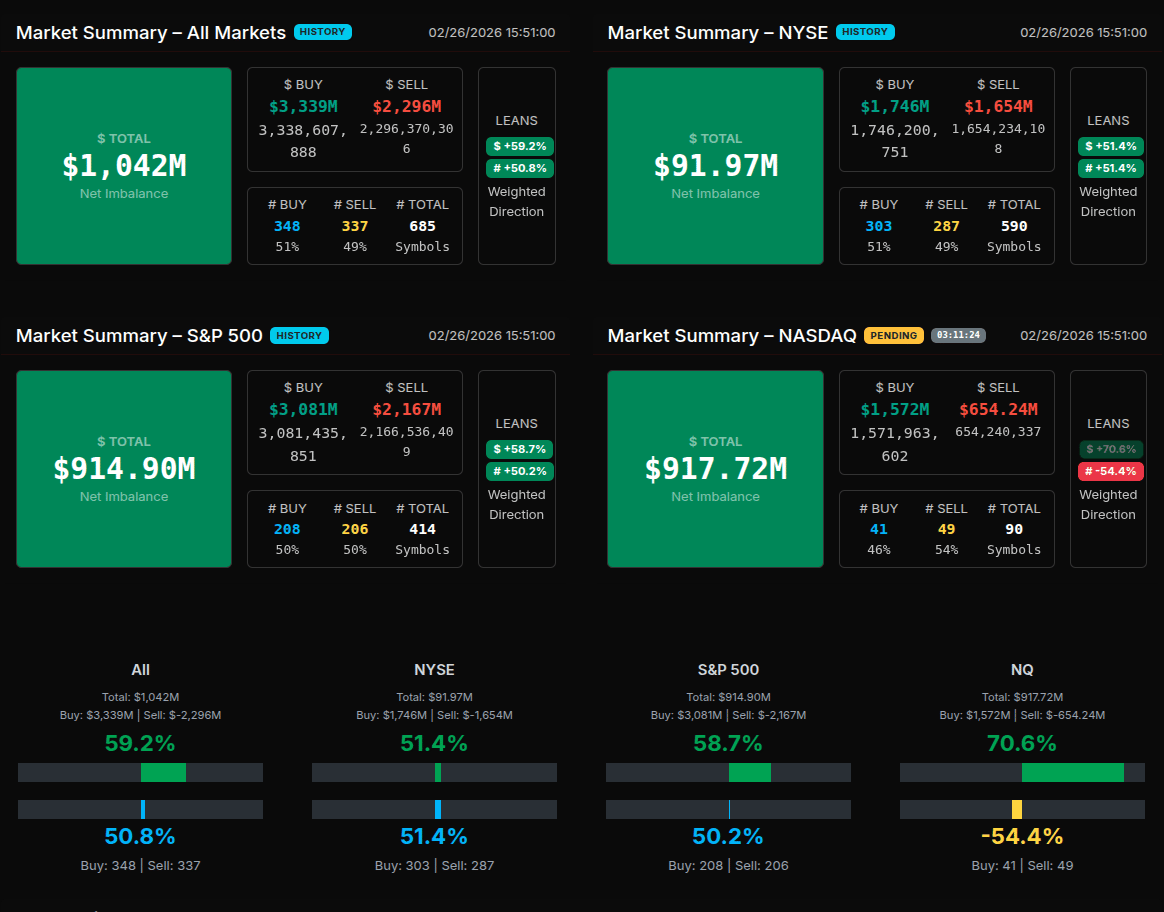
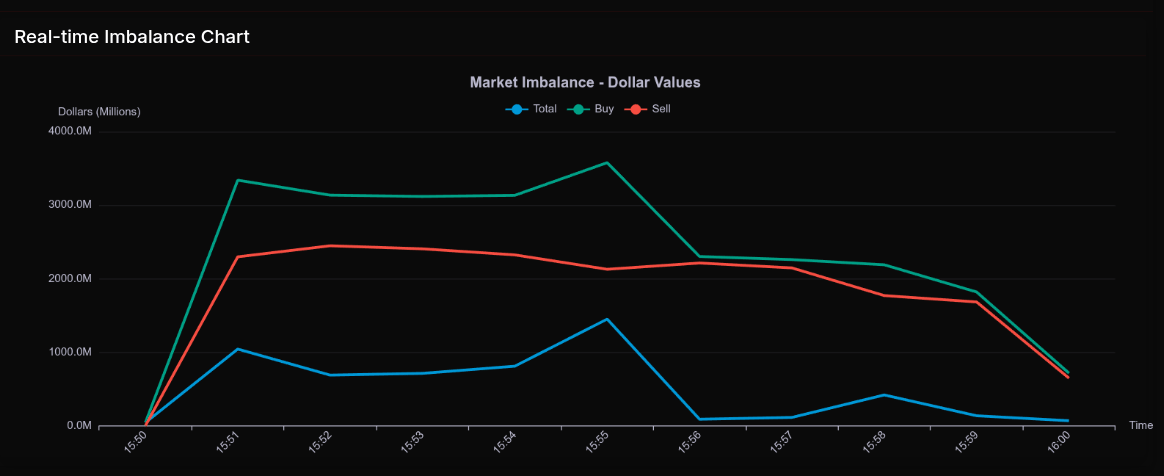
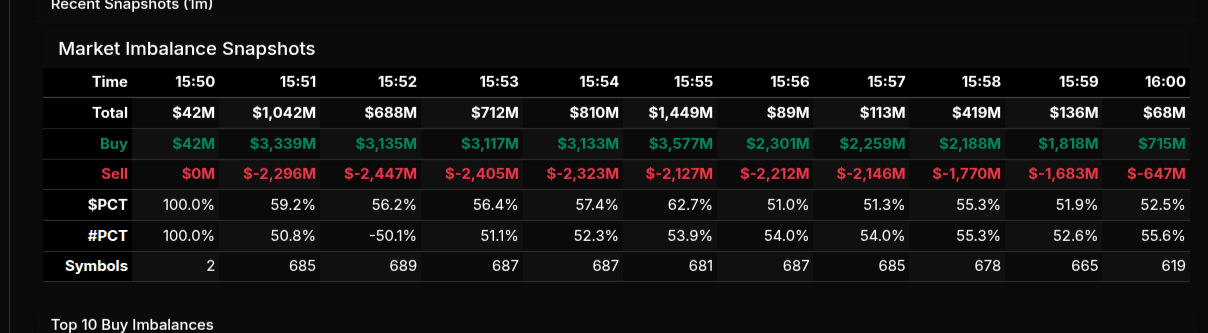
The February 26th MOC session opened with a clear institutional bid and built steadily into the 3:55 pm imbalance peak before tapering into the close. At 3:50 pm, the market showed a modest $42M buy imbalance, but by 3:51 pm, buy programs accelerated sharply to over $3.3B versus $2.29B for sale, producing a $1.04B net buy. The imbalance remained consistently bid dominant through 3:55 pm, where total buy pressure peaked near $3.57B, reflecting broad participation with nearly 685 symbols active. From 3:56 pm onward, both buy and sell programs compressed, finishing with a still-positive $68M buy skew into 4:00 pm.
Overall leans confirmed accumulation. The composite market leaned +59.2% on dollars and +50.8% on symbols, reflecting steady but rotational buying. The S&P 500 mirrored this tone with a +58.7% dollar lean and nearly balanced symbol breadth (50.2%), suggesting index-supported accumulation rather than narrow leadership. Nasdaq showed a stronger +70.6% dollar lean but negative symbol breadth (-54.4%), highlighting concentrated wholesale buying in fewer large-cap names.
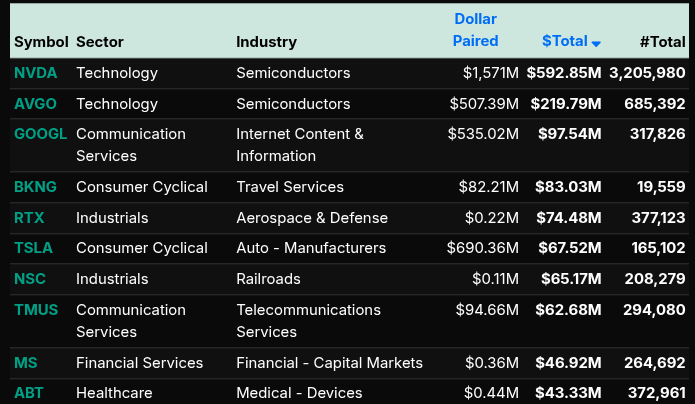
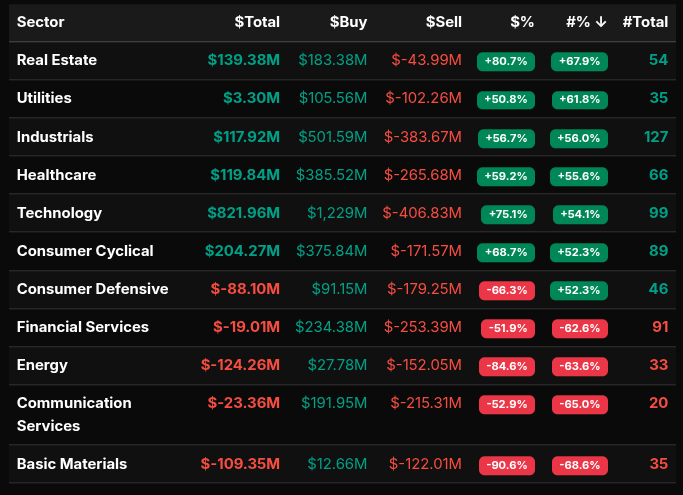
Technology dominated flows with a $821.96M net buy and a +75.1% dollar lean — notably above the 66% threshold, signaling institutional-style accumulation. Industrials (+56.7%), Healthcare (+59.2%), and Consumer Cyclical (+68.7%) also saw strong bids, while Real Estate posted a notable +80.7% lean, another wholesale buy signal despite smaller total notional.
On the sell side, Basic Materials (-90.6%) and Energy (-84.6%) registered extreme negative leans, indicating broad distribution. Communication Services (-52.9%) and Financials (-51.9%) were more rotational in nature, given their proximity to the 50% range.
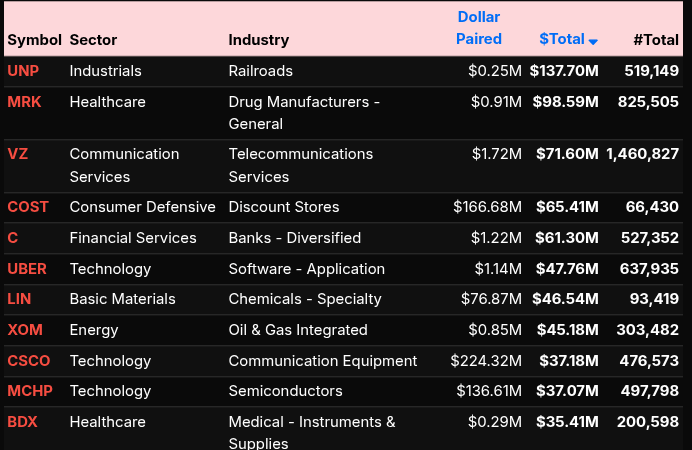
Top buy imbalances were led by NVDA ($592.85M), AVGO ($219.79M), and GOOGL ($97.54M), reinforcing concentrated Nasdaq strength. On the sell side, UNP, MRK, VZ, and COST highlighted sector-specific distribution pockets.
The session ultimately reflected index-supported accumulation driven by large-cap tech, offset by wholesale selling in materials and energy, with breadth remaining rotational beneath the surface.
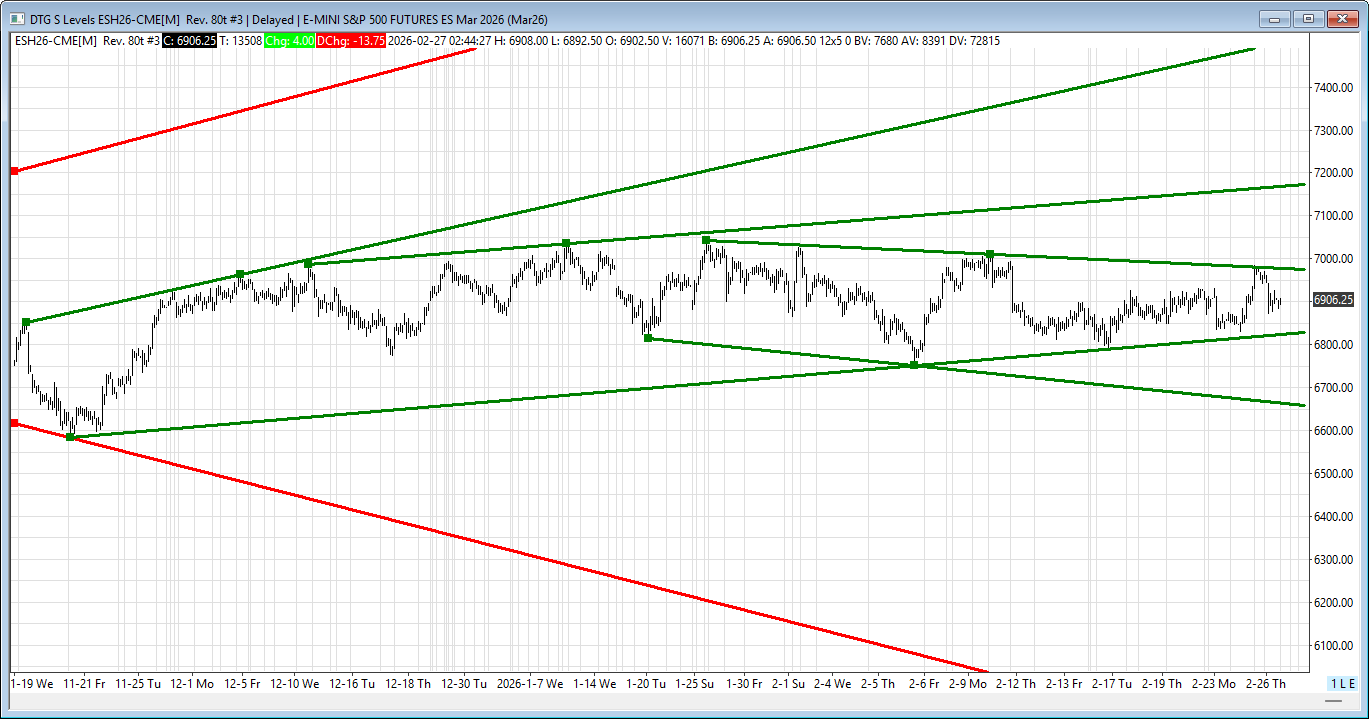
ES Levels
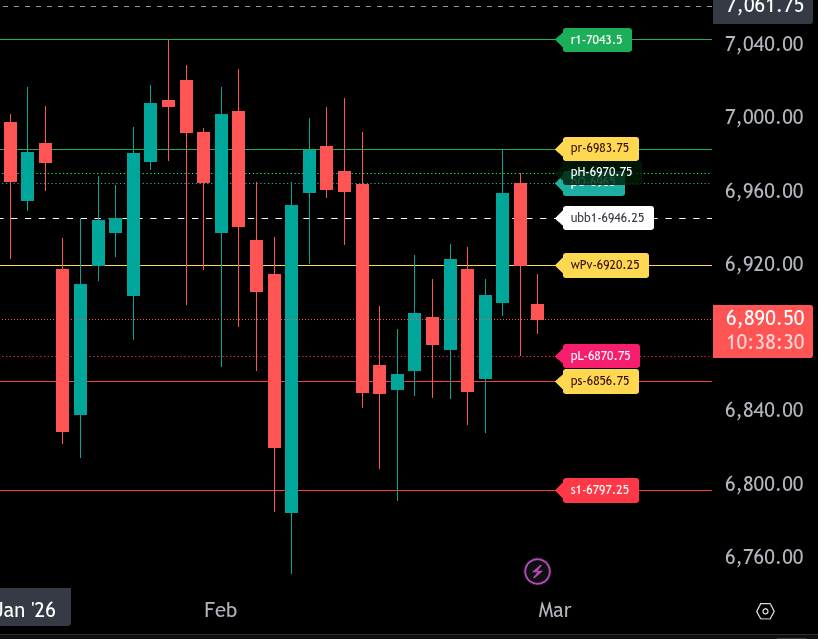
The bull/bear line for the ES is at 6920.25. This is the key level that defines intraday sentiment. Acceptance above this level shifts momentum back to the bulls, while continued trade below keeps sellers in control.
ES is currently trading around 6890.50, holding below the bull/bear line and showing early weakness in the Globex session. As long as price remains under 6920.25, downside pressure can extend toward 6870.75 and then 6856.75, which is our lower range target for today. A clean break and acceptance below 6856.75 opens the door for a larger move toward 6797.25.
On the upside, initial resistance comes in at 6946.25, followed by 6965.00 and 6970.75. The main upside objective for today sits at 6983.75, our upper range target. Bulls need to reclaim and hold above 6920.25 to build momentum for a push into this resistance pocket. Sustained trade above 6983.75 would expose the 7043.50 area as a higher-timeframe reference.
Overall, the market remains bearish below 6920.25. Watch for rejection setups under this level unless buyers can reclaim and hold above it with strong participation.
NQ Levels
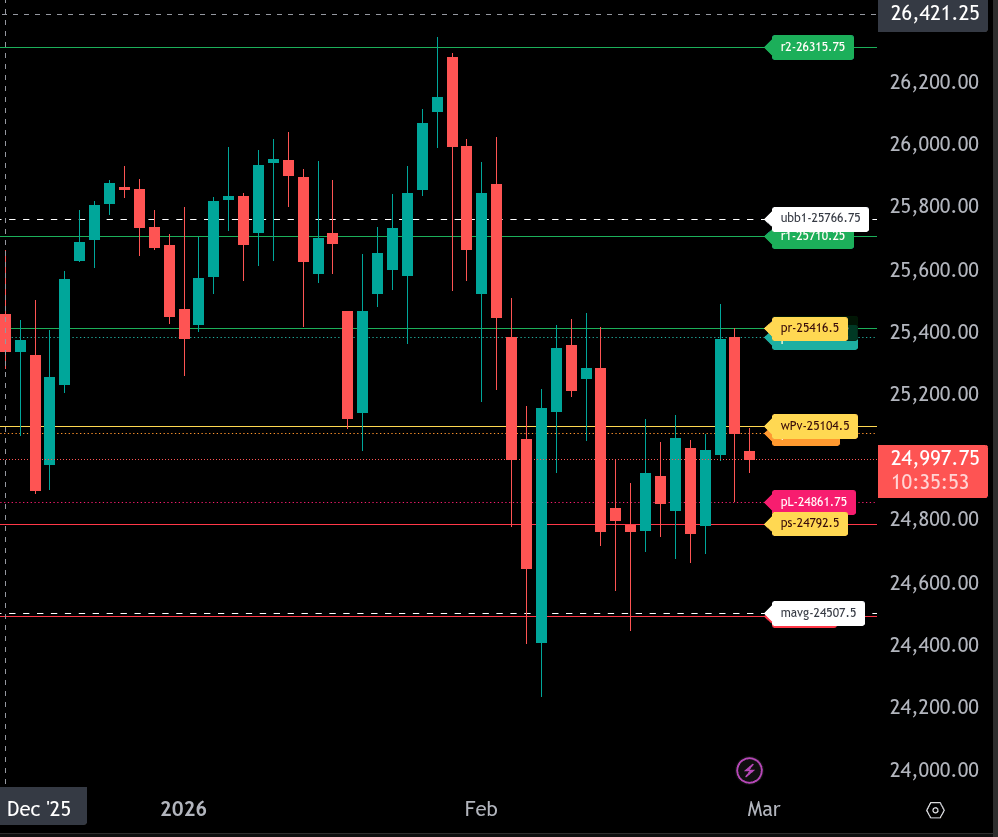
The bull/bear line for NQ is at 25104.50. This is the key pivot that defines directional bias for today. Holding below this level keeps the market in a bearish posture, while acceptance back above it would shift momentum back to the upside.
NQ is currently trading around 24996.00 in the Globex session, positioning price below the bull/bear line and indicating early weakness. As long as price remains under 25104.50, sellers have control and rallies into resistance should be viewed cautiously.
The first upside resistance comes in at 25081.00, followed by the bull/bear line at 25104.50. A reclaim and hold above 25104.50 opens the door for a push toward 25388.25 and then 25416.50, which is our upper intraday range target. Acceptance above 25416.50 would signal strong bullish expansion.
On the downside, initial support sits at 24861.75. A break below this level targets 24792.50, our lower intraday range objective. If 24792.50 fails to hold, downside pressure could extend toward 24507.50, which represents a deeper support zone from the broader structure.
Overall, the market remains bearish below 25104.50. Bulls need a decisive reclaim of that level to regain control, while continued rejection beneath it favors rotation back toward 24861.75 and potentially 24792.50.
Technical Edge
Fair Values for February 27, 2026
-
SP: 9.78
-
NQ: 42.04
-
Dow: 25.37
Daily Breadth Data 📊
For Thursday, February 26, 2026
• NYSE Breadth: 65% Upside Volume
• Nasdaq Breadth: 54% Upside Volume
• Total Breadth: 58% Upside Volume
• NYSE Advance/Decline: 62% Advance
• Nasdaq Advance/Decline: 52% Advance
• Total Advance/Decline: 56% Advance
• NYSE New Highs/New Lows: 179 / 42
• Nasdaq New Highs/New Lows: 188 / 101
• NYSE TRIN: 0.87
• Nasdaq TRIN: 0.94
Weekly Breadth Data 📈
Week Ending Friday, February 20, 2026
• NYSE Breadth: 55% Upside Volume
• Nasdaq Breadth: 56% Upside Volume
• Total Breadth: 55% Upside Volume
• NYSE Advance/Decline: 59% Advance
• Nasdaq Advance/Decline: 56% Advance
• Total Advance/Decline: 57% Advance
• NYSE New Highs/New Lows: 404 / 116
• Nasdaq New Highs/New Lows: 407 / 492
• NYSE TRIN: 1.19
• Nasdaq TRIN: 1.00
Calendars
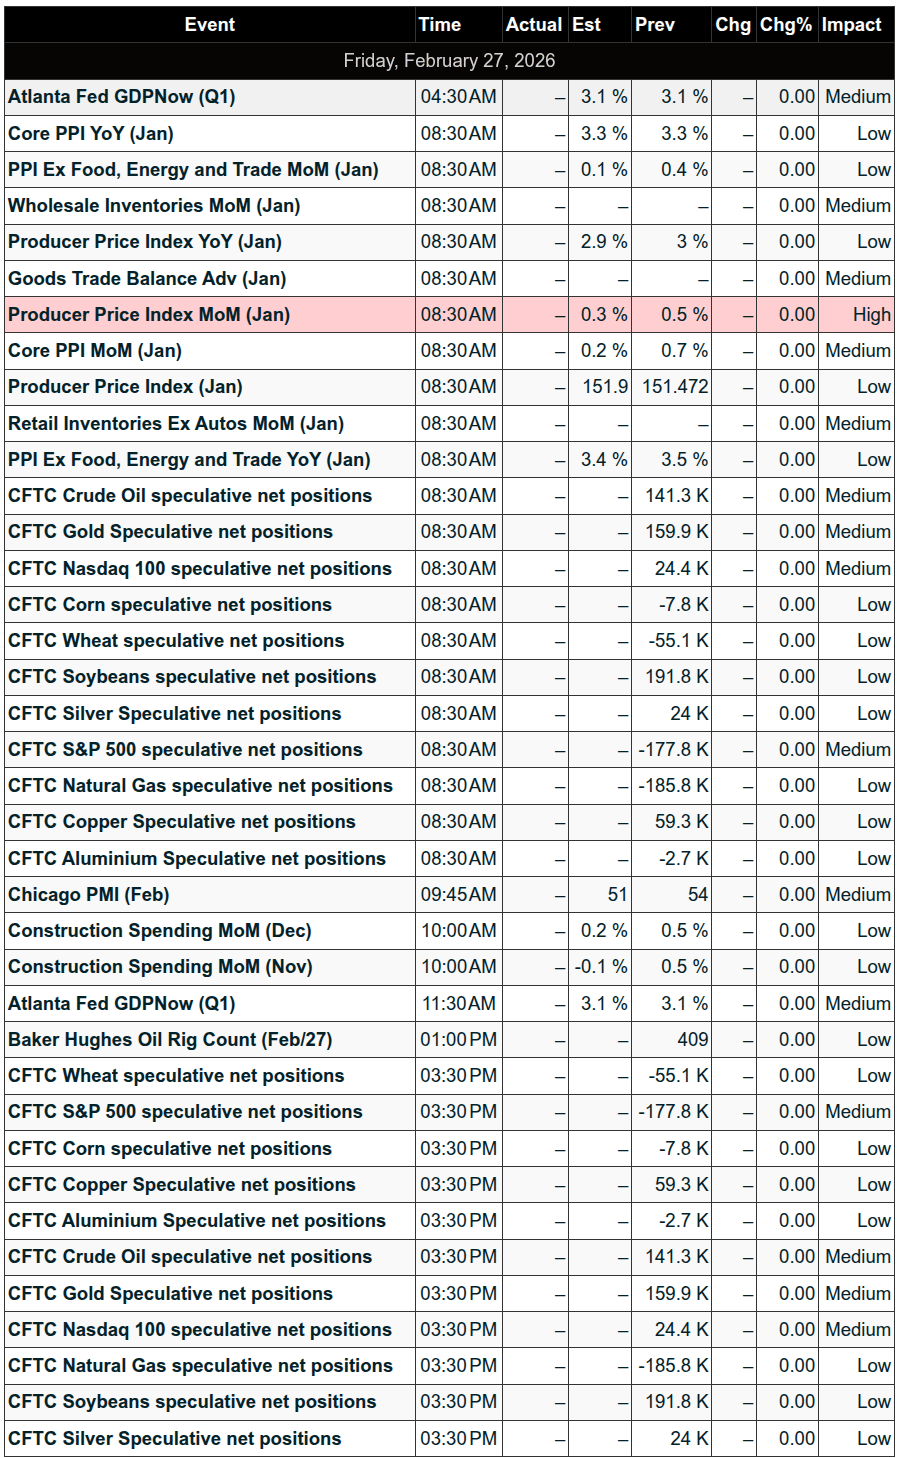
Economic Calendar Today
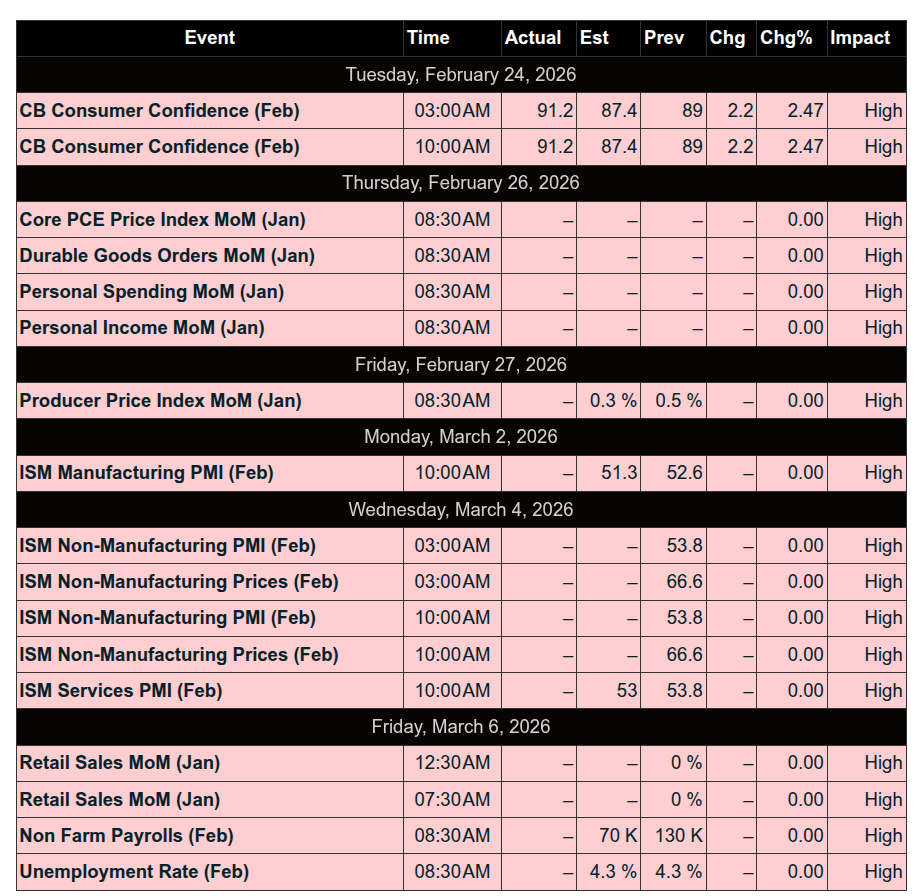
This Week’s High Importance
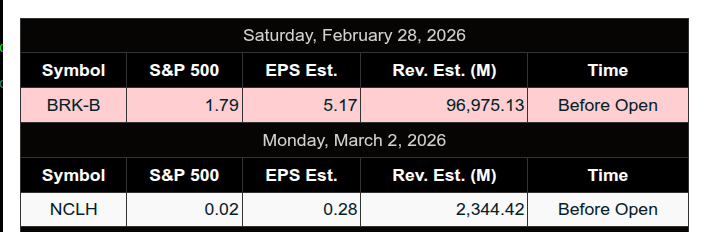
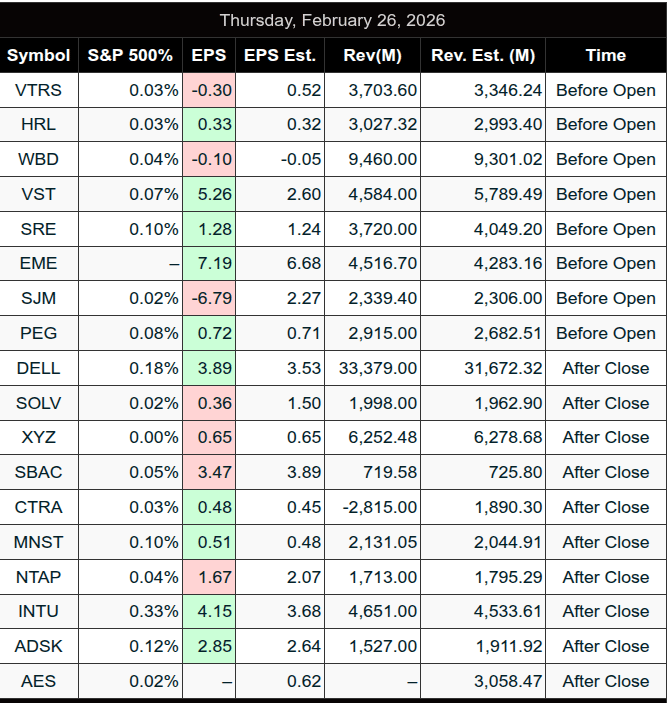
S&P 500 Earnings:
Upcoming:
Recent:
Trading Room News:
Polaris Trading Group Summary – For Thursday, February 26, 2026
Thursday was a textbook Cycle Day 2 session that delivered both opportunity and education — especially for traders who stayed disciplined through the morning volatility.
Morning Plan & Early Structure
David framed the session clearly from the start:
-
Pivot Zone: 6960 ±5
-
Bull Case: Acceptance above → 6970 → 6975 → 6980
-
Bear Case: Acceptance below → 6950 → 6945 → 6940
Premarket context showed mixed tech sentiment, with NVDA slightly higher, but the real story became inventory repricing after the open.
Early commentary noted that lower targets had been explored and successfully tested with buy response. However, price ultimately rotated lower, triggering the Open Range Short strategy.
Trade Performance Highlights
Open Range Shorts (ES & NQ)
-
Both hit Target 1
-
Clean execution aligned with downside acceptance below the pivot
-
Strong example of trusting the plan rather than opinion
CL Open Range Short
-
Stopped out
-
Managed according to rules — controlled loss, no emotional reaction
This was a strong example of maintaining a portfolio mindset:
-
Loss contained in CL
-
Profits delivered in ES and NQ
-
Net execution solid
The “Elevator Down” & Reset
The market delivered what Peter described as the classic:
-
“Elevator down” flush
-
Designed to blow out weak longs
-
Followed by short squeeze behavior
David confirmed the structural reasoning: the market repriced inventory lower, shook out weak longs, reset, and re-engaged.
This reset brought price into:
-
D-Level
-
Cycle Violation Levels
-
Money Box zone
Once again, PTG D-Levels and Cycle Violation Levels proved their value for key reversal plays.
Key Lessons Reinforced
1) ATR4 Works Best in Trends
Peter made an excellent observation that ATR4 performs best as a pullback within a trend and has a higher failure rate in chop.
David reinforced that first pullback A4 and Discount/Premium structures have long been core “bread and butter” setups.
This was strong real-time pattern recognition and a great learning moment for the room.
2) Cycle Day 2 Structure Played Out Cleanly
Morning:
-
Dislocation lower
-
Inventory reset
-
Emotional volatility
Afternoon:
-
“Shake n Bake” setup
-
Grind back toward Midpoint VWAP
-
Bulls regained control
Late day:
-
$1.2B MOC Buy Imbalance
-
Close within Midpoint–VWAP zone
-
Structurally consistent with Cycle Day 2 behavior
The day followed structure rather than randomness.
Bigger Takeaways
-
Controlled execution beats prediction.
-
D-Levels and Cycle Violations continue to provide high-probability reversal zones.
-
Inventory resets are opportunity, not panic.
-
Open Range remains a core income generator.
-
Understanding inventory and repricing builds conviction during volatility.
DTG Room Preview – Friday, February 27, 2026
Markets are focused on this morning’s PPI release and growing concerns around AI-driven job displacement.
Tech & AI Developments
-
Nvidia (NVDA) posted its third straight blowout earnings report, but shares reacted bearishly again, pressuring major indexes. The stock remains in a sideways consolidation since July as AI-related macro fears outweigh strong near-term results. Valuation has compressed significantly, with NVDA’s P/E now around 46x versus peaks of 120x (2023) and 80x (2021/2024).
-
AI demand continues to drive global memory chip consumption, pushing consumer electronics prices higher. IDC projects average smartphone prices will rise 14% this year to a record $523, eliminating sub-$100 models. Higher prices are expected to contribute to a 12.9% drop in smartphone sales in 2026.
-
Block (XYZ) surged 22% after hours after announcing plans to cut nearly half its workforce (from 10,000+ to under 6,000), citing AI-driven automation.
-
Netflix (NFLX) jumped 13% after pulling its $82.7B bid for Warner Bros. Discovery, clearing the way for Paramount Skydance’s $111B offer. Netflix cited valuation discipline amid political and regulatory complexities.
Macro & Geopolitics
-
U.S.–Iran nuclear negotiations showed “significant progress,” though tensions remain elevated as the U.S. continues its military buildup in the Middle East. Gold is now up 20% in 2026, supported in part by geopolitical risks.
-
No major earnings today. Monday pre-market: NCLH and KSPI.
-
Today’s economic data:
-
PPI (8:30am ET)
-
Chicago PMI (9:45am ET)
-
Construction Spending (10:00am ET, delayed)
-
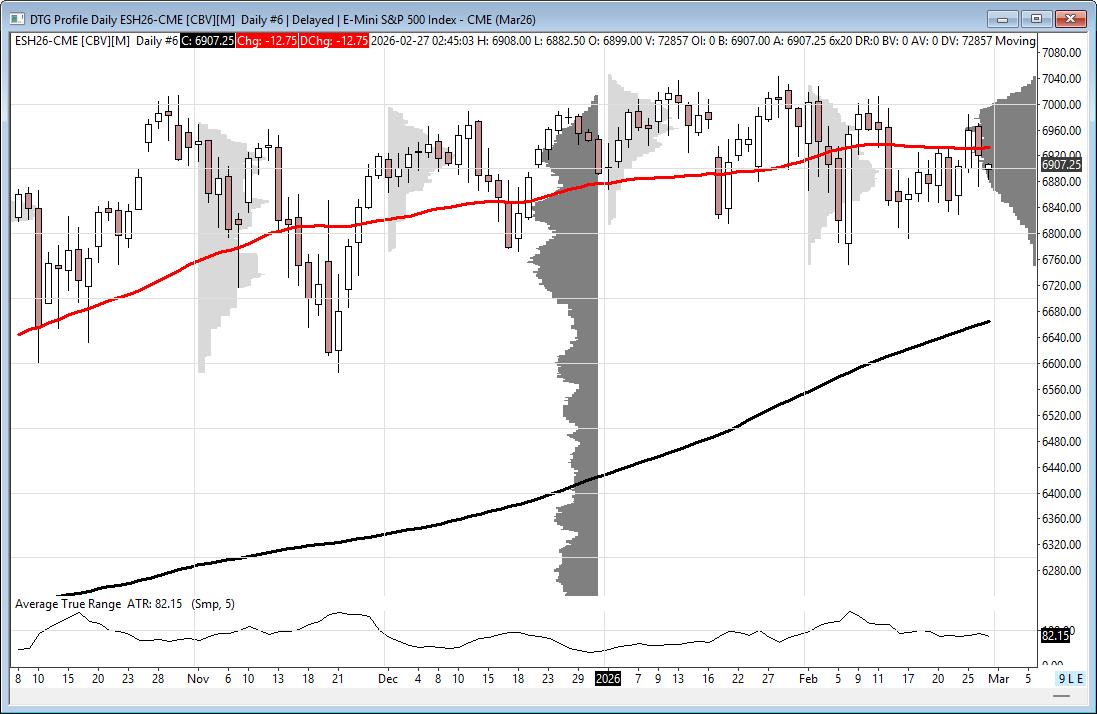
Technical Outlook (ES Futures)
-
Volatility remains moderately elevated, with a 5-day average daily range of 91.5 points.
-
ES remains in a 4-month sideways consolidation below all-time highs.
-
Price closed back below the 50-day MA (6932), a short-term bearish signal, though the level is currently acting as neither clear support nor resistance.
-
ES is trading near the middle of its short-term downtrend channel and in the lower quadrant of its intermediate-term uptrend channel.
Key Levels
-
Resistance: 6977/74, 7170/75
-
Support: 6830/33, 6661/56
Overnight large trader flow leaned bearish but was too light to signal a strong directional bias.
Affiliate Disclosure: This newsletter may contain affiliate links, which means we may earn a commission if you click through and make a purchase. This comes at no additional cost to you and helps us continue providing valuable content. We only recommend products or services we genuinely believe in. Thank you for your support!
Disclaimer: Charts and analysis are for discussion and education purposes only. I am not a financial advisor, do not give financial advice and am not recommending the buying or selling of any security.
Remember: Not all setups will trigger. Not all setups will be profitable. Not all setups should be taken. These are simply the setups that I have put together for years on my own and what I watch as part of my own “game plan” coming into each day. Good luck!!
Follow @MrTopStep on Twitter and please share if you find our work valuable!
This post goes out as an email to our subscribers every day and is posted for free here around 2 PM ET. To get your real-time copy, sign up for the free or premium version here: Opening Print Subscribe.
Comments are closed