This post goes out as an email to our subscribers every day and is posted for free here around 2 PM ET. To get your real-time copy, sign up for the free or premium version here: Opening Print Subscribe.
Seventeen Years Since Lehman — and We’re Still Partying on the Fed’s Tab.
Follow @MrTopStep on Twitter and please share if you find our work valuable!
Our View
The S&P goes up, the S&P goes down—and then it goes up again, a lot more.
The ES traded down to 6888.00 and rallied up to 6918.50 on Globex before opening Friday’s regular session at 6902.00, up 48 points or 0.70% from the prior settlement. It then sold off down to 6873.50 at 10:20 ET, rallied back up to 6899.50 (touching that level around both 10:30 and 11:18 ET), dropped down to a new session low of 6856.50 at 12:18 ET, rallied up to a lower high at 6876.25 at 12:33 ET, and made the low for the day at 6843.50 at 1:18 ET.
That’s when some small ES buy programs started to hit, pushing the ES up to 6877.50 at 2:40 ET. After a small pullback to the 6868.75 level, it traded 6880.00 as the 3:50 ET imbalance showed $2.9 billion to buy, and traded 6872.00 on the 4:00 ET cash close.
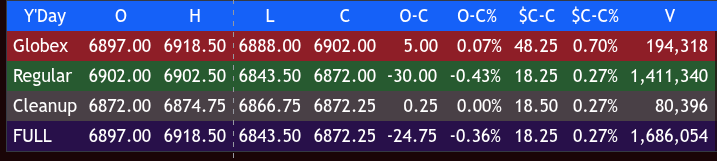
After 4:00 ET, the ES edged higher in closing Globex action amid light volume and pre-weekend positioning, reclaiming 6885.00 by 4:30 ET and trading 6872.25 on the 5:00 futures close, up +18.25 points or +0.27%. The NQ settled at 26,004.00, up +121 points or +0.47% on the day.
In the end, Friday’s trade was a great example of my three parts to the trading day: what happens on Globex, what happens after the 9:30 open, and what happens in the last hour. The ES and the NQ fall—but they don’t stay down long.
If you look at the daily net changes over the last 9 sessions (Oct 21–31), the NQ has risen 6 out of 8 sessions (75%) for a total gain of +2.80%, while the ES has been up 5 out of 8 sessions (62.5%) for a total gain of +1.49%. The NQ has been the clear leader on both up and down days and in net changes.
In terms of the ES’s overall tone, both the ES and NQ staged a big late-day rally with tech leading the way. In terms of the ES’s overall trade, volume was pretty much in line with the week’s volumes at 1.678 million contracts traded.
2007-2008 Credit Crisis #NeverForget

I really don’t think people think about this, but the 2008 Credit Crisis was 17 years ago. That means if you’re 30 years old, you were only 13 back then. If you’re 40, you were 23. I was 49. I had already seen just about every type of stock market crash. It wasn’t like 1978, and it wasn’t like the 2000 tech bubble—it was way bigger than both. The crisis cost $22 trillion globally, according to a GAO estimate.
I think the best word to describe it is vicious. In all my years on the floor and dealing with some of the largest banks, hedge funds, investment firms, and prop firms, I have never seen things freeze up so fast. I know some people will say they were on top of it, but to tell the truth, the only ones that were really on top of it were the banks that took the TARP money when they didn’t actually need it—like Goldman Sachs.
Every day for weeks and months, I marched onto the CME floor, right into ground zero for the credit crisis. Not 10 feet away from my desk: Bear Stearns to the right, and Lehman Brothers’ desk was right above mine— both just disappeared in the middle of September 2008. Watching Bear go down was shocking, but Lehman was monstrous. After QE1, everyone thought the markets would stabilize, and they did. The SPU rallied in December and then pushed back down to the famous March 2009 666 low.
2007–2008 Credit Crisis Timelines
Things were fast and furious during the 2007–2008 Global Financial Crisis. It began with the U.S. housing bubble peaking in 2004–2006 (S&P 500 ~1,200–1,400), fueled by subprime ARMs and low Fed rates.
-
Feb 27, 2007 – Freddie Mac halted risky MBS purchases (S&P 1,405.37)
-
Apr 2, 2007 – New Century Financial went bankrupt (S&P 1,445.57)
-
June–July 2007 – Bear Stearns hedge funds collapsed (S&P 1,503.35 by July 31)
-
Aug 9, 2007 – Global credit freeze hit (S&P 1,444.08) and triggered over $300B in emergency liquidity
-
Sep 2007 – Fed began cutting rates
-
Dec 2007 – U.S. recession officially began (S&P 1,468.36)
-
Jan 2008 – BofA acquired Countrywide (S&P 1,339.67)
-
Mar 16, 2008 – Bear Stearns sold to JPMorgan (S&P 1,323.06) with $30B Fed-backed loan
-
July 2008 – IndyMac failed (S&P 1,265.61)
-
Sep 7, 2008 – Fannie/Freddie nationalized (S&P 1,238.32)
-
Sep 15, 2008 – Lehman Brothers filed for bankruptcy (S&P 1,199.38)
-
Sep 15, 2008 – AIG received an $85B bailout
-
Sep 25, 2008 – WaMu seized by FDIC (S&P 1,207.09)
-
Oct 3, 2008 – TARP ($700B) signed (S&P 1,099.23)
-
Nov 25, 2008 – QE1 announced (S&P 851.81) with $800B in MBS/agency purchases
-
Dec 16, 2008 – Fed cut rates to 0–0.25% (S&P 913.18)
-
Mar 18, 2009 – QE1 expanded by $1.15T to total $1.75T (S&P 794.35)
-
Mar 9, 2009 – S&P bottomed at 676.53
-
June 2009 – Recession officially ended (S&P 926.62)
-
July 21, 2010 – Dodd-Frank signed (S&P 1,101.84)
-
Nov 3, 2010 – QE2 ($600B Treasuries) launched (S&P 1,197.96)
-
Sep 13, 2012 – QE3 began (S&P 1,459.47) with $85B/month in MBS/Treasuries
-
Oct 29, 2014 – QE3 ended (S&P 2,018.05), Fed balance sheet had grown from $900B to ~$4.5T
I don’t think there was anyone on the floor as close to the credit crisis as I was. Taking down AIG’s book was stunning, after all the years of having them as a client and knowing everyone at the desk. And then Raj and BofA… obviously, losing both accounts was irreplaceable. The carnage and job losses were absolutely astonishing.
I had a saying back then: Wall Street threw a big party—and we weren’t invited, but we had to pay for it. And I fear that’s what’s happening now with runaway debt. I get the Fed’s tightening now, but if we ever hear “QE” again, we all better run for the hills.
Our View
What’s the old saying? There is no rest for the wicked? I told the PitBull, there’s no way anyone can keep up with all the news. It’s gotten so out of hand it’s unimaginable—and adding to it, this week features 135 S&P 500 companies reporting. According to FactSet, more than 300 S&P 500 companies have posted third-quarter results so far. Of those, over 80% have beaten expectations—and another 100-plus report this week, including key AI and tech names.
Tom Lee, head of research at Fundstrat, said:
“Fundamentally, the U.S. earnings picture remains strong and is supported by these three factors: AI spending visibility remains strong and Amazon’s strong 3Q25 report is the latest evidence of this; financials are driving innovation via blockchain; the Fed is dovish and lowering interest rates; and QT (quantitative tightening) is ending Dec 1.”
Our Lean
Mondays have closed higher for the last nine weeks. I still think higher, I got long last night at 6885.50. Barring some mishap, I see new highs this week. The first trading week of November is bullish, but there are some things to keep on your radar: the NY mayoral race on Tuesday and this week’s economic calendar, which could cause additional volatility.
Our lean: Most days when the ES and NQ gap higher, they sell off and then rally. You can play it two ways—sell the early rallies on open, and buy the pullbacks, or just be patient and buy the drops.
@AlamancTrader
November Begins Best 3-Month Span!
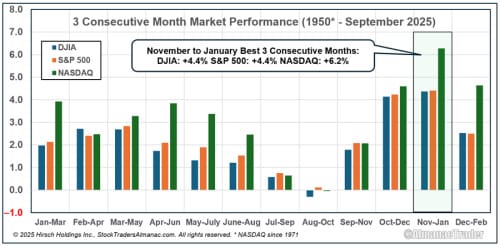
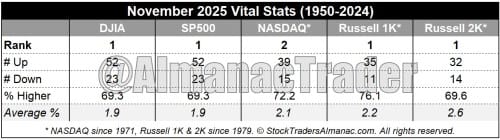
November begins the “Best Six Months” for the DJIA and S&P 500, and the “Best Eight Months” for NASDAQ. Small caps come into favor during November, but don’t really take off until the last two weeks of the year. November is the best month of the year for DJIA, S&P 500 (since 1950), Russell 1000 (since 1979), and Russell 2000 (since 1979). November is the second best for NASDAQ (since 1971). Average performance ranges from 1.9% by DJIA and S&P 500 to a solid 2.6% by Russell 2000.
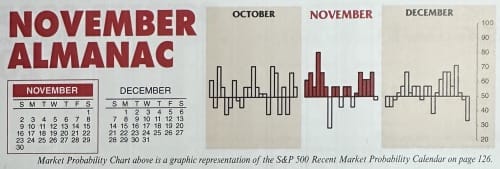
November maintains its status among the top performing months as fourth-quarter cash inflows from institutions have historically driven November to lead the best consecutive three-month span, November-January. However, the month has taken hits during bear markets and November 2000, down –22.9% (undecided election and a nascent bear), was NASDAQ’s second worst month on record—only October 1987 was worse.
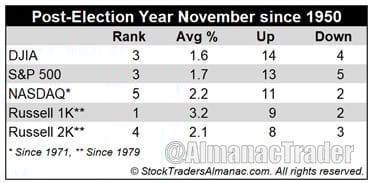
In post-election years, November’s market prowess is essentially unchanged. DJIA has advanced in 14 of the last 18 post-election years since 1953 with an average gain of 1.6%. DJIA had been up 11-straight post-election year Novembers until 2021. Prior to that DJIA’s last losing post-election year November was all the way back in 1973 (-14.0%, Arab oil embargo began 10/19/1973). S&P 500 has been up 13 in the past 18 post-election years. Small caps perform well with Russell 2000 climbing in 8 of the past 11 post-election years, averaging 2.1%. The only real blemishes in the November post-election year record are 1969 (DJIA –5.1%), 1973 (DJIA –14.0%, OPEC oil embargo), and 2021 (DJIA –3.7%).
MiM
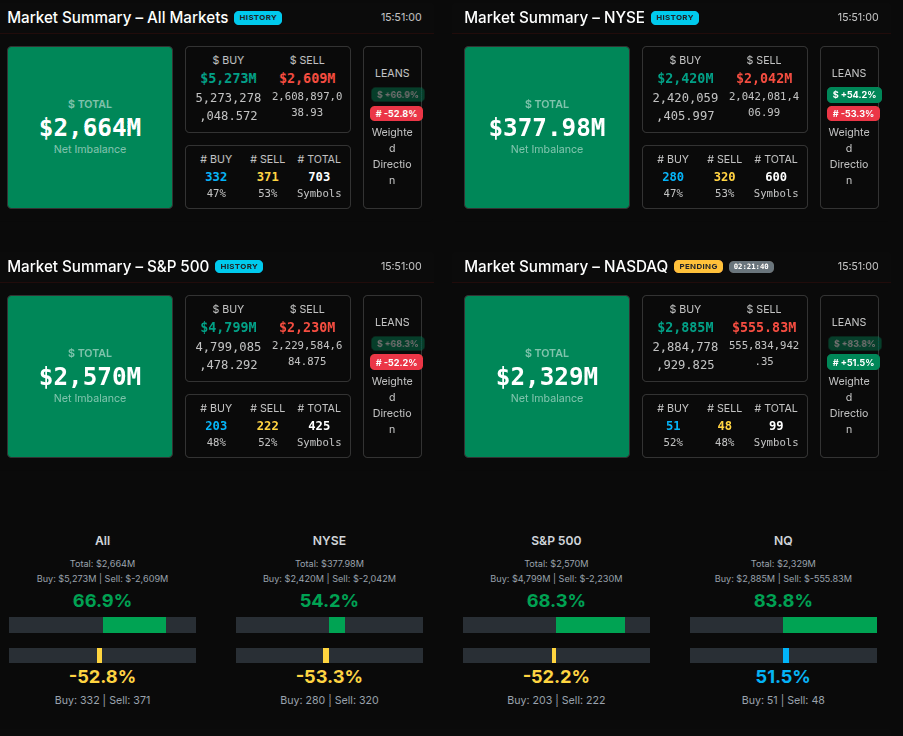
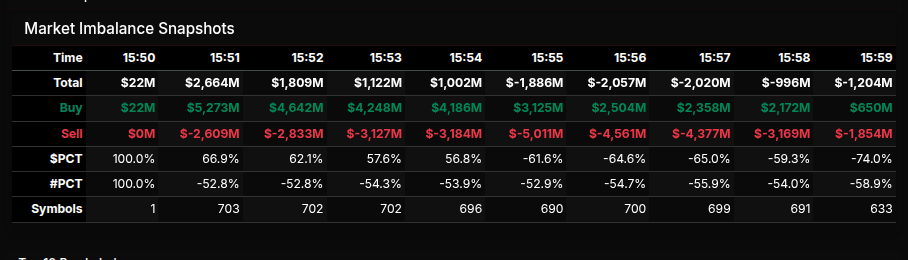
Friday’s MOC opened with strong institutional buying across all major indices, showing a net imbalance of $2.66B to buy. Momentum was strongest out of the NASDAQ, where buy programs dominated with an 83.8% lean—well above the +66% threshold that marks broad-based wholesale accumulation. The S&P 500 followed with a +68.3% lean, while the NYSE was more rotational at +54.2%.
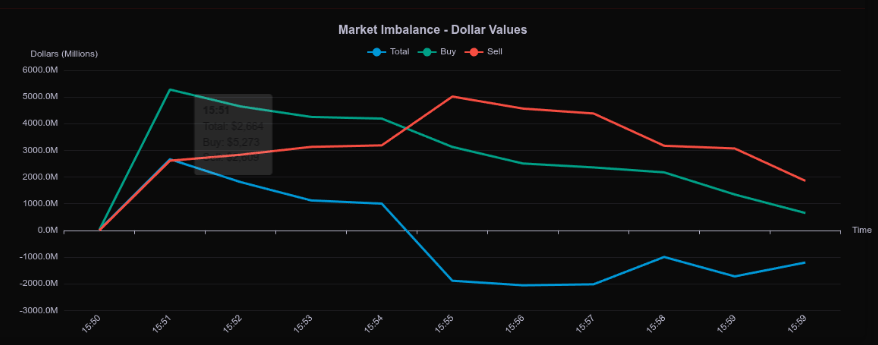
From 15:50 to 15:51 ET, buy imbalances surged from nearly flat to $5.27B before easing steadily into the close. By 15:56, the total flipped to a net sell of $2.05B, suggesting heavy rotation rather than outright liquidation. Symbol participation was broad, peaking at 703 names. The early pop in buy volume largely defined the session’s tone—institutions came in strong, then faded into profit-taking ahead of the weekend.
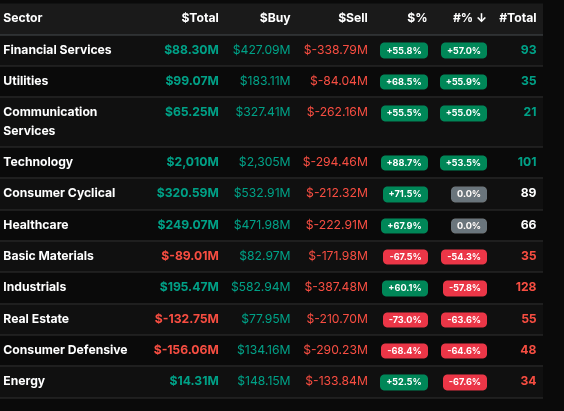
Sector breakdowns showed leadership in Technology (+88.7%), Consumer Cyclical (+71.5%), and Healthcare (+67.9%), all pointing to continued appetite for growth and innovation. Financials and Utilities each posted moderate positive leans (+55–68%), while Real Estate (-73.0%), Consumer Defensive (-68.4%), and Basic Materials (-67.5%) were notable drags—classic signs of capital rotation out of defensives into risk.
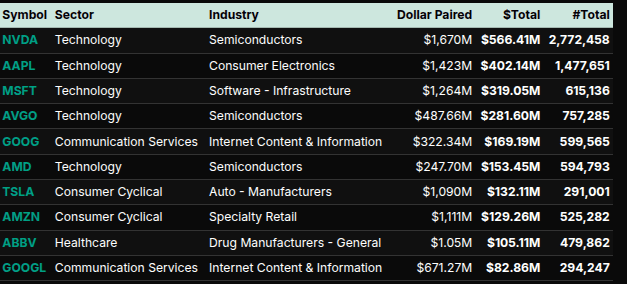
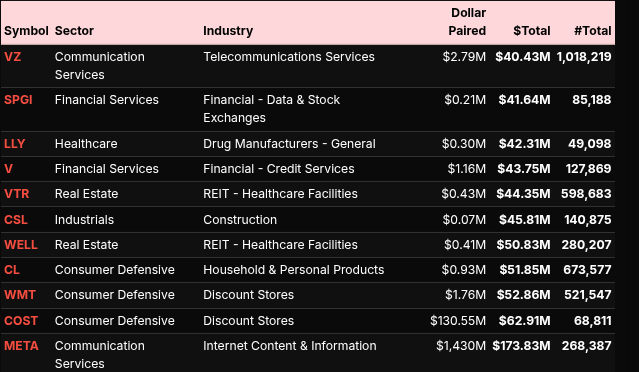
Among individual names, NVDA ($566M buy), AAPL ($402M buy), MSFT ($319M buy), and AVGO ($281M buy) led the tech-heavy inflows. Communication Services names GOOG and GOOGL also drew solid buying. On the sell side, META ($173.8M sell), COST ($62.9M), and WMT ($52.7M) showed meaningful outflows, consistent with the sector rotation narrative.
In sum, the MOC tape confirmed broad market accumulation early, led by the NASDAQ and megacap tech, before a controlled fade into the bell. The overall 66.9% weighted lean reflects sustained institutional risk appetite—a strong start to November’s historically bullish stretch.
Technical Edge
Fair Values for November 3, 2025:
-
SP: 28.19
-
NQ: 125.38
-
Dow: 128.15
Daily Breadth Data 📊
For Friday, October 31, 2025
• NYSE Breadth: 60% Upside Volume
• Nasdaq Breadth: 70% Upside Volume
• Total Breadth: 69% Upside Volume
• NYSE Advance/Decline: 57% Advance
• Nasdaq Advance/Decline: 58% Advance
• Total Advance/Decline: 58% Advance
• NYSE New Highs/New Lows: 64 / 95
• Nasdaq New Highs/New Lows: 111 / 178
• NYSE TRIN: 0.78
• Nasdaq TRIN: 0.59
Weekly Breadth Data 📈
For Week Ending October 31, 2025
• NYSE Breadth: 46% Upside Volume
• Nasdaq Breadth: 55% Upside Volume
• Total Breadth: 52% Upside Volume
• NYSE Advance/Decline: 32% Advance
• Nasdaq Advance/Decline: 35% Advance
• Total Advance/Decline: 34% Advance
• NYSE New Highs/New Lows: 293 / 181
• Nasdaq New Highs/New Lows: 700 / 373
• NYSE TRIN: 0.53
• Nasdaq TRIN: 0.42
Today’s BTS Levels:
ES Z
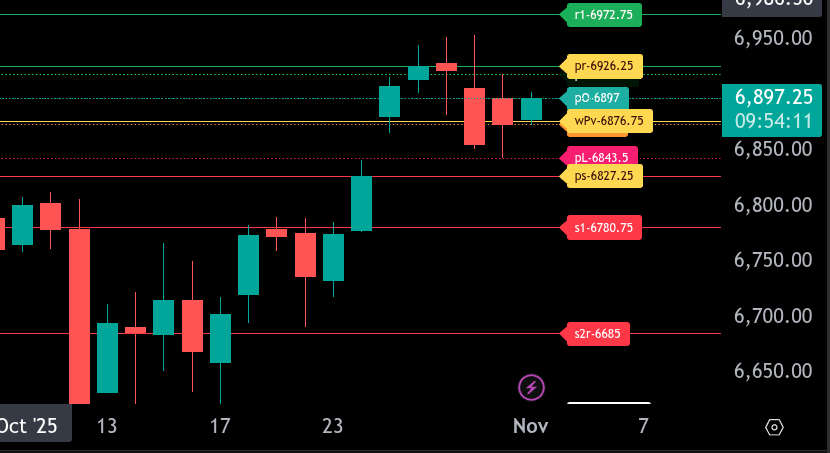
The bull/bear line for the ES is at 6876.75. This level marks the pivot between bullish and bearish control for today’s session. Above it, buyers can attempt to regain footing; below it, sellers maintain the upper hand.
Currently, ES is trading around 6898.50, comfortably above the bull/bear line, suggesting early signs of strength in the pre-market session. Holding above 6876.75 keeps the door open for a potential push higher toward resistance.
Upside targets include 6926.25, which is today’s upper range target (pr-6926.25). A breakout above that could extend the move toward 6972.75, aligning with the r1 resistance zone. Sustained trade above 6926.25 would confirm buyer control intraday.
On the downside, support comes in first at 6874.00 and then 6843.50. The lower range target for today is 6827.25. A break and hold below this zone would likely invite additional selling pressure toward 6780.75.
Overall, the short-term tone leans bullish above 6876.75, but momentum remains fragile after last week’s pullback. Expect choppy trade between 6870.00 and 6920.00 until one side firmly breaks out of this consolidation zone.
NQ Z
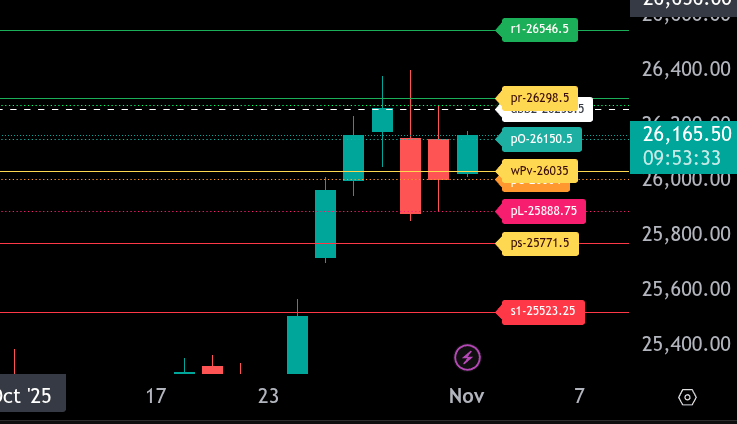
The bull/bear line for the NQ is at 26,035. This is the key level that defines directional bias for today. Holding above 26,035 favors buyers, while trading below this level shifts momentum back to the sellers.
Currently, NQ is trading around 26,166.75 during the Globex session, showing moderate strength above the bull/bear line. If this level holds, look for a potential push toward 26,298.50, which marks the upper range target. A breakout above that level could extend toward 26,546.50 (R1 resistance), followed by 26,555.00 as the next significant upside level.
On the downside, immediate support rests near 26,004 and then 25,888.75. If sellers gain control below 26,035, a move toward 25,771.50 (lower range target) becomes likely. Further weakness could test 25,523.25, the next major support.
Overall, the tone remains cautiously bullish above 26,035, but failure to sustain above this level could quickly shift momentum bearish. Watch the 26,035 pivot closely to determine the day’s directional bias and manage risk accordingly.
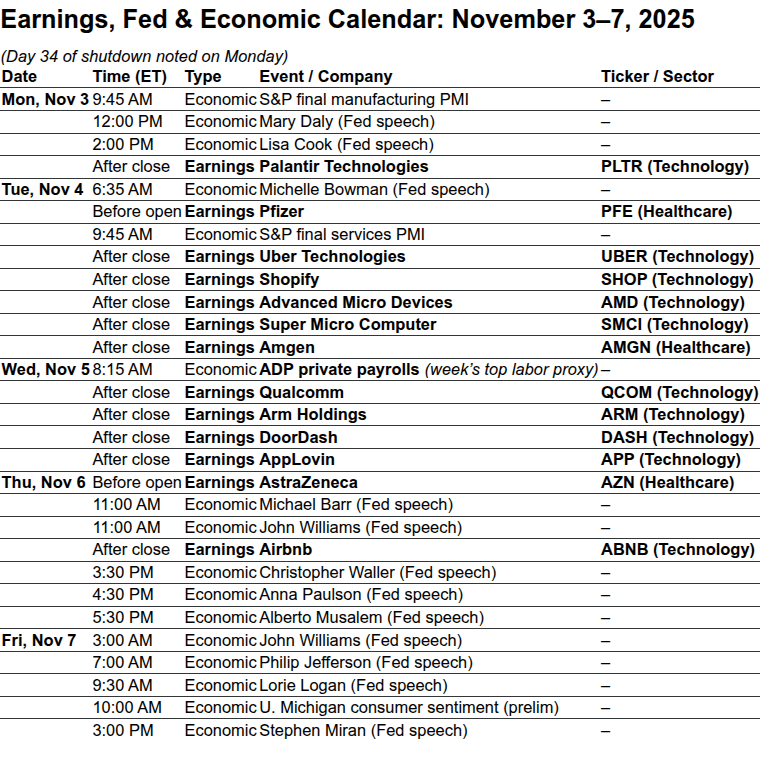
Calendars
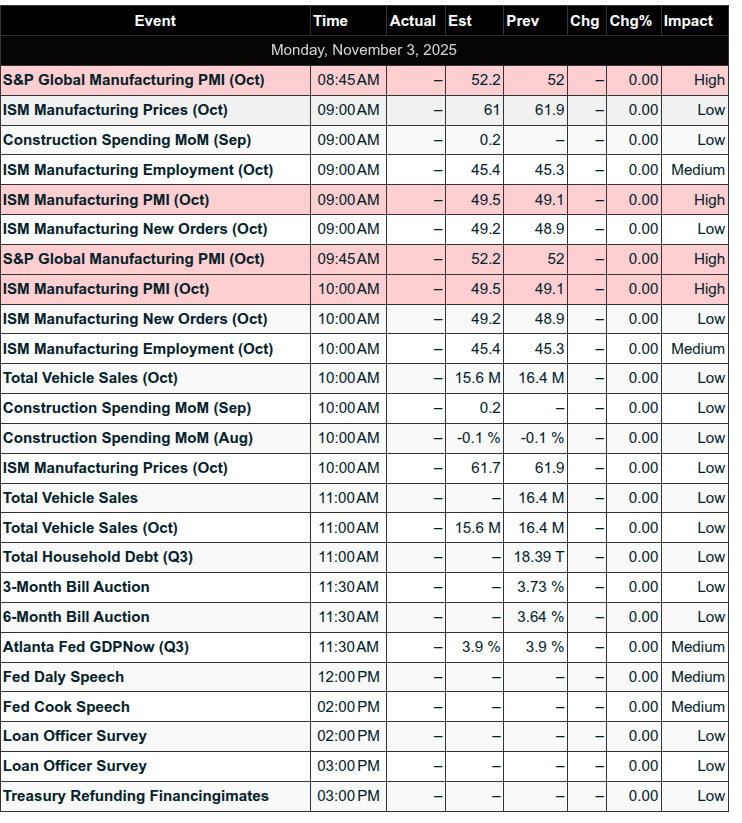
Today’s Economic Calendar
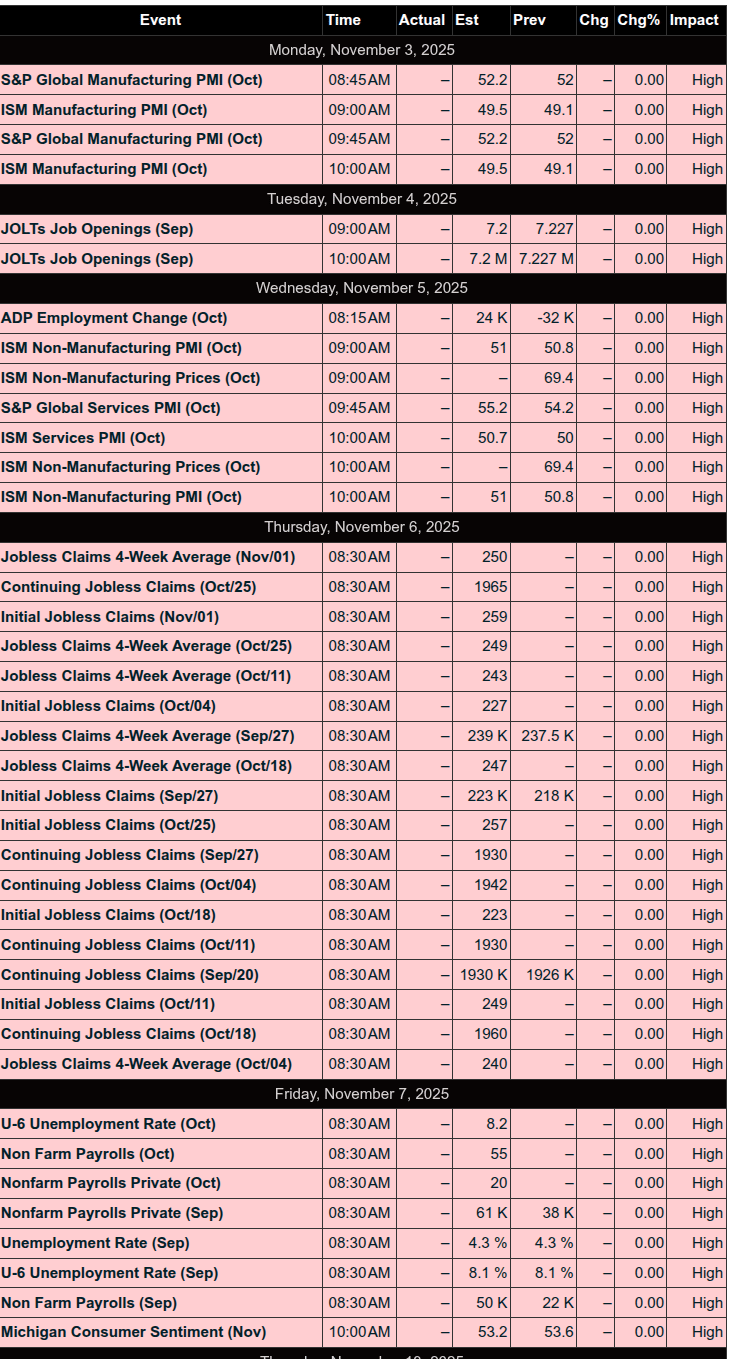
This Week’s Important Economic Events
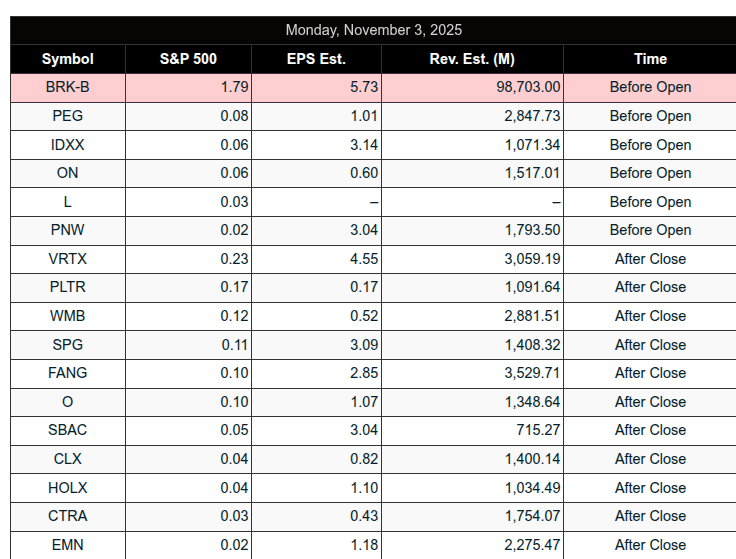
Today’s Earnings
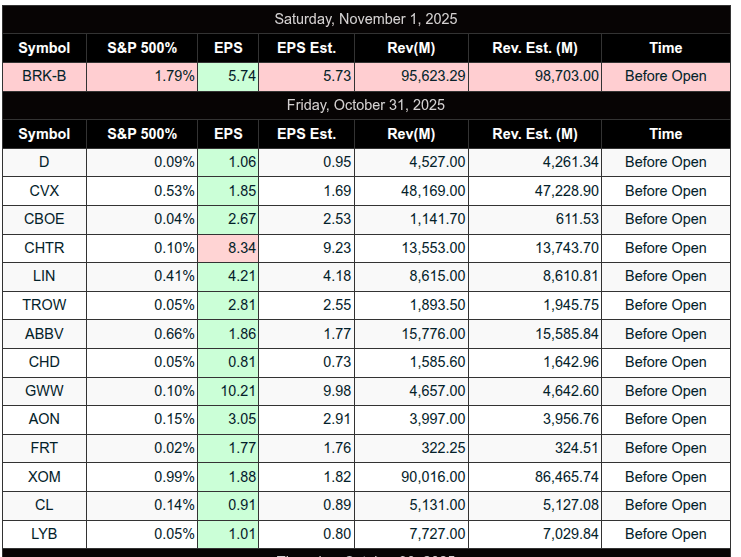
Recent Earnings
Room Summaries:
Polaris Trading Group Summary – Friday, October 31, 2025
Friday’s session closed out the month of October (“Rocktober”) with strong intraday action, textbook technical plays, and solid trade execution — especially early in the session. The day had a clear lean toward capital preservation, with a few well-identified opportunities providing solid returns for those who remained disciplined. Markup and month-end “window dressing” games provided volatility and some surprise reversals late in the session.
Key Positive Trades
1. Morning Long Trigger – 6905.25 ES Breakout (Triggered ~8:09 AM):
-
Setup: Manny’s trade plan identified a continuation long above 6905.25 ES.
-
Execution: Triggered cleanly, and Manny grabbed +5 points at first target. While adds weren’t filled, he extended his runner and scaled out into higher targets.
-
Lesson: Stick to the plan, even on a “light risk” Friday — patience paid off.
2. 6888-90 ES Support Play (Triggered ~10:43 AM):
-
Setup: Price dipped below 6888 but failed to push lower. A reclaim confirmed strength.
-
Result: Manny capitalized with another +5 points as momo surged. David missed the entry due to connection loss, but trade validated the setup.
-
Lesson: Importance of clear structure and precise trigger timing, especially on second tests.
3. Afternoon Long – Flush and Reclaim at 6851 ES (Triggered ~2:06 PM):
-
Setup: Flush below key 6851 level followed by immediate reclaim and delta shift.
-
Execution: Manny entered around 6861 on the 2pm candle and aimed for targets into 6875.
-
Lesson: Classic afternoon reversal structure — recognizing high-probability setups late in the day can provide clean moves, especially during “markup periods.”
Market Behavior & Strategy Notes
-
Cycle Day 1: Largely followed “normal” expectations, with clean structure in both the upside squeeze and later-day distribution.
-
Key Levels:
-
6885 – Critical LIS tested repeatedly throughout the day.
-
6855–6860 – Bearish target zone from DTS hit by midday, then reversed.
-
6840–6837 – Gap fill noted and nearly reached.
-
-
Options Landscape: Heavy put concentrations around 6885 ES → 6915 provided fuel for early squeeze attempts.
Lessons & Takeaways
-
“Don’t press on a FRYday” – Manny reminded the room of his “small ball” approach and stayed disciplined, which paid off.
-
Capital Preservation Mode – Reinforced by David; only take setups that align with dominant force.
-
Trade Management Focus: Manny highlighted he’s working on more efficient runner management to avoid leaving gains on the table — a reminder to refine exits.
-
Window Dressing Impact: The last two hours showed classic markup activity, culminating in a $2.9B MOC buy imbalance, which quickly flipped to $2B sell — a stark reminder of how institutions manipulate price into the close.
Final Thought:
A great example of what disciplined, structure-based trading looks like — especially on a Friday. The room captured multiple high-quality setups without overtrading. Clear levels, precise timing, and sound risk management turned this “Fryday” into a productive and educational close to the month.
DTG Room Preview – Monday, November 3, 2025
-
Time Shift Reminder: The U.S. returned to Standard Time this weekend—U.S. market opens will feel one hour earlier for most non-U.S. traders.
-
October Market Recap: Strong month for equities—S&P 500 +2.3%, Dow +2.5%, Nasdaq +4.7%. AI stocks and the “Mag 7” led gains. Optimism around U.S.-China trade relations also supported markets.
-
Government Shutdown Update: Now entering its second month. Delays to economic data persist, including a potential delay to the October jobs report. Funding expires November 21. GOP faces internal conflict and public backlash, with polls showing Americans blaming Republicans for the gridlock.
-
Supreme Court Spotlight: A hearing is set for Wednesday on the legality of Trump-era reciprocal tariffs—Trump calls it a historic decision but will not attend in person.
-
Earnings in Focus: AI names like PLTR, AMD, SMCI, and CEG report this week. Key premarket earnings: ARES, BNTX, IDXX, ON, RYAAY. Post-close: BWXT, FANG, PLTR, CLX, VRTX, WMB, and others.
-
Today’s Economic Calendar:
-
S&P Global Manufacturing PMI (9:45am ET)
-
ISM Manufacturing PMI & Prices (10:00am ET)
-
Fed Speakers: Daly (12:00pm ET), Cook (2:00pm ET)
-
-
Volatility Watch: Elevated but steady; ES 5-day ADR at 76 points. Light overnight volume = no whale bias.
-
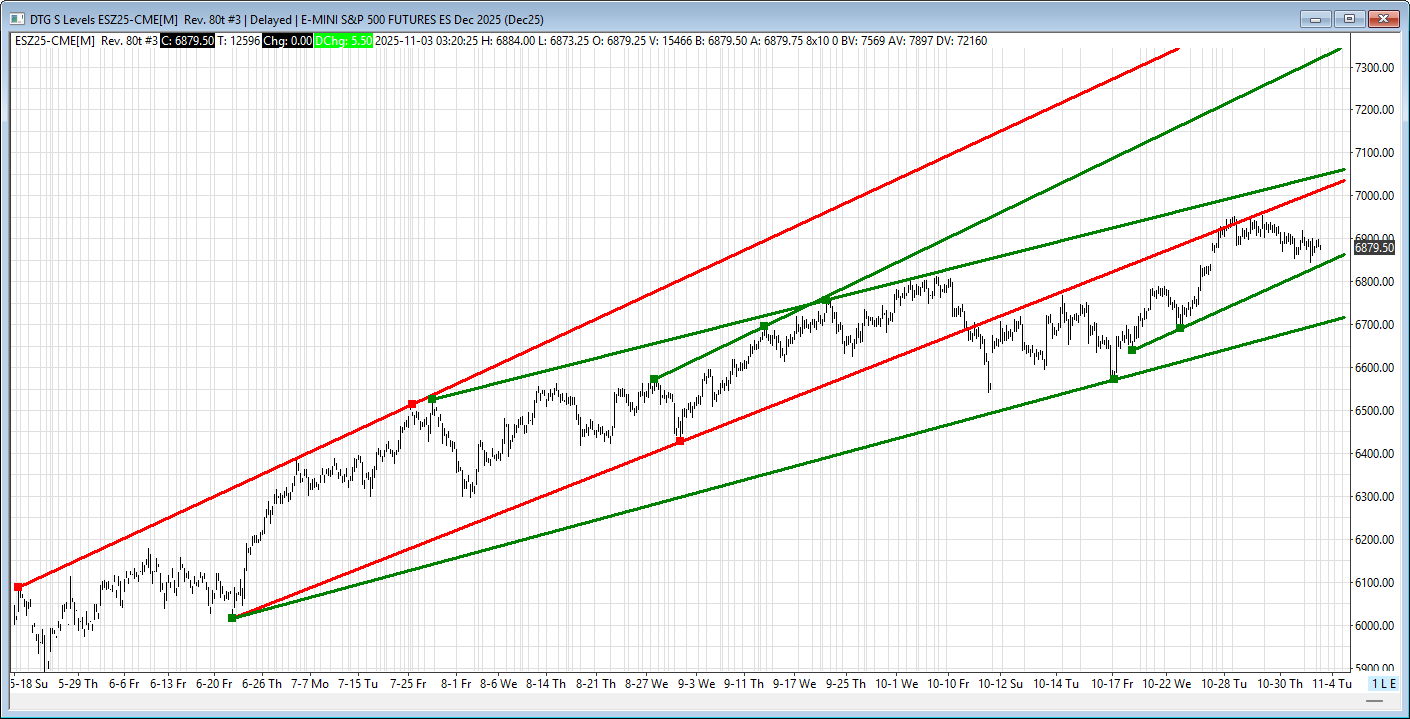
Tech Levels (ES Futures):
-
Support: 6840/43, 6712/17
-
Resistance: 7026/31, 7052/57, 7350/55
-
Short-term uptrend channels still intact; bulls have room to maneuver.
-
Affiliate Disclosure: This newsletter may contain affiliate links, which means we may earn a commission if you click through and make a purchase. This comes at no additional cost to you and helps us continue providing valuable content. We only recommend products or services we genuinely believe in. Thank you for your support!
Disclaimer: Charts and analysis are for discussion and education purposes only. I am not a financial advisor, do not give financial advice and am not recommending the buying or selling of any security.
Remember: Not all setups will trigger. Not all setups will be profitable. Not all setups should be taken. These are simply the setups that I have put together for years on my own and what I watch as part of my own “game plan” coming into each day. Good luck!
This post goes out as an email to our subscribers every day and is posted for free here around 2 PM ET. To get your real-time copy, sign up for the free or premium version here: Opening Print Subscribe.
Comments are closed