Short the rallys for the next few days.
Follow @MrTopStep on Twitter and please share if you find our work valuable!
Every week, MrTopStep invites traders to an “Own the Close” contest where the closest guesstimate where the SPX will settle on Friday’s 4:00 cash close.
The winners get a free week’s access to the MrTopStep Chat and trading tools. Enter your guess now!
Our View
There are a couple of things that were working against the bears yesterday, the biotech sector jumped after Viking Therapeutics rallied 121% as the weight-loss drug beat out Lilly’s Zepbound, Netflix closed above $600.00 and volumes across all the indices were low, only 982,000 ES futures traded and lastly the ES held its supports are the 5060-5070. While the stats for the last week of February are seasonally weak Friday’s stats are the weakest.
Our Lean
Simple today. Buy the open and sell and 10 to 20 point rallies
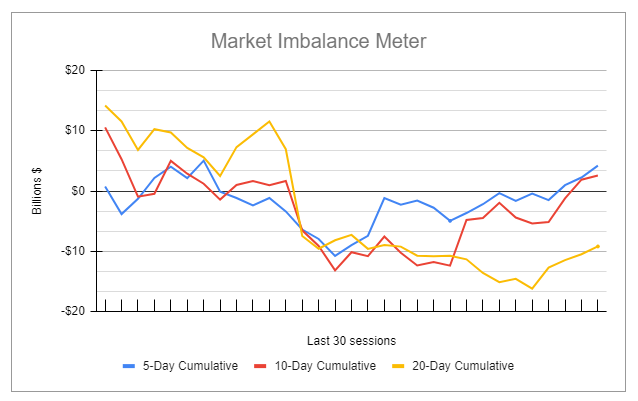
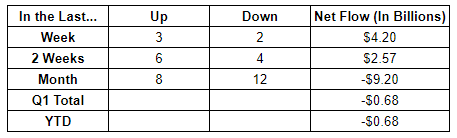
MiM and Daily Recap
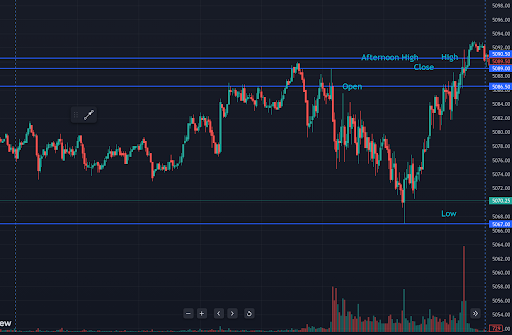
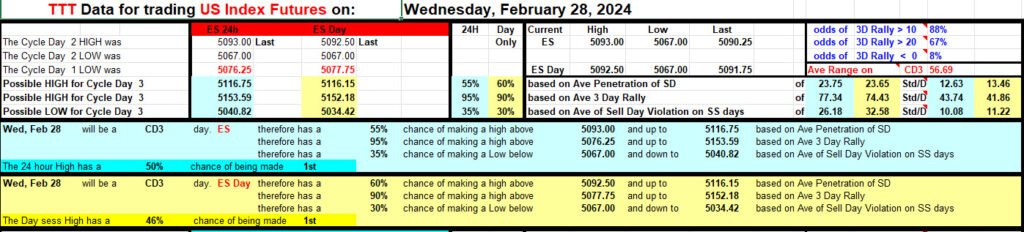
The ES market displayed resilience yesterday, carving out a range of 26 points. The session opened at 5077.50, with a bearish undertone quickly moving lower. The intraday low was established during the 13:00 hour at 5067.00, from which a robust rally ensued, pushing the prices higher into the close. A strong rejection at that point sent the market back higher, hesitating around the opening price at approximately 14:55. The ES managed to regain its footing around 15:40, culminating in a modest yet positive close at 5090.00, up 9.75 points or 0.19%. The closing 5-minute candle also put in the afternoon high and the high of the day.
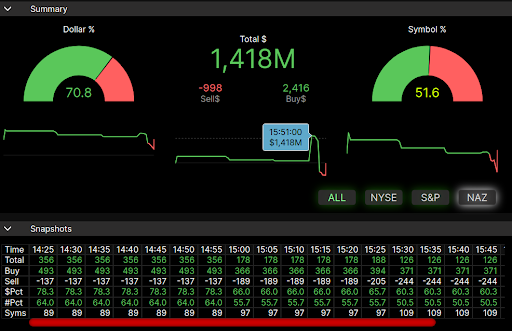
Market on Close (MOC) data indicated initial bullishness with an early excess of $356 million to the buy-side, although this did not signify broad market support due to a lack of significant symbol lean. Ultimately, the buy-side momentum intensified, reaching a substantial $1.4 billion. However, this was counterbalanced by Dquotes selling into the MOC and reversing it at 15:55, which failed to impede the market’s strong finish on the closing candle. Despite the absence of broad participation, the market managed to conclude the session on a positive note, reflecting a certain degree of underlying buying pressure.
For more info on accessing the MIM, please visit here.
MTS Levels:
HandelStats Levels:
$ES Currently trading 5073.50.
Upside:
-
Trade above 5068.75 targets 5078.12 , 5082.88, 5088.25.
-
Trade above 5088.25 targets settlement 5091.75.
-
Trade and hourly close above there targets 5102.50
-
Trade and hourly close above there targets 1sd 5121.73
-
Trade above there targets 5132.06 then 2sd 5151.72.
Downside:
-
Trade and hourly close below 5068 targets -1sd 5061.77,
-
Trade below there targets 5058.50 then 5046,5033.50, -2sd 5031.78.
-
Below there targets -1sd weekly 5027.22
-
Hourly close below there targets 5009.12, -3sd 5001.80
Guest Post
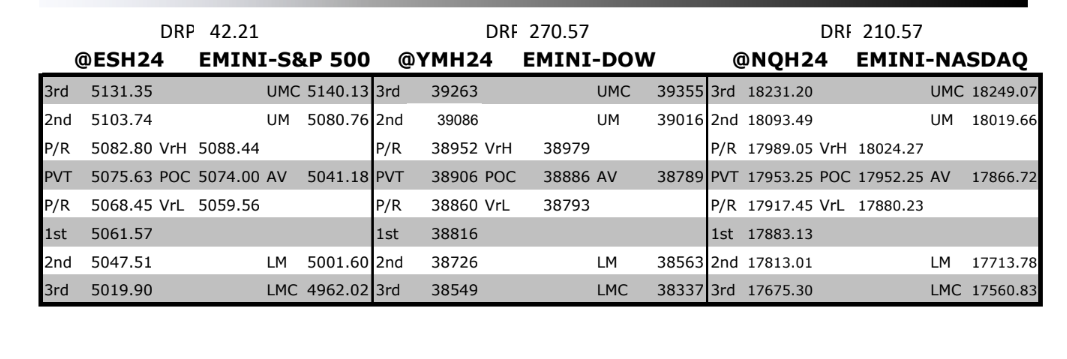
Topic: Taylor 3 Day Cycle
Author: David D Dube’ (a.k.a. PTGDavid)
Website: https://polaristradinggroup.com/
Prior Session was Cycle Day 2 (Sell Day): Normal CD2 as price action was lethargic most of the session, as light but consistent downside pressure tested 5070 – 5065 lower target/reversal zone, as outlined in prior DTS Briefing 2.27.28. Responsive buyers were active and strong enough to reverse price direction, closing right back to 5090 as outlined. Overall, this session was a “textbook” Cycle Day 2 (Sell Day). Prior range was 26 handles on 976k contracts exchanged.
…Transition from Cycle Day 2 to Cycle Day 3
This leads us into Cycle Day 3 (Sell Short Day): Rally from key support low (5067) recovered price back to 5090 Weekly Line in the Sand (LIS). This level marks a DECISION POINT (DP) in PTG’s estimation for control, which still favors bulls, though we will as always follow our daily trade plan. Stay flexible and in-alignment with the primary intra-day forces. As such, scenarios to consider for today’s trading.
Bull Scenario: Price sustains a bid above 5090, initially targets 5105 – 5110 zone.
Bear Scenario: Price sustains an offer below 5090, initially targets 5075 – 5070 zone.
PVA High Edge = 5085 PVA Low Edge = 5075 Prior POC = 5078
*****The 3 Day Cycle has a 90% probability of fulfilling Positive Cycle Statistics covering 12 years of recorded tracking history.
For more detailed information for both bullish and bearish projected targets, please visit: PTG 3 Day Cycle and/or reference the Cycle Spreadsheet below:
Link to access full Cycle Spreadsheet > > Cycle Day 3 (CD3)
Thanks for reading,
PTGDavid
Economic Calendar
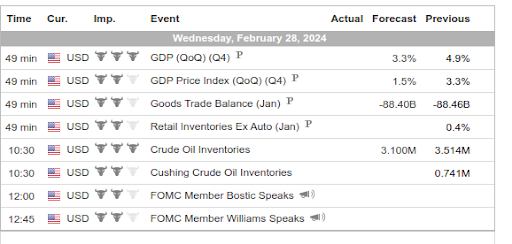
For a more complete Economic Calendar see: https://mrtopstep.com/economic-calendar/
Comments are closed