Shorts Keep on Getting Burned
It’s another options FRY-day
Follow @MrTopStep on Twitter and please share if you find our work valuable.
Every week, MrTopStep invites traders to an “Own the Close” contest where the closest guesstimate where the SPX will settle on Friday’s 4:00 cash close.
The winners get a free week’s access to the MrTopStep Chat and trading tools. Enter your guess now!
Our View
What’s the old saying…fool me once, shame on you; fool me twice, shame on me.
That’s how this works with shorting in low-volume environments.
I’m going to keep this short — the shorts got screwed again!!
Our Lean
At least for now, the bears are leading a painful life. Today there are four economic reports and six Fed governors speaking, so there should be lots of headlines.
That said, my lean is to buy any 20+ points pullbacks. That doesn’t mean I won’t sell a rip if I see the right setup, but I think we see higher prices for today FRYday option expiration.
MrTopStep Levels
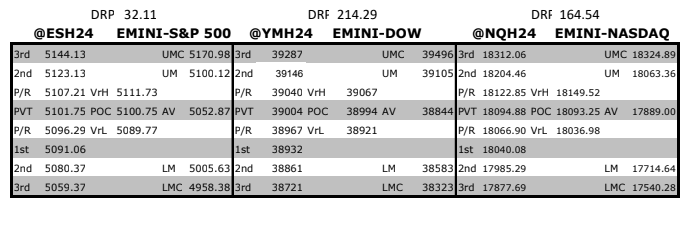
Some examples trade ideas using today’s MTS Levels:
-
If the price drops below 5071.17 (1st support level):
-
This could be a signal that the market is entering a bearish phase. Consider shorting the EMINI-S&P 500 with a target of 5057.03 (2nd support level). Place a stop-loss just above 5071.17 to limit potential losses if the market reverses.
-
-
If the price exceeds 5113.59 (2nd resistance level):
-
This might indicate bullish momentum. Consider going long with an initial target of 5141.37 (3rd resistance level). A stop-loss could be set just below 5113.59 to protect against unexpected downturns.
-
MiM and Daily Recap
ES Recap
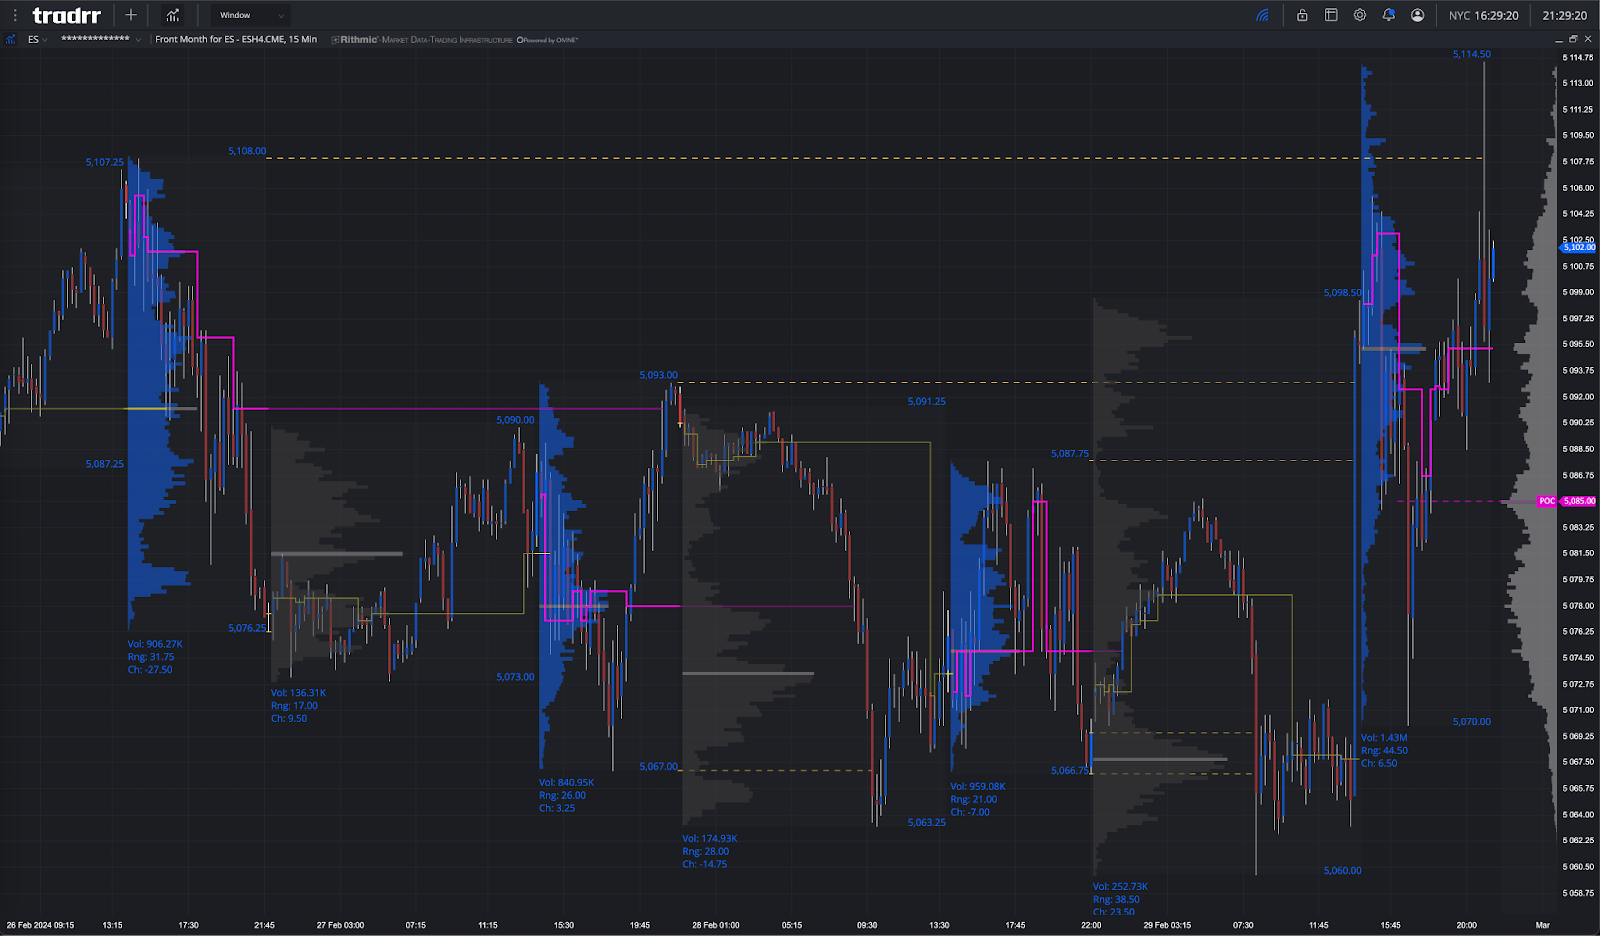
The ES sold off down to support at 5060.00 and rallied up to 5000.50 9:15 a.m. after the PCE report increased 0.4% for the month and 2.8% from a year ago — both in-line — and opened Thursday’s regular session at 5097.75. After the open, the ES traded up to 5005.50 and then fell into a 5-point back-and-fill until 10:02 when an algo hit and the futures and the ES dropped straight down to 5084.50 at 10:14. From there, it rallied up to 5095.25 and then back-and-filled just above the VWAP until 10:48 and then stutter-stepped down to 5083.00 at 11:36, then dropped 14 points down to the support I talked about all week at the ~5060-70 level at 11:41.
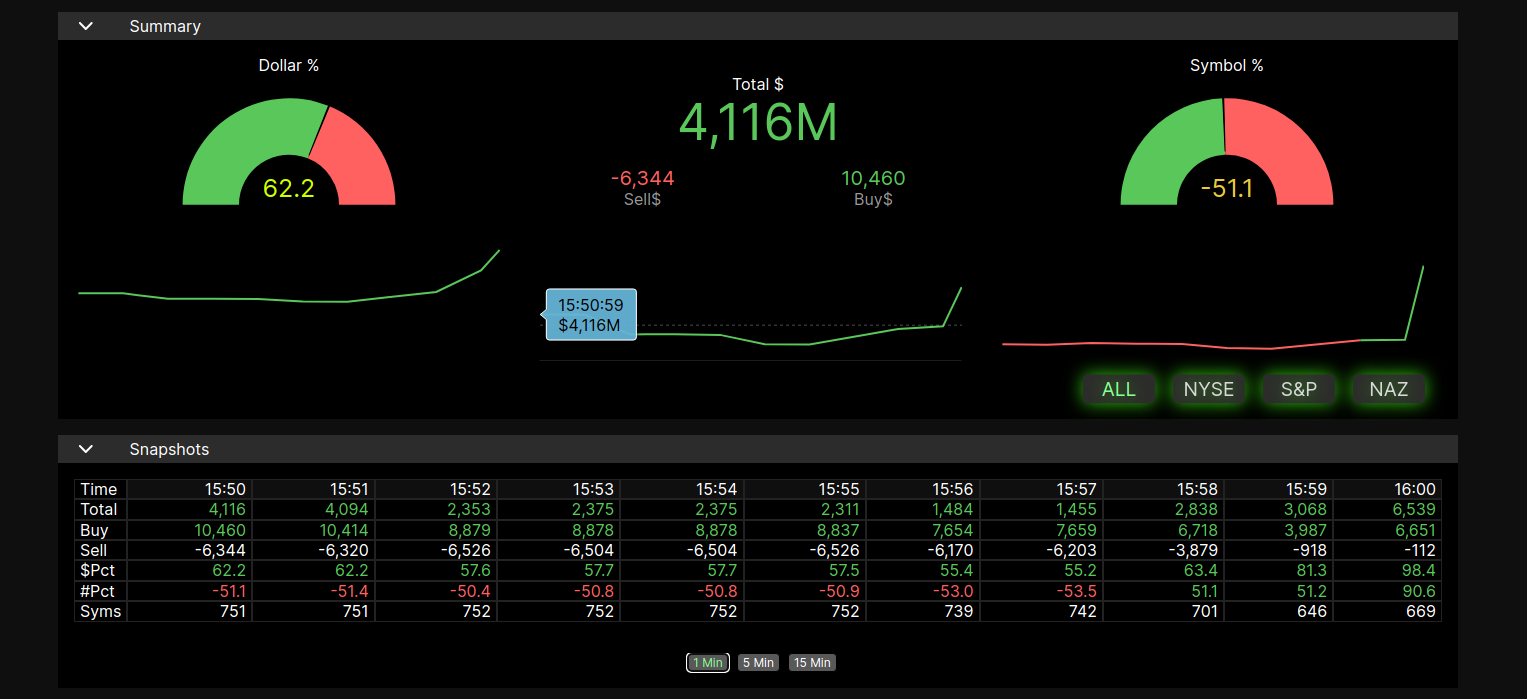
After the low, the ES slowly rallied up to 5088.25, pulled back to 5081.75 at 12:31 and then started grinding higher up to the 5100.00 level at 2:33. After the high, the ES pulled back to the 5088.50 level at 2:47. It was that low that set up the late rip as the ES traded up to a new high at 5007.25 and traded 5105.00 as the 3:50 cash imbalance showed $4.1 billion to buy and rallied all the way up to 5114.50 at 3:58 and traded 5096.75 on the 4:00 cash close and settled at 5100.00, up 22.75 points or 0.45% on the day.
Here’s a look at some of my posts in the MTS chat room throughout the day.
-
IMPRO : Dboy : (9:55:35 AM) : everything is set up off the shorts
-
IMPRO : Dboy : (9:55:52 AM) : public falls for this bs every time
-
IMPRO : Dboy : (9:39:57 AM) : not really going down
-
IMPRO: Dboy: (9:44 AM): again the ES took bad news and made good of it
-
IMPRO : Dboy : (1:33:44 PM) : I don’t think we are going back to 5070
-
IMPRO : Dboy : (1:34:41 PM) : I think the idea now is to buy weakness and look for a FRYday, first trading day of March push higher
-
IMPRO : Dboy : (1:37:29 PM) : they have not fully bonked the shorts yet but we get back above 5098 I think we go to 5112
-
IMPRO : Dboy : (1:55:57 PM) : stop run coming
-
IMPRO : Dboy : (2:14:04 PM) : I think they run the upside stops
-
IMPRO : Dboy : (2:20:16 PM) : going to pop again
-
IMPRO : Dboy : (2:20:51 PM) : not sure how far it goes, 5115-20 would be an extreme
In the end, the ES did what it does best — it took bad news and made good of it. In terms of the ES’s overall tone, it acted firm all day. In terms of the ES’s overall trade, volume was higher: 314k traded on Globex and 1.347 million traded on the day session for a total of 1.66 million contracts traded.
Technical Edge
-
NYSE Breadth: 67% Upside Volume
-
Nasdaq Breadth: 57% Upside Volume
-
Advance/Decline: 69% Advance
-
VIX: ~13.50
Guest Post
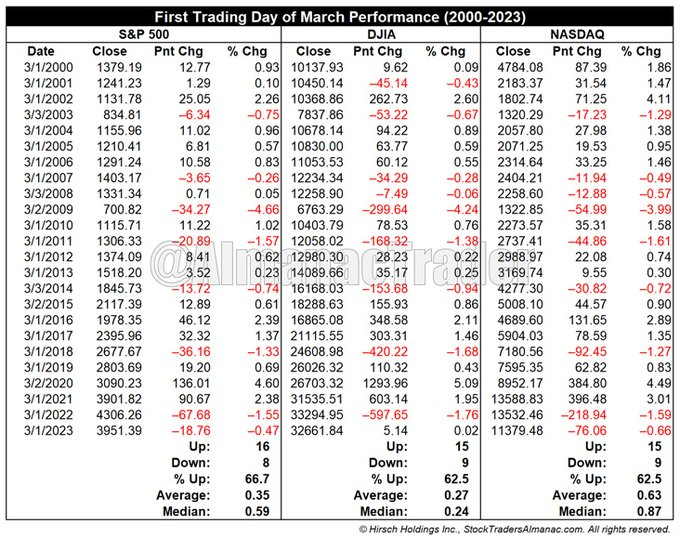
This is a post by Jeff Hirsch from the Stock Trader’s Almanac. The full post can be found here.
First trading days of months have a bullish reputation and March is not an exception. Reviewing the last 24 years of data reveals S&P 500 has the best record, advancing 66.7% of the time with an average gain of 0.35%. NASDAQ is second best based upon frequency of gains, up 62.5% of the time examined with an impressive 0.63% average gain. DJIA has been modestly softer, also up 62.5% of the time with an average advance of 0.27%.
March’s first trading day strength has not been limited to just the last 24 years. Since 1950, DJIA has advanced 50 times in 74 years (67.6%) with an average gain of 0.23%. S&P 500 has been nearly as consistent, up 63.5% with an average gain of 0.24%. NASDAQ has also been a solid performer since 1971, up 33 times in 53 years (62.3%) with a respectable 0.35% average.
Spot Gamma
SpotGamma is one the the shining stars of the options markets. If you have never heard of them or already know of them and have never signed up for their options flow products or the SG Academy, I fully suggest you check them out and add them to your trader’s toolbox.
Here’s a snippet from them:

Structurally, history was made today with the Put Wall moving up to 5040 (in itself this is bullish). This is forty points higher than it has ever been. The VT is then five points above it at 5045. The nature of recent conditions has been put gamma creeping up to very high strikes, which is why there has been such a narrow safety buffer. What helps regarding structural clarity here is to see the Put Wall right next to the VT, as a form of double-ply support so to say (like two boards as support instead of one). This distinctly points to a safety boundary, hovering around that visually-straightforward minor support at 5050 and major support at 5000. Round numbers like that are not automatically strong support, but in this case our models show that they are.
Economic Calendar
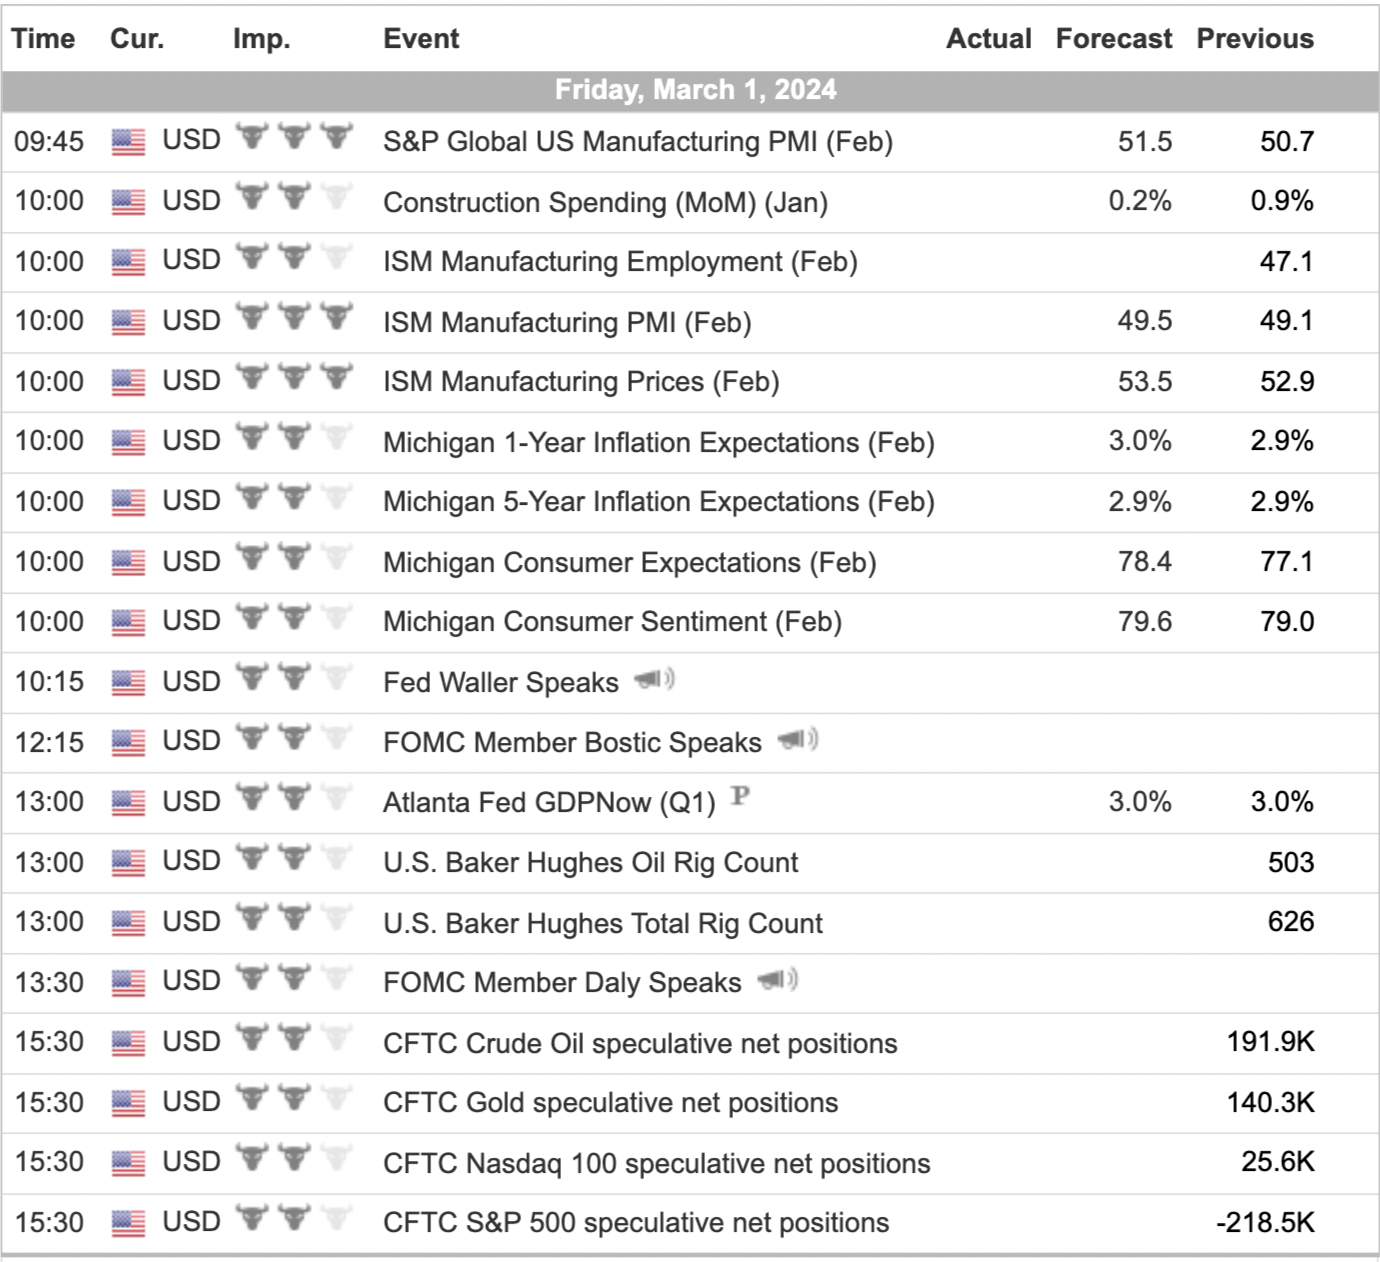
For a more complete Economic Calendar see: https://mrtopstep.com/economic-calendar/
Comments are closed