Some Weakness Isn’t Unreasonable
But I’m not saying we’ll crash.
Follow @MrTopStep on Twitter and please share if you find our work valuable!
For more info on our traders chat room, click here.
Our View
I do not want to re-explain my bearish February call. I think there is a good possibility that we see some weakness.
I am not saying the ES is going to tank or crash.
What I am saying is, there could and should be some down days. The S&P is up in 13 of the last 14 weeks. Some pullbacks here should not be ruled out.
Further, I don’t think ES 5000 to 5020 won’t be so easy. If the ES does rally above there, the higher it goes the greater the chance of pullbacks and selloffs.
That does not mean the ES can’t run to a new high — it most certainly can! — but we are only 4 sessions into the month and I never said it would just unfold right this minute. I’ll put my key levels in the Lean.
I just want to post a note on seasonality, after I ran into a post by Jeff Hirsch of the Stock Trader’s Almanac. Below is an excerpt, while the full post is linked here:
Up January has much more outperformance versus when it’s down than any other month in the year on the following 11-months or 12-months return. Since 1938, when the S&P 500 was up in January the next 11-months average a gain of 11.6%. When January is down, the next 11-months average plummets to just 1.2%.
Our Lean
So the ES went my way in the first part of the day. but like all the pullbacks recently, it didn’t last very long as the buyers stepped in.
As mentioned yesterday, there is a lot of Fed speak this week and there should be a ton of headlines. I’m sticking to my call to sell the rallies and buy the 30 to 50-point pullbacks with the idea we are going lower.
My key levels include:
Trading range for today: 4936 – 4972.
Below 4936: 4920, 4890, 4872, 4860, 4845, 4812, 4786, 4772, 4755, 4735
Above 4978: 5002, 5037
MiM and Daily Recap
ES recap
The ES traded down to 4963.25 on Globex and opened Monday’s regular session at 4973.00. After the open, the ES sold off down to 4963.75 at 9:32 and then fell into a 4- to 6-point back-and-fill and then sold off down to 4942.75 at 10:19. From there, it stutter-stepped up a 4950.50 triple top at 10:40, and then dropped down to a new daily low at 4937.75 at 10:45. After the low, the ES rallied all the way up to 4970.00 at 12:46, pulled back to the VWAP at 1:34, rallied up to a 4971.25 high, sold off down to 4961.50 at 1:34 and then back-and-filled in a 4 to 5 point range from 4963.00 to 4968.00 for the next 40 minutes.
From there, it rallied up to 4977.50 at 2:50, sold off down to 4961.50 at 3:17, traded up to 4975.25 at 3:36 and then traded down to 4965.75 at 3:45 and traded 4967.00 as the 3:50 cash imbalance showed $1.9 billion to buy and traded 4961 on the 4:00 cash close. After 4:00, the ES sold off down to 4955.50 at 4:01 and settled at 4960.25 on the 5:00 cash close, down 12.5 points or -0.25% on the day. The NQ closed up 16 points at 17,720.50 or up 0.09%.
In the end, the bears won in the first part of the day, and the bulls won in the second part. In terms of the ES’s overall tone, I think the best way to describe it was “mixed.” In terms of the ES’s overall volume, a total of 235k traded on Globex and 1.192 million traded on the day session for a total of 1.427 million contracts traded.
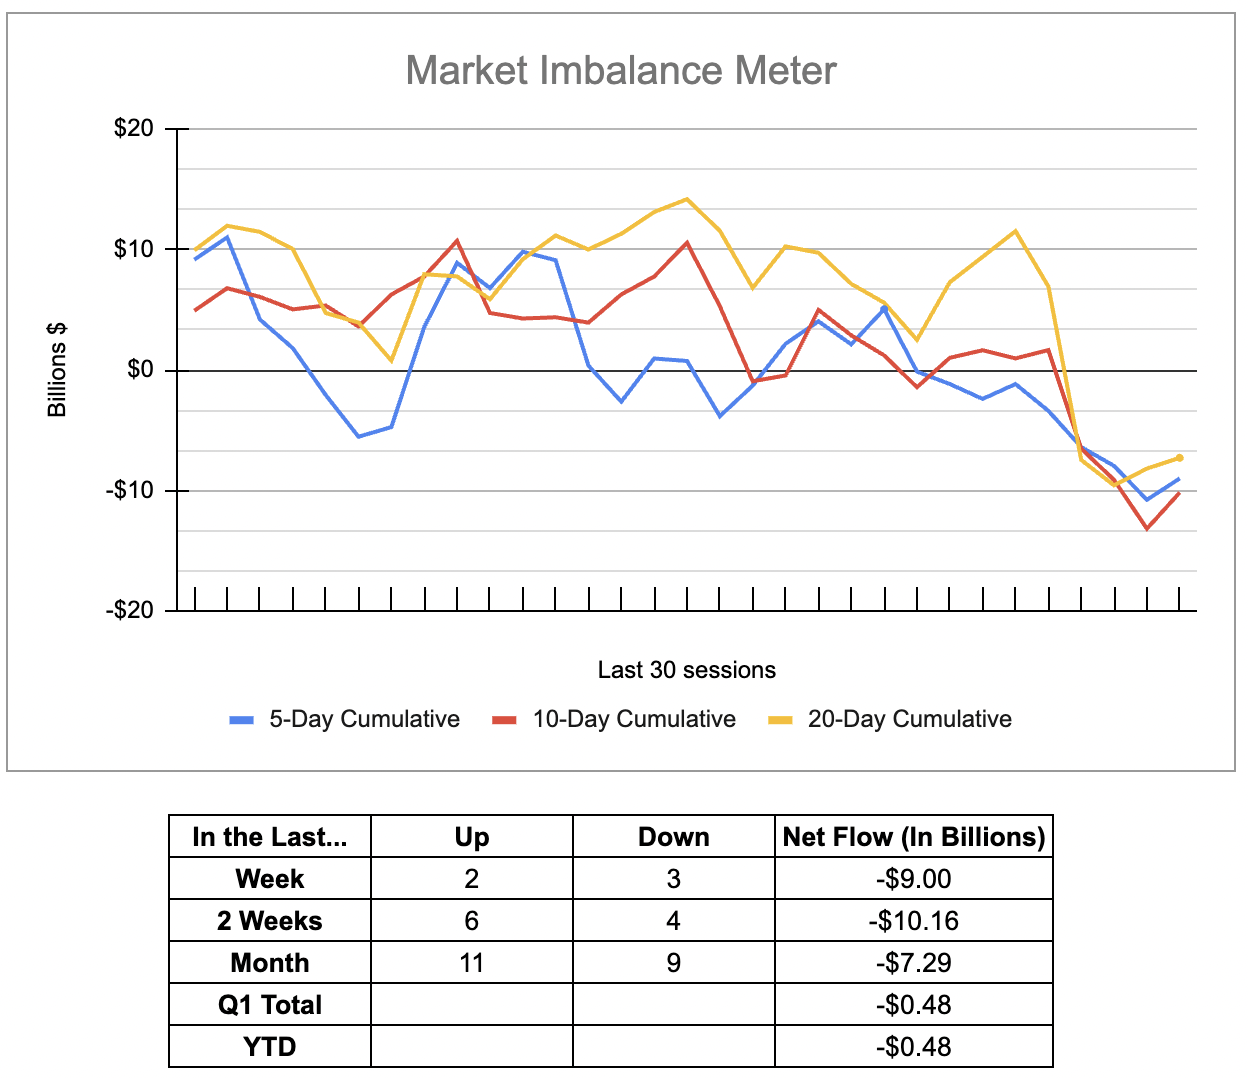
For more info on accessing the MIM, please visit here.
Technical Edge
-
NYSE Breadth: 15% Upside Volume (!)
-
Nasdaq Breadth: 35% Upside Volume
-
Advance/Decline: 17% Advance
-
VIX: ~13.50
-
Little vol crush despite yesterday’s dip
-
ES
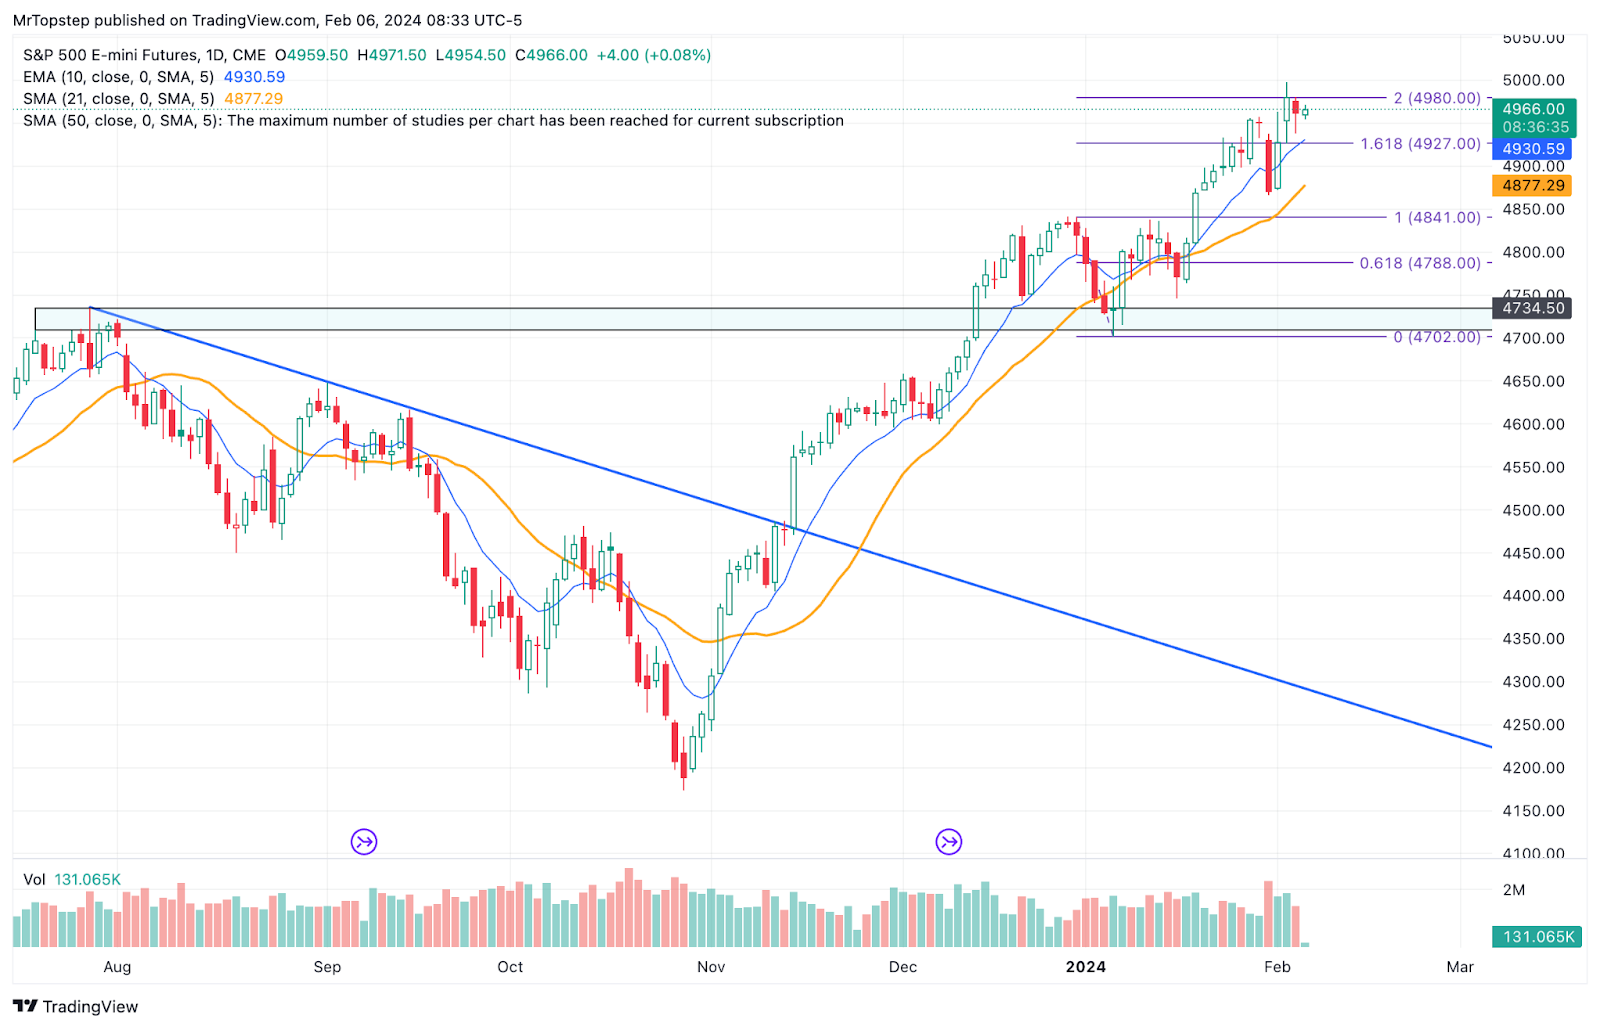
ES Daily
Trading range for today: 4936 – 4972.
Below 4936: 4920, 4890, 4872, 4860, 4845, 4812, 4786, 4772, 4755, 4735
Above 4978: 5002, 5037
Guest Post
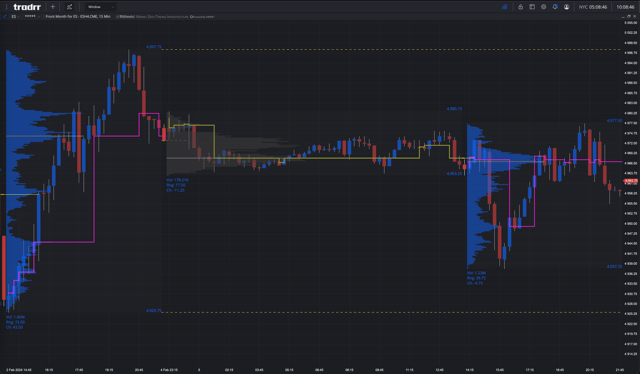
Niels from Tradrr
US 3-Year Auction to occur during the lunch doldrums 13:00 Est, Alongside the rise in index futures we’ve had a rise of the US 2-year Yield going from 4.1 as of the close of last Monday towards this weeks close at 4.27.
With large activity last week around FOMC with participants placing their bets on rate cuts in march only to have it dashed by Powell comments and looking forward to attempts for May potentially starting the drift down into the current week and maintaining the POC higher.

Breaking us lower from section 1 we gain an attempt to consolidate prices on Friday in section 2 with potential of being our balance zone should participants attempt to bring up prices as they await more information regarding May.
Closing the session on Monday following Powell’s airing of 60 minutes Sunday leaves it all with a wait and see following FOMC into the March meeting, giving an expectation to balance and digest with current lows ideally protected and section 2 the location for the balancing act with spikes to be expected coming from the 13:00 auction.
Considering as well with 10-Year auction on Wednesday and 30-year auction Thursday and the sprinkling of Fed speakers throughout the week.
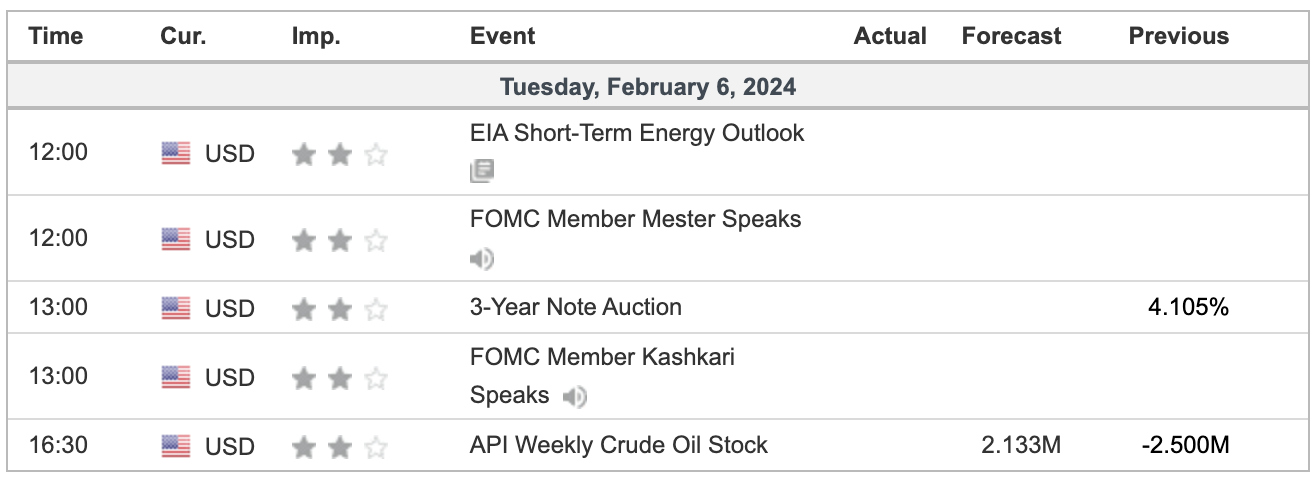
Economic Calendar
Comments are closed