This post goes out as an email to our subscribers every day and is posted for free here around 2 PM ET. To get your real-time copy, sign up for the free or premium version here: Opening Print Subscribe.
S&P 500: Best Day Since March 2020, All Part of the Plan – Resend
Follow @MrTopStep on Twitter and please share if you find our work valuable!
Our View
What happened in the ES yesterday? Just a 100-point drop and a 100-point rally, that’s all. Well, not really—there were several rips and dips. One was down to 5511 at 1:15 and traded back up to the 5572.00 level at 2:05. The ranges we are now seeing in one day are crazy. It used to take months to move the ES 200 points, and now it’s a standard affair, a daily occurrence.
When you’re this close to the action, you really don’t need the TV yapping. I purposely do not watch the TV financial channels because I get all the news from LiveSquawk, my phone, the internet, and the MTS chat room. That’s more than enough information. I don’t know if it’s because I’m older, but the way I see it… less is better.
At 2:25, the ES traded down to the 5532.00 level and then up to 5550.50 at 3:15. This is the time of day the rebalancing kicks into gear. The ES rocketed up to 5599.00 after the imbalance showed 45.5 billion to buy. The boys with the better seats started buying after 3:00 and into 3:25, and the ES hit 5606.75, and the NQ hit 19635 and both took off from there. There is no way someone didn’t know. I get it—there are computers that are timed to buy or sell—but someone bought a lot of futures.
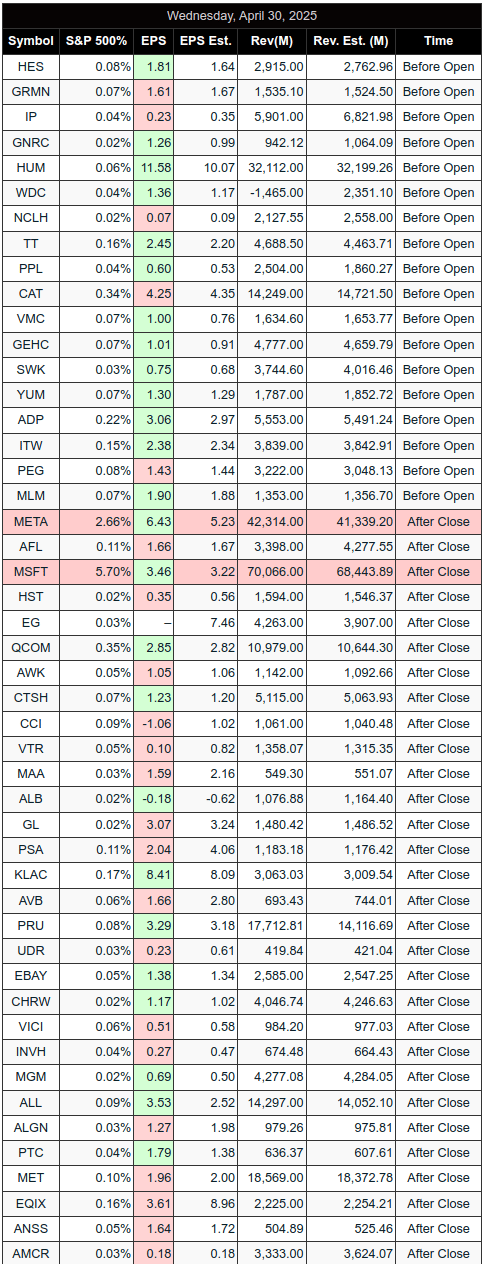
The ES sold off to the 5570 level and popped back up to a new high after MSFT and META beat earnings expectations, pushing the ES up to 5616.50. I’m done. I said this would be happening last week, and I even said the ES would make new highs into tech earnings.
I told the traders:
IMPRO : Dboy : (3:11:31 PM) : the boys with the better seats are going through the turnstiles, paid 5544.5 on 2 es
IMPRO : Dboy : (3:11:45 PM) : right now
IMPRO : Dboy : (3:12:23 PM) : nhotc = new highs on the close
IMPRO : Dboy : (12:07:19 PM) : end of the month rebalance is buying stocks
I even suggested buying 0DTE options late in the day. I think what it proved—and I saw it early—is that the trend was still intact, with sellers taking over for 2 hours. I know some of you say I’m full of it about the late-day front-running, but yesterday it was like clockwork: buying within the hour-of-power buy program that saw a $5.5 billion to buy on the 3:50 imbalance and a push up to 5626.25 at 4:40.
The ES has rallied 511.25 points off its 5127.75 low and has been high seven sessions in a row.
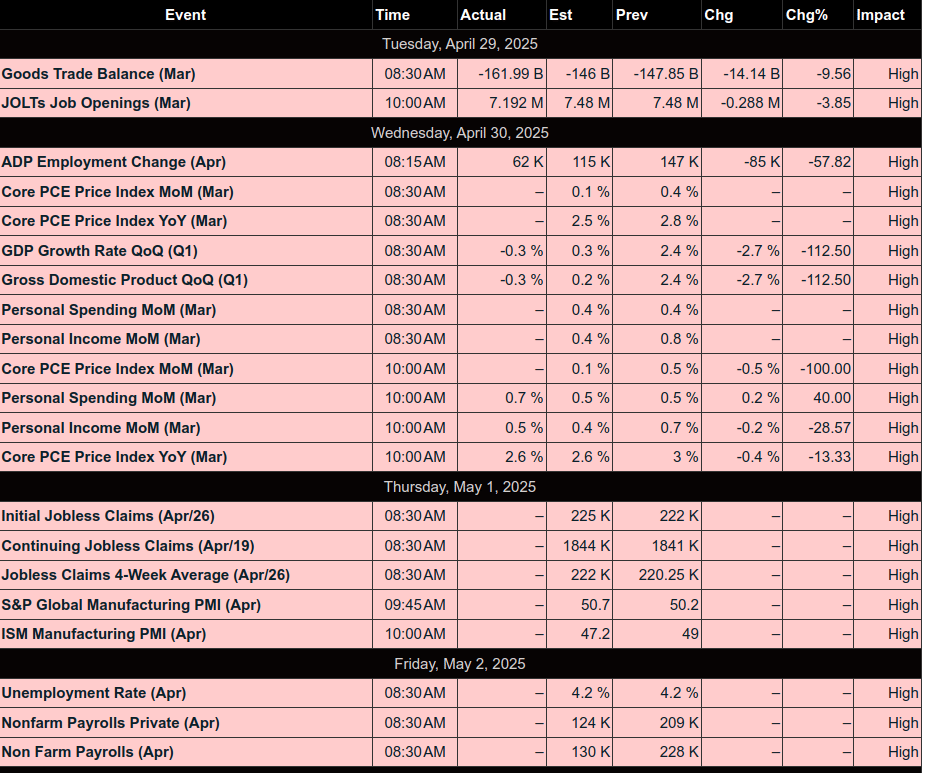
Yesterday was another master blaster day. The ES was up six days in a row, got hit by overnight selling, and then hit again after the gross domestic product report showed a 0.3% contraction vs. expectations of +0.3%, and consumer spending—which accounts for over two-thirds of economic activity—showed a 0.7% jump, topping expectations of +0.5%.
I was never really big on posting economic reports, but I think they’ve become front and center. A broker told me today the Fed is going to cut interest rates in May, but the odds of a Federal Reserve rate cut in May 2025 are low, based on recent market data and sentiment. According to the CME FedWatch Tool, as of late April 2025, there is approximately a 10–15% chance of a 25-basis-point rate cut at the May 7 meeting, with an 85–90% probability of rates remaining unchanged at 4.25% to 4.50%. Polymarket traders also indicate a high likelihood (around 88–90%) of no change in May.
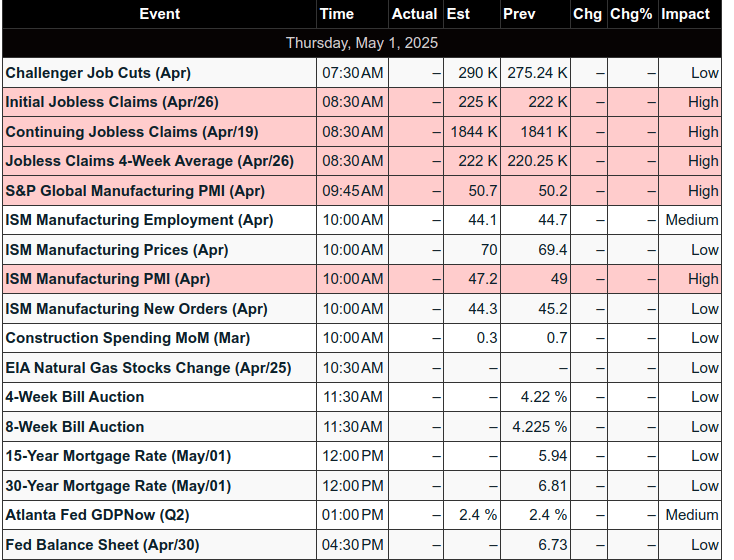
Today is the first trading day of May and we have Trump’s speech, initial jobless claims, PMI, construction spending, ISM, EIA, 4-week bill auction, auto sales, and earnings from Apple, Amazon, and Eli Lilly. (Sorry—we put Apple in for yesterday’s earnings.)
Over the last 27 years (up to 2025), the S&P 500’s performance on May 1 has been positive about 50-60% of the time, with average gains around 0.2-0.3% when positive, though large losses can occur in volatile years. Kind of a mishmash, if I do say so!
Our Lean
I don’t know how the powers that be decide when to buy or sell, but the ES sold off 100 points down to 5455.50 and just traded up to 5639.25 yesterday. That is a 183.75-point rip in 9 hours—that’s a gain of 21.41 points per hour.
Both the YM and ES climbed for seven straight sessions, with the S&P 500 posting its largest percentage gain over that length of time since November 2020.
I got the drop yesterday, but I day trade and the futures were sharply lower before the open and fell after. The longs got washed out and the shorts too—totally smoked. But yesterday’s price action was the same price action we’ve been seeing for the last six sessions: drop and pop.
Our lean: If the ES gaps sharply higher today, I’m going to sell the open or the first rally above the open. If the ES opens down, I think there will be buyers, but I also think the ES needs some downside repair. A good 50 to 100 point drop would do it, and then I’ll start looking for longs again. Going to be whippy…
MiM and Daily Recap
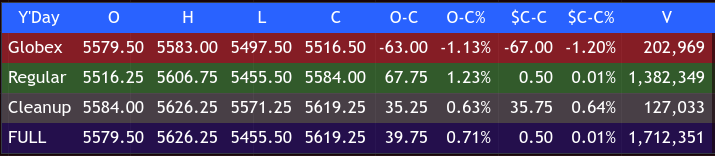
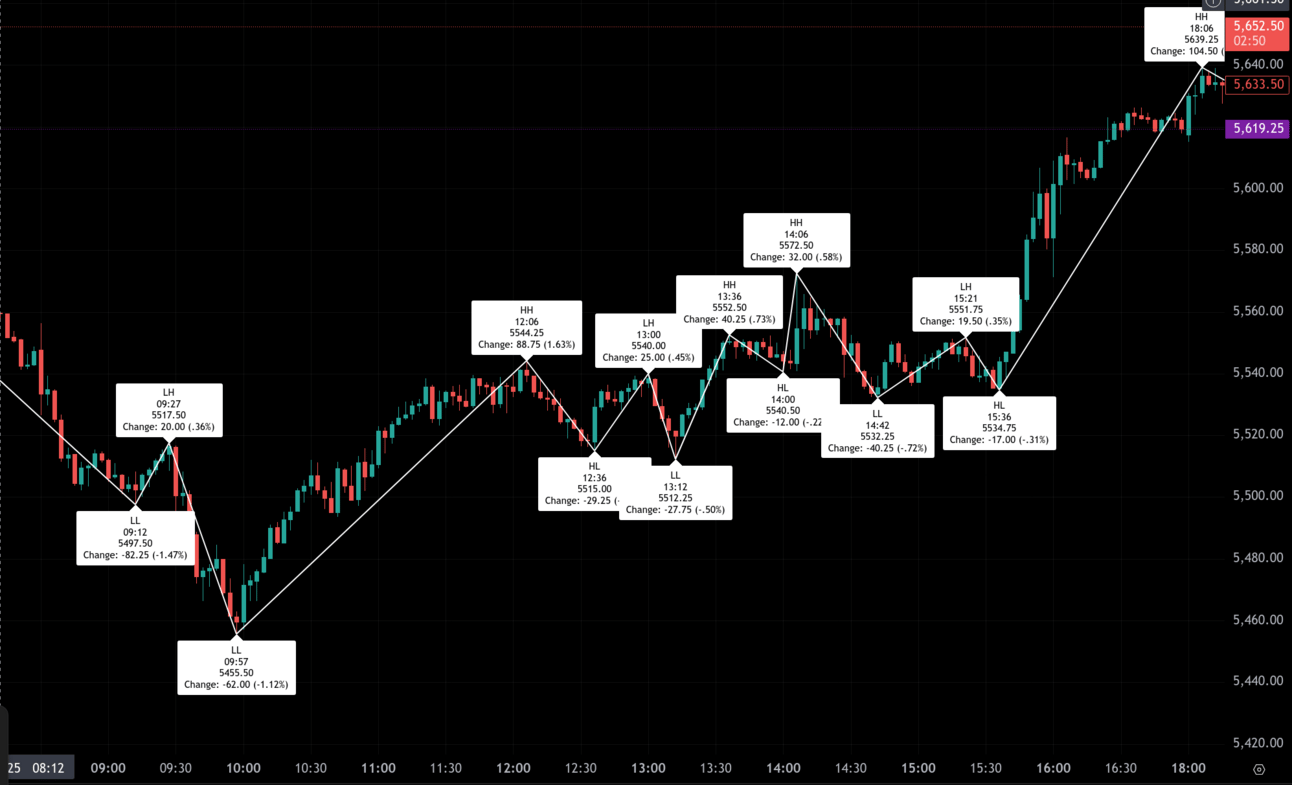
The S&P 500 futures opened the regular session at 5516.25 following a weak overnight performance. During Globex, ES dropped from a high of 5583.00 to a low of 5497.50, settling at 5516.50 for a session loss of 63.00 points or -1.13%. The selling continued into the open with a deeper morning flush that tagged 5455.50 at 9:57 AM, marking the regular session low and a decline of 62.00 points (-1.12%) from the pre-market 9:17 AM setup.
A sharp reversal took hold shortly after, leading to a steady intraday rally. By 12:06 PM, ES reached 5544.25, an 88.75-point rebound (+1.63%) off the morning low. That began the afternoon chopfest as the next uptrend was briefly interrupted with a pullback to 5515.00 at 12:36 PM, followed by a retest lower at 5512.25 at 1:12 PM, confirming a higher low structure intraday.
Bulls regained momentum, pushing the index to 5572.50 at 2:06 PM and then pulling back slightly to 5532.25 -40 points (-.72%) at 2:42 PM. However, this dip proved to be another bear trap as price firmed and reversed higher.
A renewed push in the final hour carried ES to a minor high of 5551.75 at 3:21 PM, then briefly dipped to 5534.75 at 3:36 PM. From there, a decisive surge lifted the market into the close, with prices accelerating upward and culminating at a session high of 5639.25 at 6:06 PM—well into the post-close session. This represented a dramatic 104.50-point spike (+1.88%) from the 3:36 PM low.
The regular session closed at 5584.00, up 67.75 points or 1.23% from the open but just 0.50 points (0.01%) from the prior day’s cash close. Total volume reached 1.71 million contracts on the day.
The market displayed a strong bullish tone through most of the regular session despite early weakness. Buyers aggressively defended lows around 5455.50 and turned the tape upward with persistent demand through the midday and closing sessions. Momentum strengthened significantly in the final 90 minutes, with high-velocity buying pressure evident into the close and cleanup hour.
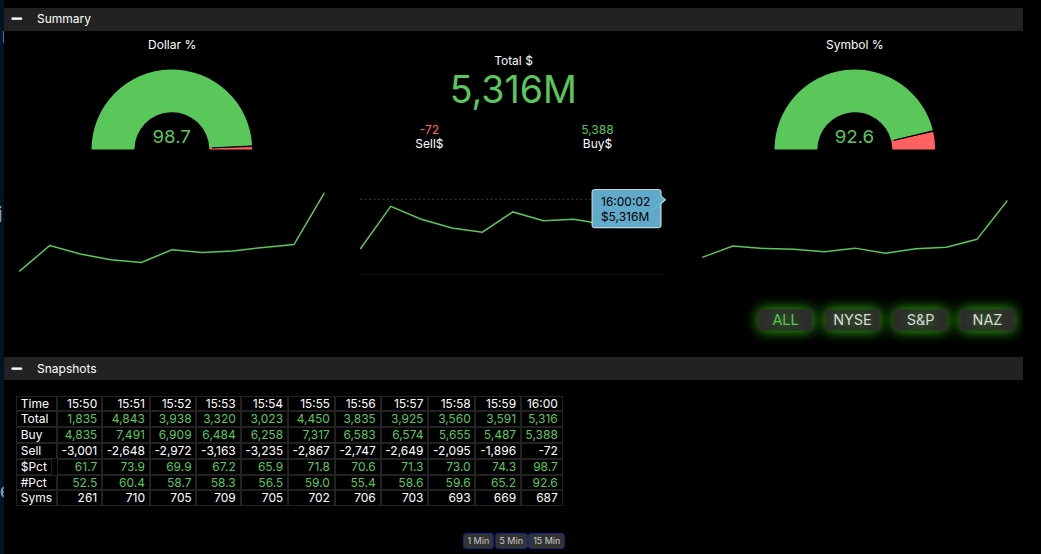
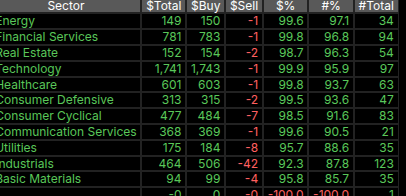
The Market-on-Close imbalance data confirmed the strong finish, with $5.316B in total imbalances and a notable skew: 5,388 symbols on the buy side versus just 72 on the sell, resulting in a symbol imbalance of 92.6% and dollar imbalance of 98.7%. This by far surpassed the ±66% threshold, clearly reinforcing institutional buy interest into the closing bell and likely contributing to the sharp final hour rally.
In summary, despite a volatile overnight and weak open, buyers reasserted dominance during the regular session, driving a reversal that ended with strong upward momentum. The day closed on a high note with aggressive closing flows, setting up potential continuation into the next session.
Technical Edge
Fair Values for May 1, 2025
-
S&P: 24.23
-
NQ: 100.5
-
Dow: 129.42
Daily Breadth Data 📊
For Wednesday, April 30, 2025
-
NYSE Breadth: 41% Upside Volume
-
Nasdaq Breadth: 46% Upside Volume
-
Total Breadth: 46% Upside Volume
-
NYSE Advance/Decline: 44% Advance
-
Nasdaq Advance/Decline: 44% Advance
-
Total Advance/Decline: 44% Advance
-
NYSE New Highs/New Lows: 31 / 29
-
Nasdaq New Highs/New Lows: 82 / 100
-
NYSE TRIN: 1.29
-
Nasdaq TRIN: 0.91
Weekly Breadth Data 📈
For the Week Ending Friday, April 25, 2025
-
NYSE Breadth: 64% Upside Volume
-
Nasdaq Breadth: 68% Upside Volume
-
Total Breadth: 66% Upside Volume
-
NYSE Advance/Decline: 80% Advance
-
Nasdaq Advance/Decline: 79% Advance
-
Total Advance/Decline: 79% Advance
-
NYSE New Highs/New Lows: 65 / 128
-
Nasdaq New Highs/New Lows: 162 / 313
-
NYSE TRIN: 2.31
-
Nasdaq TRIN: 1.73
Guest Posts:
Dan @ GTC Traders
Chip Management in the Current Macro Environment

In Poker, chip management is the discipline of knowing when to bet big, when to fold, and—most crucially—how to stay in the game long enough to win. A skilled player doesn’t treat every hand as a moment to push all-in. Instead, they assess risk, stack size, table position, and opponent behavior to determine how aggressive or conservative to be. It’s not always about playing the cards—it’s about managing the chips.
We would argue that this is precisely what we must do as traders. We don’t get to choose the hand (the macro conditions), but we do get to choose how we allocate capital. In the same way a poker player must think about stack preservation, we must think about exposure, position size, and capital at risk. Trading, like poker, is not about being right on every bet—it’s about staying solvent and engaged long enough to let your edge play out.
And right now? It’s a tricky table. Uncertainty reigns. Communication out of key economic centers remains murky. Tariff structures are being dangled, postponed, and revisited on an almost weekly basis. There is no resolution, only noise. And with that noise comes instability in the normal feedback loops of the market.
This is the type of environment where traditional linear financial models begin to lose meaning. Forward P/E ratios, discounted cash flows, earnings multiples—all of them begin to break down when the numerator (earnings) is a wild guess and the denominator (rates, risk, growth assumptions) is equally unstable. These tools rely on a level of clarity we simply do not have right now. As we’ve said many times: when uncertainty is this high, linear modeling becomes functionally useless.
At the same time, supply chains—across multiple sectors—are beginning to flash mixed signals. It may not be 2021-style congestion, but it’s certainly not smooth sailing either. In a best-case scenario, we’re dealing with disorganization. In a worst-case? Latent pressure building beneath the surface.
So, what do we do in the middle of a confused and increasingly fragile global macroeconomic backdrop?
Let’s bring it back to the present. Following yesterday’s “3:00 PM Portfolio” review, the market ripped higher—once again. It’s become a pattern lately: weakness into the early afternoon, strength into the close. Some will say this is rotation, others will say it’s positioning into data. But for us, the real question is: Do we remove our hedges? Adjust the weighting of our short book? Pull exposure altogether?
These are not decisions to make lightly. We will be considering our moves and announcing them for Premium Members in the next 48 hours.
That’s why we return—again and again—to the idea of chip management. In this type of environment, where clarity is scarce and volatility is increasing, we are continuing to trade as we have been: tactically tight. Smaller position sizes. Tighter risk bands. We are okay being partially invested. We are okay, at times, being completely in cash. We are not here to win the hand—we are here to play the game well.
Importantly, we continue to hold our carry positions. A yield-generating trade that produce small, consistent returns in the background. In a time when directional bets are increasingly difficult, a good carry becomes more valuable. Basis points matter when uncertainty rules.
So the takeaway is not dramatic. It’s disciplined. We aren’t swinging big. We aren’t building a large position just to chase noise. We are managing chips.
Stack preservation matters more than hero calls.
Until next time … stay safe, and trade well.
Trading Room News:
Polaris Trading Group Summary: Wednesday, April 23, 2025
Today’s session in the PTG room was a textbook display of disciplined trade strategy, clear communication from PTGDavid, and precise execution across multiple target zones during a strong Cycle Day 1 decline.
Morning Session:
-
The day began with a quiet overnight trade centered around the 5575 Line in the Sand.
-
PTGDavid highlighted that Cycle Day 1 often favors a decline, and the bearish lean was reinforced by repeated failures of the GBX Open Range.
-
The team executed beautifully as each lower target level was hit in succession:
-
5560 and then 5550 were both fulfilled early, confirming bearish momentum.
-
The “Wabbit Hunt” was called and executed cleanly, hitting 5511.25, described as a “Textbook Liquidity Grab.”
-
The drop continued as targets at 5501, 5492.50, and 5463 were hit one after the other.
-
Notably, the CD1 Deviation Range Projection of 5460–5458 was also fulfilled, culminating in a responsive bounce at 5455, giving traders a signal to begin trailing or covering short positions.
-
Key Lessons & Highlights:
-
Discipline and structure were emphasized throughout, with PTGDavid reminding traders that this is not a 9–5 job and celebrating the “early birds” who capitalized on the setup.
-
Important lesson shared: “Markets never sleep… fish when they’re biting.”
-
Emphasis was placed on not overthinking macroeconomics, like stagflation, and instead focusing on technical signals like DMI Ratios, CCI premiums/discounts, and Bull-Bear Stackers.
Afternoon Session:
-
After a midday lunch break, the market hinted at a possible strong close.
-
A rumor-driven spike tied to U.S.–China tariff talks triggered a sharp move up, which some traders capitalized on.
-
The day ended with what PTGDavid referred to as “window dressing” – a late-day rally wrapping up the month with a ripper.
Final Thoughts:
-
Today’s trading was a masterclass in precision execution on the short side. Levels were clearly defined and hit sequentially, reinforcing the value of David’s strategy outlines.
-
Traders were reminded to stay focused on actionable data, rather than getting lost in theoretical economic debates.
-
The community spirit was strong with plenty of humor, camaraderie, and market insights shared.
DTG Room Preview – Thursday, April 24, 2025
-
Tech Earnings Boost Futures:
-
Microsoft (MSFT) up ~7% after strong Q3 results; Azure revenue rose 20% YoY to $42.2B, with AI contributing 16 points.
-
Meta (META) up over 5% premarket after beating Q1 and raising Q2 guidance; stock is up 25% over the past 12 months.
-
-
Earnings on Deck:
-
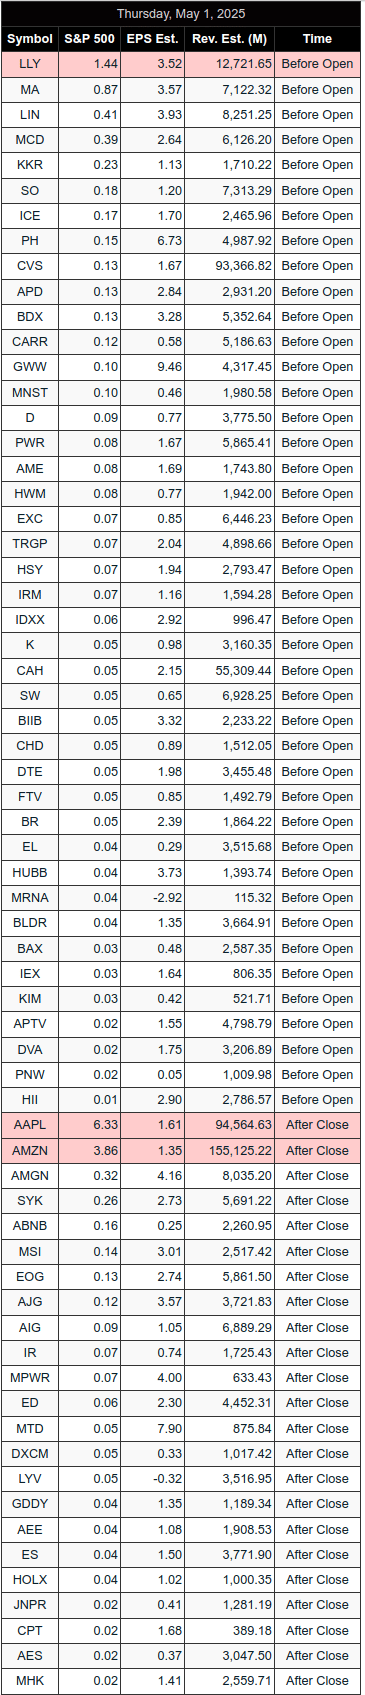
Pre-market: CVS, Mastercard, Eli Lilly, Moderna, Biogen, Hershey, and more.
-
After the bell: Apple, Amazon, McDonald’s, Airbnb, AIG, Amgen, Reddit, Twilio, among others.
-
-
Macro & Policy:
-
Q1 U.S. GDP shows first contraction in 3 years.
-
Core PCE inflation rose 3.5%, highlighting Fed’s tough balancing act.
-
Early signs of easing U.S.–China trade tensions; China quietly exempting some U.S. goods from tariffs.
-
-
Market Technicals & Volatility:
-
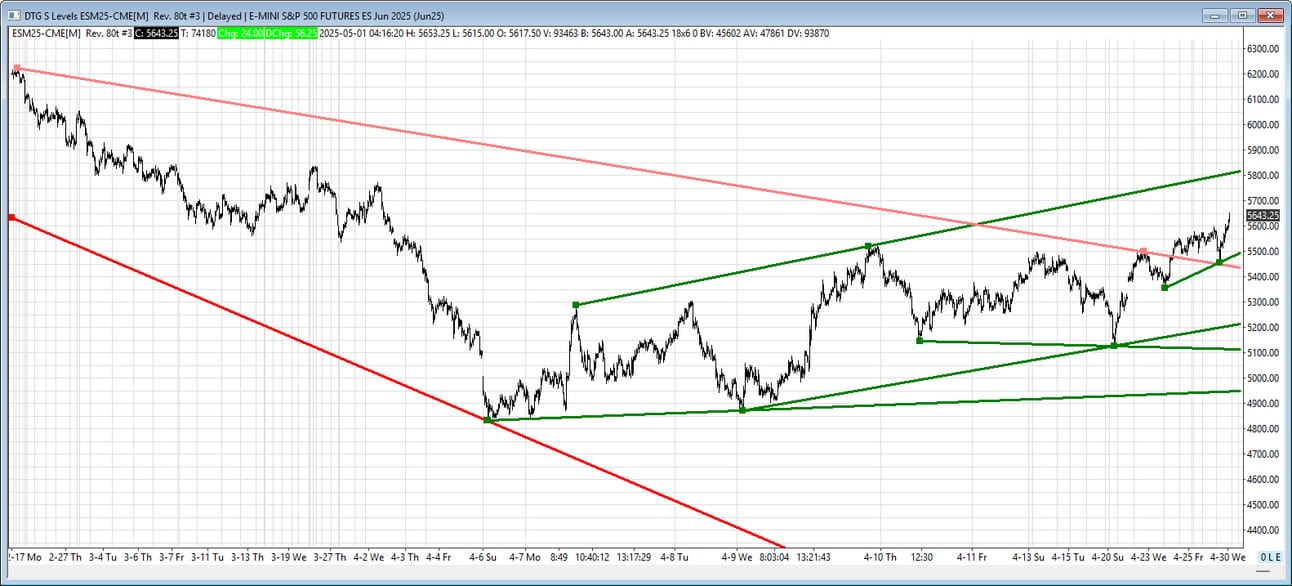
S&P 500 (ES) held support at former downtrend resistance; continues in short-term uptrend.
-
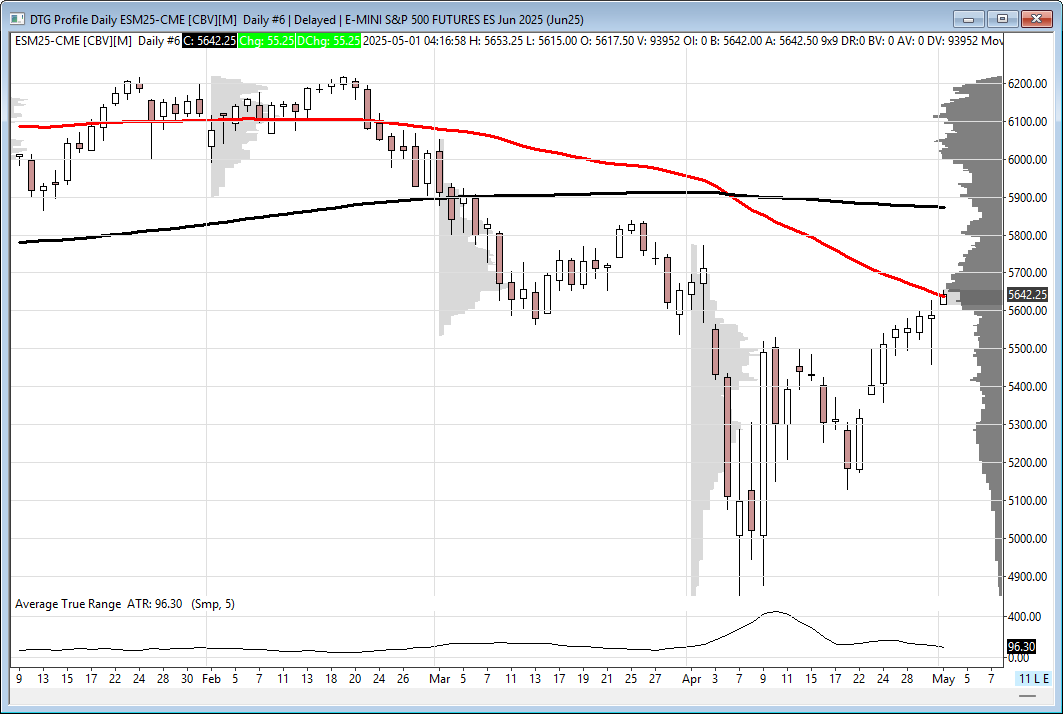
50-day moving average (5637) acting as resistance.
-
Key technical levels:
-
Resistance: 5810/15
-
Support: 5481/86, 5440/44, 5210/15, 5110/05, 4950/60
-
-
5-day average range contracts to ~119.75 points.
-
Whale bias bullish into 8:30am ET unemployment claims on elevated overnight volume.
-
-
Economic Data Today:
-
Initial Jobless Claims @ 8:30am ET
-
S&P Global Manufacturing PMI @ 9:45am ET
-
ISM Manufacturing PMI, Prices, and Construction Spending @ 10:00am ET
-
ES
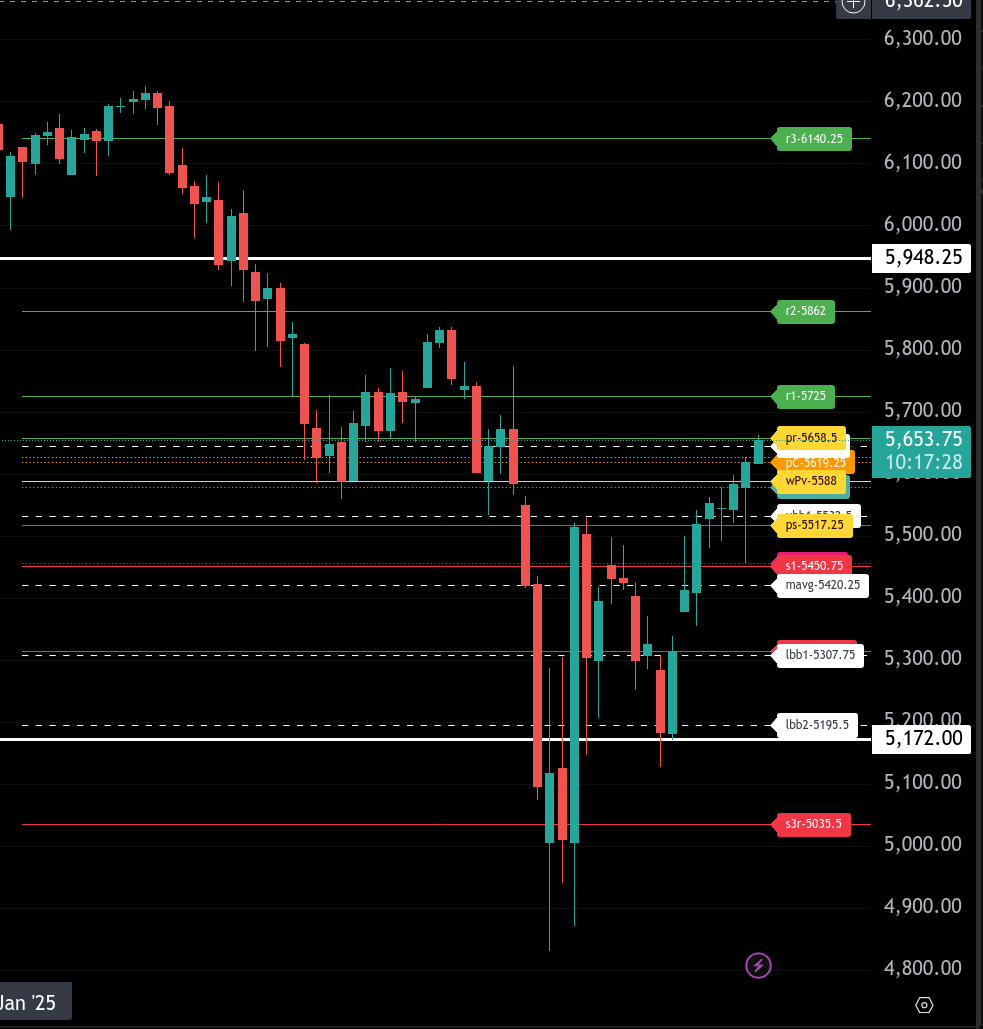
The bull/bear line for the ES is at 5588.00. This level is pivotal for determining directional bias. Holding above 5588.00 favors a bullish stance, while sustained action below signals continued bearish pressure.
Currently, ES is trading around 5654.00 in the Globex session, which is above the bull/bear line. This indicates bullish momentum into the morning. The next objective higher is 5658.50, our upper range target. If that is cleared, watch for resistance near 5725.00 and then 5862.00.
If price retraces from a probable gap-up open, support comes in at 5645.00 and 5619.25 on the way back to our 5588.00 pivot. If price fails to hold above the bull/bear line at 5588.00, look for downside action to target 5579.50 initially. Below that, the lower range target sits at 5517.25. A breakdown through that could open the door for a retest of the major support zones at 5450.75 and 5420.25.
Overall, the near-term trend is bullish above 5588.00, but this level must be monitored closely for any signs of reversal or failure to hold.
NQ
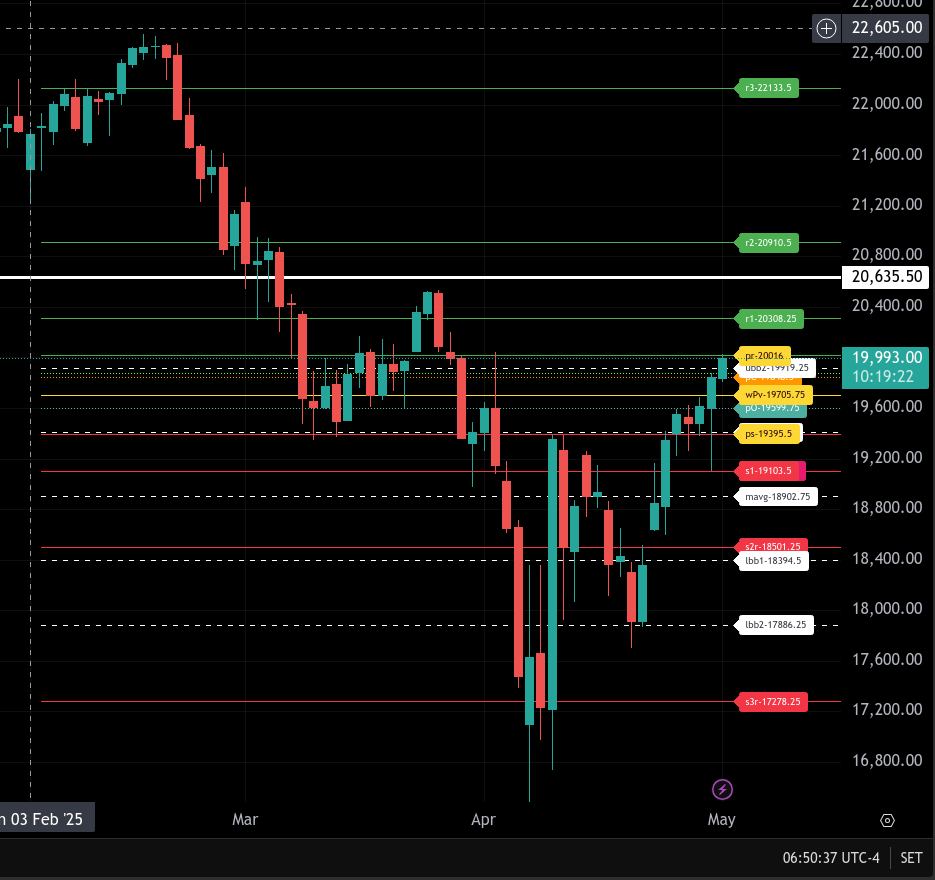
The bull/bear line for the NQ is at 19,705.75. This is the critical pivot level that will guide sentiment today. Holding above this level favors bullish setups, while a sustained break below it shifts control to the bears.
Currently, NQ is trading near 19,999.25 during the Globex session, well above the bull/bear line. This indicates strong overnight momentum. If buyers can maintain control above 19,705.75, the next upside targets are 20,016.00 and 20,308.30, the upper intraday range target and resistance level, respectively. Beyond that, momentum could extend toward 20,375.50.
On the downside, first support comes in at 19,845.50 and then 19,880.00. A break below these opens the door to a test of 19,599.80. If sellers regain control below the bull/bear line, expect pressure down to 19,395.50, which is the lower intraday range target. Further selling could reach into the 19,103.50 level or lower if weakness intensifies.
In summary, the market remains bullish above 19,705.75, with upside targets to 20,016.00 and 20,308.30. Watch for a breakdown below that line to shift sentiment lower toward 19,395.50 and 19,103.50.
Intraday traps or reversals around the 18,600.00 zone if volatility picks up.
Calendars
Economic Calendar Today
This Week’s High Importance
Earnings:
Released
Affiliate Disclosure: This newsletter may contain affiliate links, which means we may earn a commission if you click through and make a purchase. This comes at no additional cost to you and helps us continue providing valuable content. We only recommend products or services we genuinely believe in. Thank you for your support!
Disclaimer: Charts and analysis are for discussion and education purposes only. I am not a financial advisor, do not give financial advice and am not recommending the buying or selling of any security.
Remember: Not all setups will trigger. Not all setups will be profitable. Not all setups should be taken. These are simply the setups that I have put together for years on my own and what I watch as part of my own “game plan” coming into each day. Good luck!
This post goes out as an email to our subscribers every day and is posted for free here around 2 PM ET. To get your real-time copy, sign up for the free or premium version here: Opening Print Subscribe.
Comments are closed