This post goes out as an email to our subscribers every day and is posted for free here around 2 PM ET. To get your real-time copy, sign up for the free or premium version here: Opening Print Subscribe.
S&P 500: Climbing The Wall Of Worry
Follow @MrTopStep on Twitter and please share if you find our work valuable!
FREE Two Week Offer for the Opening Print Premium. Open up the Lean and other premium features for the next Two Weeks!
Our View
I was talking to a very good friend, and I asked him how he was doing, and he said, “I have never had worse anxieties than I do now.” I don’t know—I’ve known him to be a very level-headed guy. Successful, kids getting out of college, decent-sized bank account and holdings. But he went on to say, “It’s not as easy as it used to be.”
In the past, when there were bad economic times, I always felt the U.S. would figure it out. But now it really does feel like the U.S. has fallen out of grace, which I believe has been in motion for a long time. If there’s going to be finger-pointing, I think it starts with the Fed interest rate path at the end of 2024. And absolutely, Trump’s tariff tantrum only exacerbated the problem and accelerated the stock, bond, dollar, and crypto sell-off. Of course, the public turned on Trump, but the list of problems goes way beyond the President.
I remember during the Credit Crisis, when the Fed was going nuts with QE, that people were saying the Fed would never pay the debt back.
2008 Credit Crisis:
The Federal Reserve’s total financial commitments during the 2008 financial crisis were approximately $12.75 trillion, including about $1 trillion in domestic emergency lending (e.g., TAF, PDCF), approximately $10 trillion in currency swap lines to foreign banks, and around $1.75 trillion in QE1 asset purchases (MBS, agency debt, Treasuries). After repayments and interest, the net cost was around $498 billion. During the 2008 crisis, QE1 expanded the Fed’s balance sheet from $890 billion in 2007 to $4.5 trillion by 2015, with total commitments peaking at approximately $12.75 trillion (gross, including lending).
During the 2020 COVID pandemic:
The Federal Reserve conducted approximately $4.4 trillion in quantitative easing during the 2020–2021 COVID-19 pandemic, with about $2.5 trillion in asset purchases in 2020 alone (March–December: ~$1.8 trillion Treasuries, ~$0.7 trillion agency MBS, ~$0.02 trillion other). Total purchases from March 2020 to December 2021 included roughly $3.0 trillion in Treasuries and $1.4 trillion in MBS, expanding the balance sheet from $4.2 trillion to $8.9 trillion. I think we passed the Rubicon during that period in terms of wasted money, and we’ve really never fully recovered.
The largest costs to the U.S. economy in 2025—interest on national debt, Social Security and Medicare, tariffs, healthcare, and military spending—reflect fiscal, demographic, and trade challenges. Despite the ES up 30% off their lows, the lingering problem remains the record U.S. debt, estimated to be $36.903 trillion, which does not include Trump’s new $3 trillion budget. It won’t be long before the deficit is over $40 trillion.
The interest payments are shocking. Below is what the U.S. would pay in interest if the national debt were $40 trillion:
-
Daily Interest: About $3.7 billion each day
-
Weekly Interest: Roughly $25.7 billion each week
-
Monthly Interest: Around $111.8 billion each month
-
Quarterly Interest: Approximately $335.4 billion every three months
-
Six-Month Interest: About $670.8 billion every six months
-
Annual Interest: Roughly $1.34 trillion each year
No matter how you look at it, the growing debt is UNSUSTAINABLE.
In the end, the markets are weathering the storm, but one has to wonder how long the disconnect can last. The answer? As long as the government keeps pumping.
Nvida (NVDA) Preview:
Options trading shows investors are bracing for a big swing in Nvidia stock after the earnings, as has often happened in recent quarters. Nvidia shares have risen nearly 25% in the past month, putting the stock up about 1% since the start of the year. Technical analysis suggests bullish momentum is on Nvidia’s side heading into today’s report. Nvidia stock is expected to move about 6% in either direction by the end of the week, according to an analysis of options pricing data. That would put Nvidia’s share price at either $143.92, a 4-month high, or $127.09. Analysts expect Nvidia to report revenue and earnings growth of about 66% and 40%, respectively, in the most recent quarter.
Goldman Sachs is forecasting Nvidia’s revenue for fiscal Q2 to be $28 billion, plus or minus 2%. They also expect gross margins to be 74.8% (GAAP) and 75.5% (non-GAAP), plus or minus 50 basis points. Yahoo Finance also noted that Goldman Sachs analysts raised their price target for Nvidia to $800, indicating a 21% upside from current levels.
Our Lean
There are no economic reports today, but we do have a $70 billion 5-year note auction, a $60 billion 119-day Treasury Bill (17-week bill) offering, and a $28 billion reopening of the 1-Year 11-Month Floating Rate Notes (FRNs), settling Friday at 1:00 p.m. We also get the minutes of the May FOMC meeting at 2:00 p.m., followed by a speech from Minneapolis Fed President Neel Kashkari.
Morgan Stanley said their research indicates $15 billion of new demand is coming into the stock market daily—$5 billion from retail, $5 billion from CTAs, and $5 billion from corporates and stock buybacks. May 2025 buybacks likely totaled $90–110 billion, based on annual projections of $1 trillion, Q1 2025’s $125 billion in non-financial buybacks, and active programs like Cavco ($150M), News Corp ($1B), and AMD ($10B total).
When you add all this up, it clearly looks like the ball is in the bulls’ court.
Our lean: Volumes are low, and unless there’s some bad news out there we don’t know about, the ES and NQ look higher. Again, I can’t rule out selling a big gap or the first rally above in Tokyo at 4:00. Maybe not immediately, but the ES is going to new highs. I can’t ignore the gap up—but the trend is your friend, and right now, that means buying pullbacks.
The levels I am looking at today are as follows:
Resistance: 6050, 6025, 6000, 5995, 5976, 5858, 5950, 5942
Support: 5935, 5924, 5920, 5910, 5905, 5900, 5890, 5875
MiM and Daily Recap
Intraday Recap
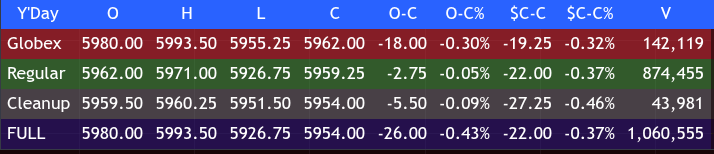
The session opened in the Globex overnight at 5889.00, down slightly from the prior day’s close of 5889.75. After midnight east coast time, the Globex rallied, setting a high of 59112 at 3:48 AM, up over 50 points from the low. Premarket open at 9:21 AM, the markets found themselves at 5900.25 and began a selloff into the open, finding a low post open of 5868.25 down 32 points pre-market and establishing the low of the day.
This rally extended through the late morning and early afternoon, reaching a significant session high of 5938.75 at 2:00 PM. This marked a gain of 70.50 points (+1.20%) from the previous low at 9:35 AM.
A corrective pullback followed, dropping to a higher low of 5923.75 by 3:50 PM, a 15-point retreat (-0.25%). However, buyers regained control and pushed the ES to a late session high of 5941.75 at 4:10 PM, an 18-point rise (+0.30%) from the previous low.
The full day closed at 5940.25, reflecting a net gain of 51.25 points (+0.87%) from the regular session open at 5886.25 and a 45-point (+0.76%) gain from the previous day’s cash close at 5895.25. Notably, the cleanup session saw an additional modest rise, with a close slightly higher than the regular session close, confirming buying strength into the late afternoon.
Volume for the full session reached just over 1 million contracts, with the regular session accounting for approximately 869,000 contracts.
Market Tone & Notable Factors
Overall, the market tone was bullish throughout the day. After a tentative start with early volatility and a sharp dip in the Globex and opening minutes, strong buying momentum drove prices higher during the main session, pushing the ES firmly into positive territory.
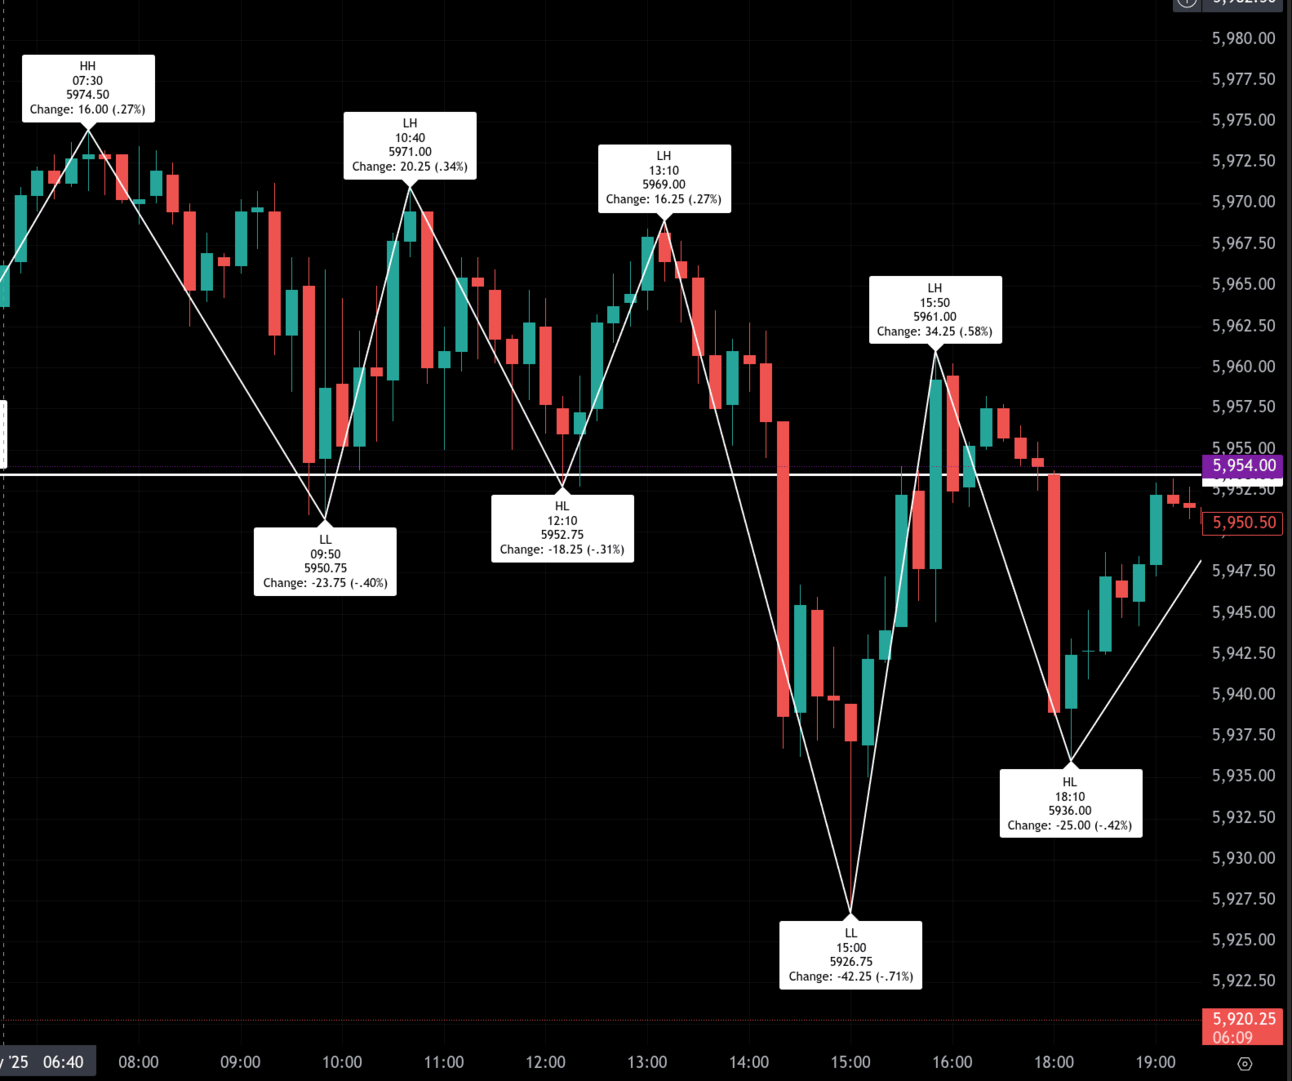
The Market-on-Close (MOC) and Market Imbalance Meter (MiM) data reinforced this bullish bias. At the 15:55 snapshot, there was a substantial buying imbalance with $3.884 million on the buy side versus $1.767 million on the sell side, representing a 68.7% buy-dollar dominance. The symbol count for buy orders was 51.8%, a mild advantage but below the 66% threshold for a strong signal. This buying pressure helped support prices through the closing auction.
Volume was steady and supportive of the move higher, with the total session volume surpassing 1 million contracts, indicating solid participation.
Looking ahead, the firm close near session highs, combined with positive MOC buying pressure, suggests the bulls maintained control into the close. Unless disrupted by overnight news or economic data, the market may open poised to continue building on gains, with key support near the morning lows around 5862 and resistance near the late session highs of 5941.
Technical Edge
Fair Values for May 28, 2025:
-
SP: 12.83
-
NQ: 53.16
-
Dow: 62.48
Daily Market Recap 📊
-
For Tuesday, May 27, 2025
-
NYSE Breadth: 85% Upside Volume
-
Nasdaq Breadth: 83% Upside Volume
-
Total Breadth: 83% Upside Volume
-
NYSE Advance/Decline: 86% Advance
-
Nasdaq Advance/Decline: 71% Advance
-
Total Advance/Decline: 77% Advance
-
NYSE New Highs/New Lows: 96 / 14
-
Nasdaq New Highs/New Lows: 169 / 64
-
NYSE TRIN: 1.05
-
Nasdaq TRIN: 0.49
-
Weekly Market 📈
-
For week ending Friday, May 23, 2025
-
NYSE Breadth: 39% Upside Volume
-
Nasdaq Breadth: 50% Upside Volume
-
Total Breadth: 46% Upside Volume
-
NYSE Advance/Decline: 19% Advance
-
Nasdaq Advance/Decline: 34% Advance
-
Total Advance/Decline: 28% Advance
-
NYSE New Highs/New Lows: 156 / 97
-
Nasdaq New Highs/New Lows: 312 / 244
-
NYSE TRIN: 0.36
-
Nasdaq TRIN: 0.49
-
Guest Posts — Polaris Trading Group
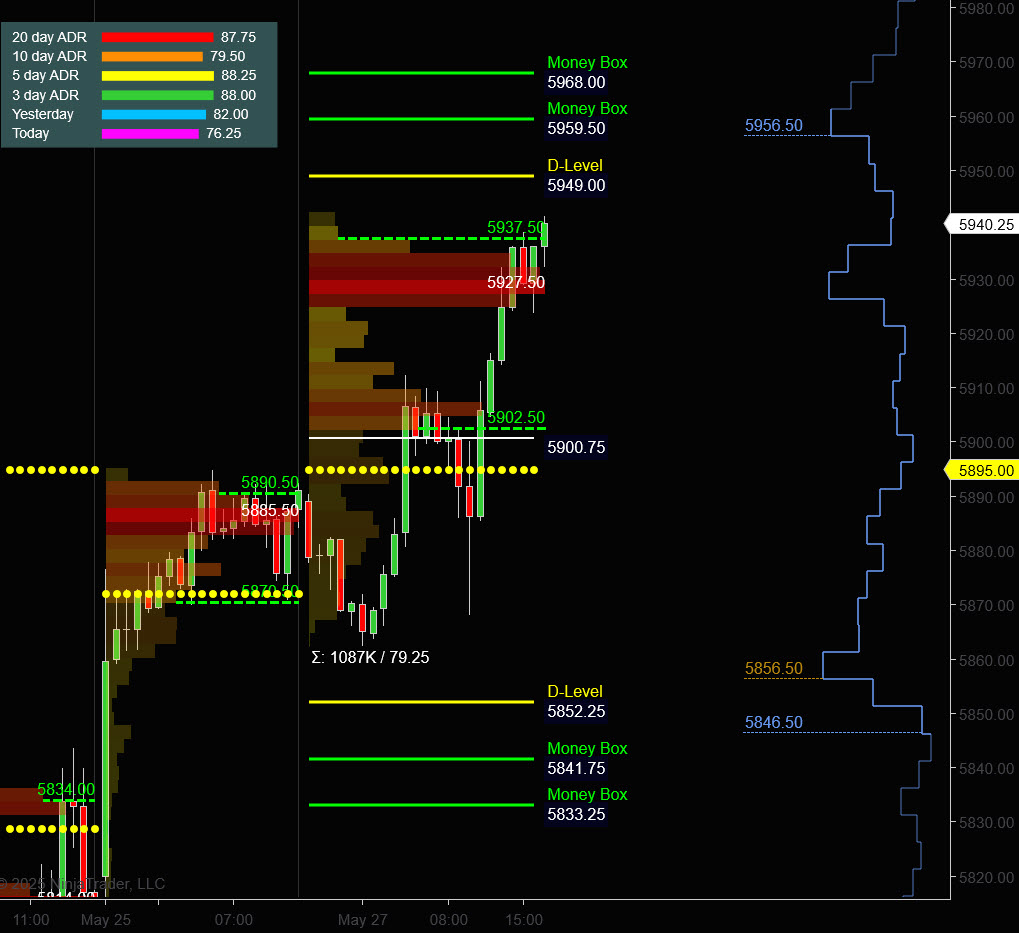
Prior Session was Cycle Day 2: Textbook CD2 as price initially declined to successfully retest the 5870 Line in the Sand (LIS).
Once the Open Range High 5890 handle was cleared, bulls established unwavering dominance that lasted throughout the session, with price closing near 5941.75 high of the day.
Range was 79 handles on 1.087M contracts exchanged.
FREE TRIAL link to PTG/Taylor Three Day Cycle
For a more detailed recap of the trading session, click on this link: Trading Room RECAP 5.27.25
…Transition from Cycle Day 2 to Cycle Day 3
Transition into Cycle Day 3: Price is safely above the CD1 Low (5813) as of the prior close which will satisfy the Positive 3-Day Cycle Statistic, which has an 90% historical performance track record.
Having closed on highs of the day, bullish momentum is likely to push price higher before the next decline unfolds.
Additional upside cycle targets remain open (5955…5960…5978) should the price continue the rally.
Failure to extend above PH (5941.75) and reversal back below would set up a “Peek-a-Boo” Short Structure.
Of course, nothing changes for PTG…Simply follow your plan. Take only Triple A setups and manage the $risk. ALWAYS HAVE HARD STOP-LOSSES in-place on the exchange.
PTG’s Primary Directive (PD) is to ALWAYS STAY IN ALIGNMENT with the DOMINANT FORCE.
As such, scenarios to consider for today’s trading.
Bull Scenario: Price sustains a bid above 5940+-, initially targets 5955 – 5960 zone.
Bear Scenario: Price sustains an offer below 5940+-, initially targets 5915 – 5905 zone.
PVA High Edge = 5938 PVA Low Edge = 5903 Prior POC = 5928
ESM2025
Thanks for reading, PTGDavid
Trading Room Summaries
Polaris Trading Group Summary – Tuesday, May 27, 2025
The trading day opened with bullish momentum continuing from overnight action, where the upper target zone of 5905–5910 was fulfilled exactly per the Daily Trade Strategy (DTS) briefing. This set a positive tone early on, confirming the market’s alignment with PTG’s scenario planning. David guided the room through Cycle Day 2 dynamics, with a consistent focus on key levels, scenario pivots, and macroeconomic developments.
Key Highlights & Positive Trades:
-
Overnight Fulfillment: Price action hit the upper DTS target zone (5905–5910) before the session even began—a great example of pre-market strategy validation.
-
Morning Bullish Structure:
-
David identified 5895 as the Line in the Sand (LIS).
-
Bulls were advised to control 5895+ to maintain upside targets. This worked well as price action adhered closely to this map.
-
Market sentiment strengthened further with a strong Consumer Confidence reading (98.0 vs. 87.05 forecast) which helped fuel bullish continuation.
-
-
Live Trade Management:
-
David actively managed an A4 long position, providing insights on structure and rhythm.
-
Simultaneously, a Crude Oil (@CL) short hit Target 1, contributing to a well-rounded trading day across instruments.
-
-
@ES Money Box Trade:
-
Major win came as the @ES Money Box trade hit its 5926.25 target. This trade was called and fulfilled cleanly, showing excellent execution on structure.
-
-
Afternoon Continuation:
-
Despite noting the afternoon session was less fruitful, David pointed out key levels (like 5922 pivot support) that held, keeping bulls in control.
-
The market continued pushing to a VPOC target of 5948, emphasizing the strong buying pressure, especially amid persistent 0DTE call activity.
-
Lessons & Takeaways:
-
Strategic Patience Pays: The clear roadmap set by David in the DTS briefing gave traders confidence to stay with the trend. Both upper and lower zones behaved precisely as forecasted.
-
Cycle Day Awareness: Cycle Day 2 rhythms played out, reinforcing the importance of understanding daily context when planning entries and exits.
-
Adaptability: Though the A4 long was initially the focus, quick recognition of a second @CL position demonstrated nimble trade tracking and communication.
-
Market Close Dynamics: The close featured significant MOC (Market on Close) activity—initially a $300M sell indication, flipped to a $1.8B buy, labeled “trickery at the close.” A reminder that last-minute flows can surprise and need careful watching.
Final Note:
The market closed on the highs of the day, a testament to the bullish control and the effectiveness of PTG’s strategy framework. David’s consistent mapping, clear trade ideas, and live analysis gave members the tools to capitalize confidently.
“Way to Go Bulls – In Style.”
Discovery Trading Group Room Preview – Wednesday, May 28, 2025
-
Good morning. It’s Fed Day, with May meeting minutes due at 2:00 pm ET.
Market Highlights:
-
Equities surged Tuesday on improved EU trade sentiment and a bounce in U.S. consumer confidence. The Dow gained 700+ points; S&P 500 rose 2.1%.
-
Global bond yields fell after Japan reduced super-long bond issuance. U.S. 30-year Treasury yields dropped to ~4.94%.
-
Japan plans to purchase $6.94B in U.S. chips to ease a $69.4B trade deficit; fourth round of trade talks expected around May 30.
U.S. Policy & Trade:
-
Trump’s tax bill now heads to the Senate after clearing the House, potentially adding volatility.
-
Tariff collections spiked with $22.3B in May, including $16.5B in a single day, totaling $92B YTD.
Corporate Focus:
-
Nvidia (NVDA) reports earnings after the bell. Shares are nearly flat YTD but up 26% YoY. Focus is on cloud GPU rollout and impacts from chip bans to China.
-
Premarket earnings: BMO, DKS. Post-market includes NVDA, CRM, SNPS, HPQ, PSTG, VEEV, among others.
Economic Data:
-
Richmond Fed Index due at 10:00 am ET. Otherwise, a quiet calendar.
Technical Levels:
-
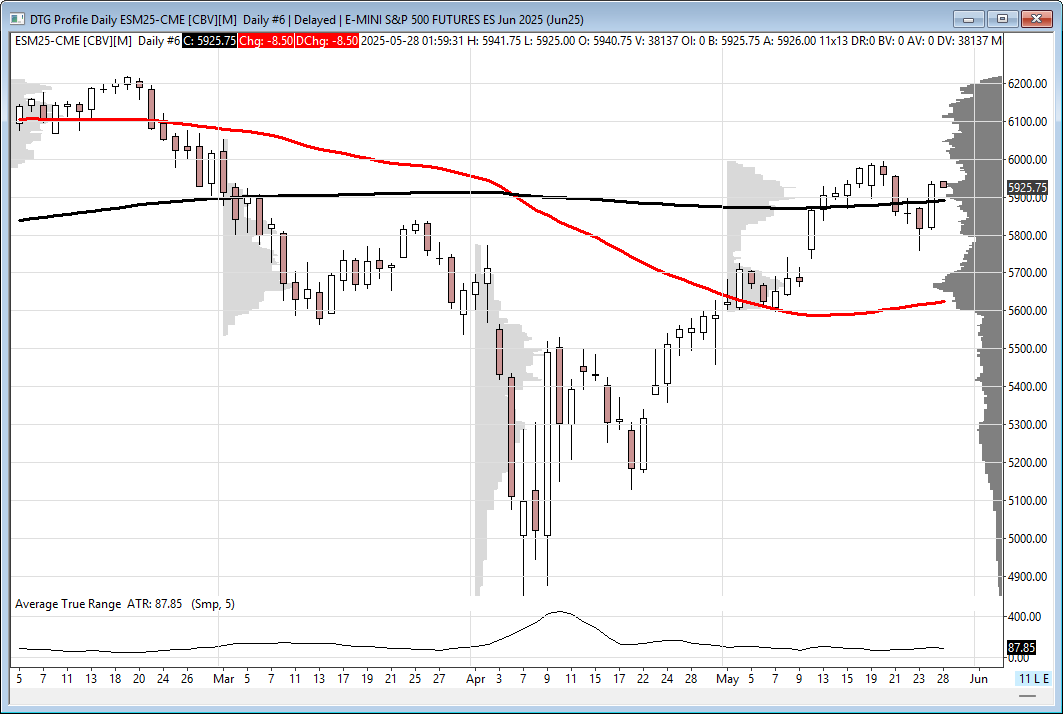
ES has closed above the 300-day MA (5890.25), now acting as loose support.
-
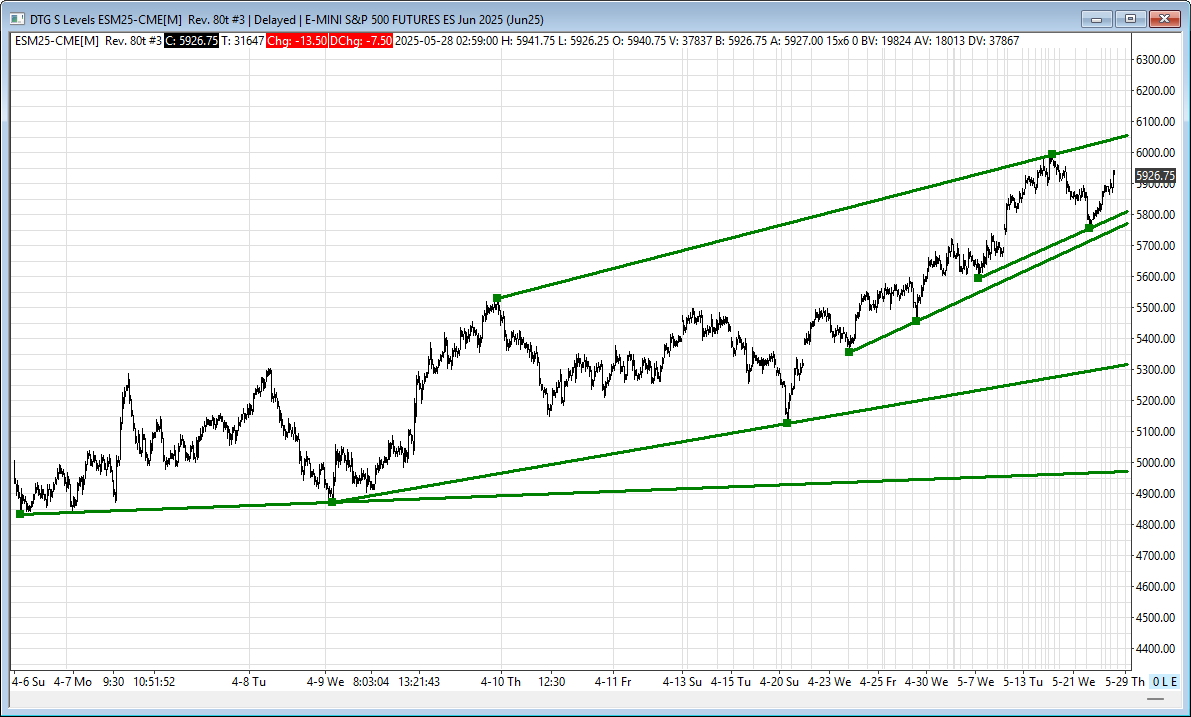
Key resistance: 6050/55. Supports: 5801/06, 5755/60, 5317/22, 4972/77.
-
Volatility elevated with 5-day ADR at 97.75. No significant whale activity observed.
Stay tuned for the Fed minutes and Nvidia’s earnings.
-
ES
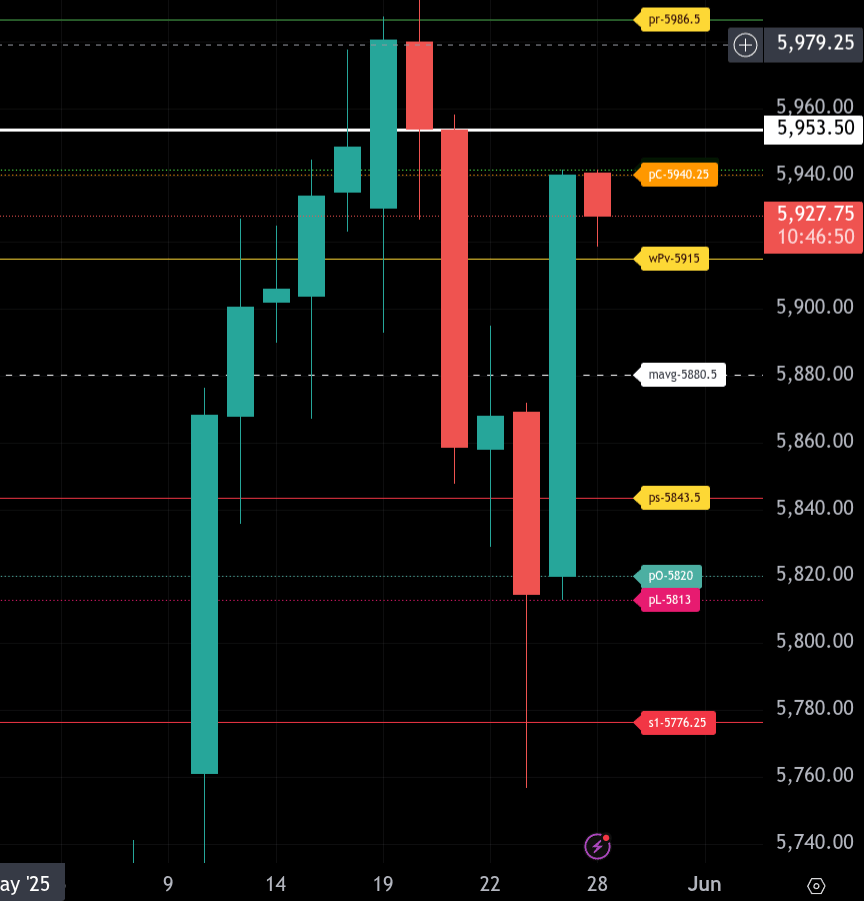
The bull/bear line for ES sits at 5915.00. This level must hold for bullish momentum to remain intact. Above 5915.00, look for buying opportunities on dips.
Currently, ES Globex is trading near 5928.00, holding above the bull/bear line. Key pivot levels at 5940.25 and 5941.75 sit between the current trade and the intraday upper range target. On the upside, the intraday upper range target of 5986.50 comes into focus. A sustained break above 5986.50 would open a test of resistance at 6054.00 (R1).
On the downside, initial support lies at 5880.50, followed by the lower range target of 5843.50. A break below 5843.50 could extend the decline toward 5820.00.
NQ
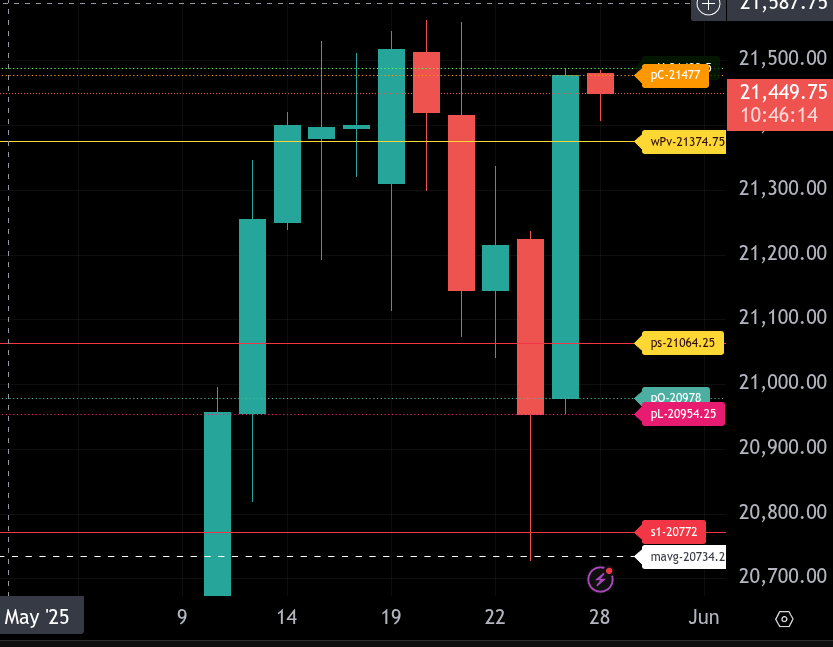
The bull/bear line for the NQ is at 21,374.75. This is the key level that must be defended to maintain bullish momentum. Above this line, look for buying opportunities on dips.
Currently, NQ is trading around 21,446.25 in the Globex session, showing underlying strength above the bull/bear line. The intraday range targets for today are 21,685.25 on the upside and 21,064.25 on the downside.
On the upside, a break above 21,685.25 would open a test of the upper Bollinger band at 21,809.75. Sustained strength above that band would signal a shift to a more aggressive bullish stance.
On the downside, failure to hold above 21,374.75 and a breach below 21,064.25 would expose the open pivot at 20,978.00, followed by the pivot low at 20,954.25. Further support lies at S1 20,772.00 and 20,734.25.
Overall bias remains bullish above 21,374.75. If price closes below this level for more than one hourly bar, look for potential retracements toward the lower targets and additional support levels.
Calendars
Economic
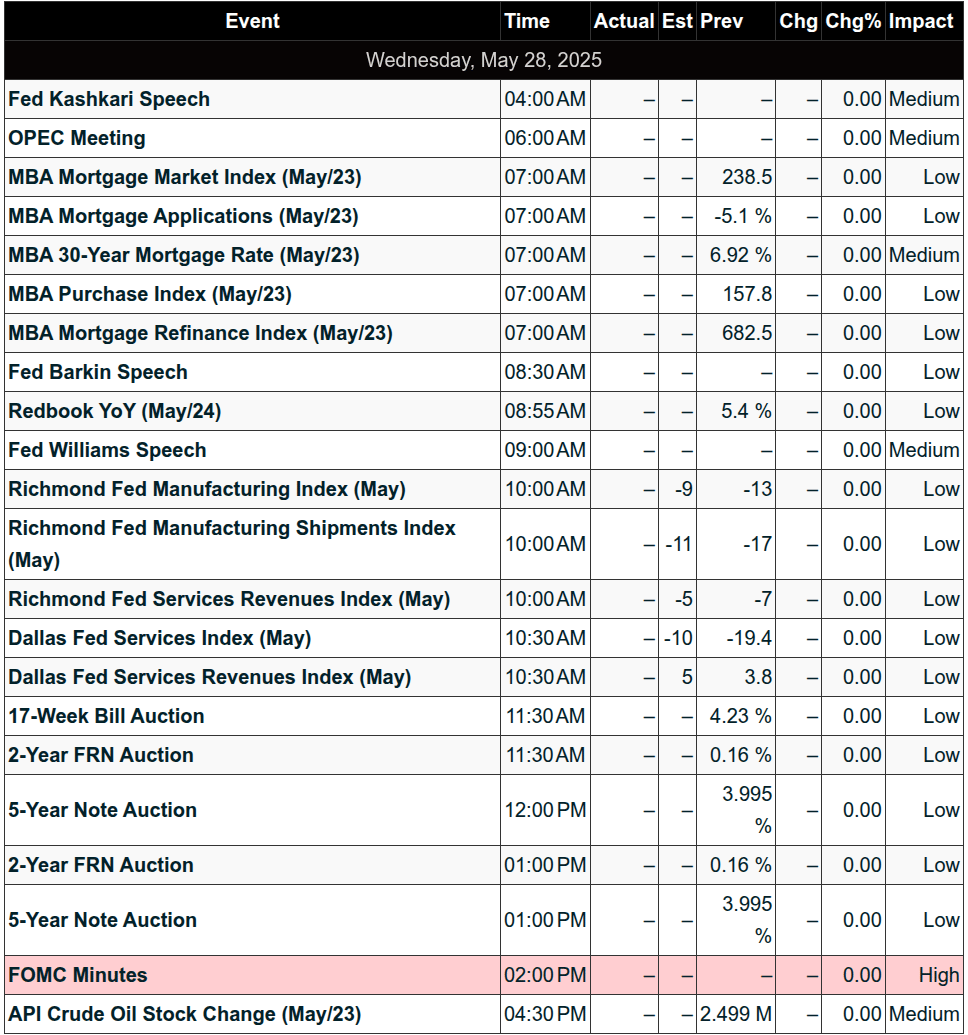
Today
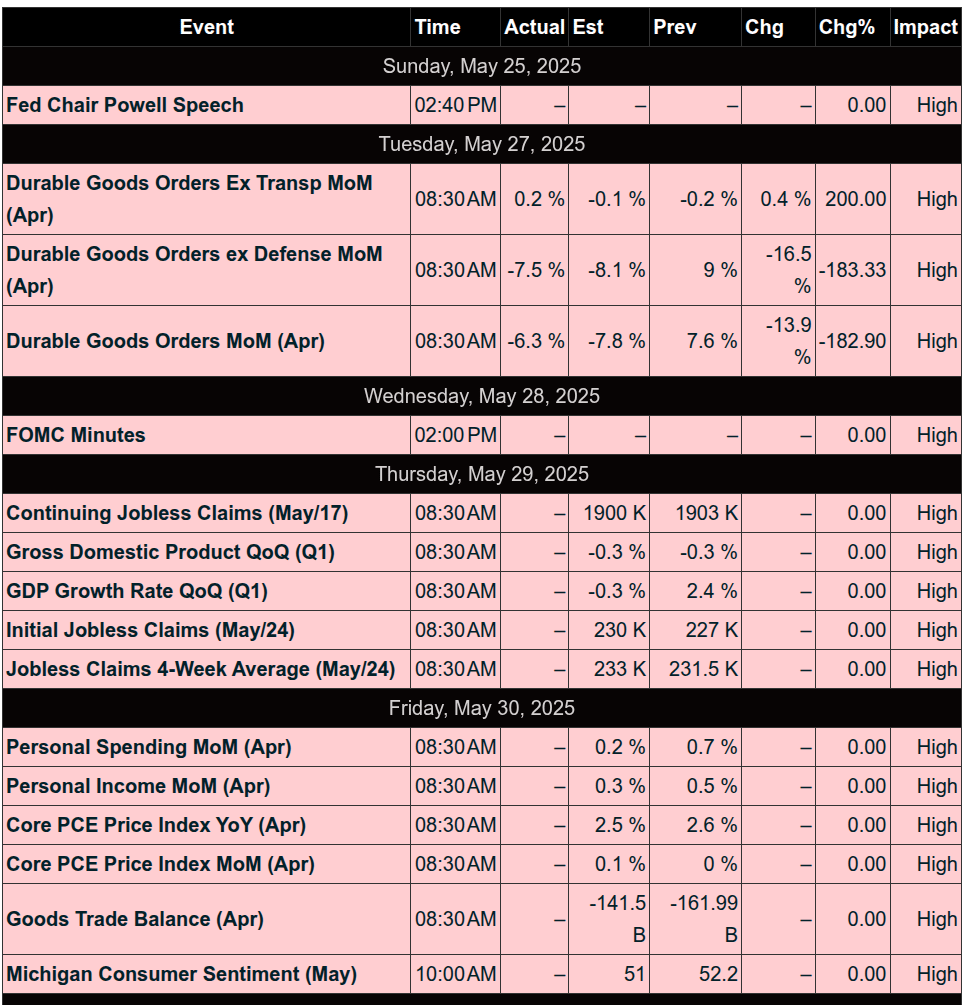
Important Upcoming / Recent
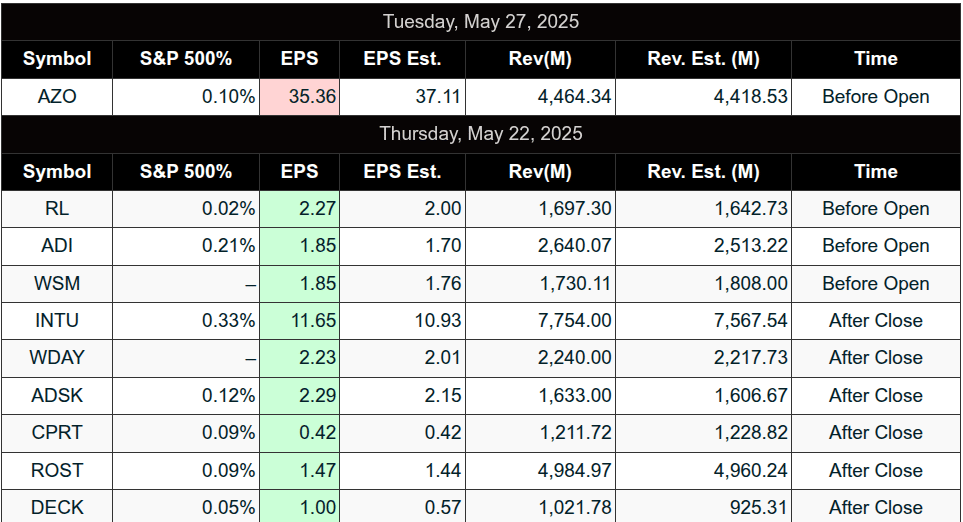
Earnings
Upcoming
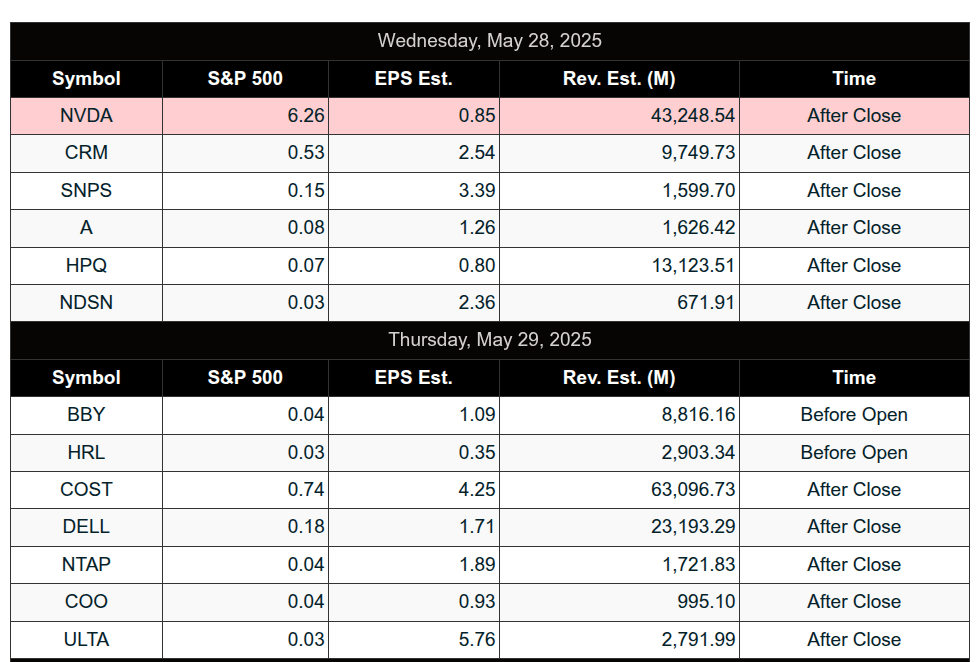
Recent
Affiliate Disclosure: This newsletter may contain affiliate links, which means we may earn a commission if you click through and make a purchase. This comes at no additional cost to you and helps us continue providing valuable content. We only recommend products or services we genuinely believe in. Thank you for your support!
Disclaimer: Charts and analysis are for discussion and education purposes only. I am not a financial advisor, do not give financial advice and am not recommending the buying or selling of any security.
Remember: Not all setups will trigger. Not all setups will be profitable. Not all setups should be taken. These are simply the setups that I have put together for years on my own and what I watch as part of my own “game plan” coming into each day. Good luck!
This post goes out as an email to our subscribers every day and is posted for free here around 2 PM ET. To get your real-time copy, sign up for the free or premium version here: Opening Print Subscribe.
Comments are closed