This post goes out as an email to our subscribers every day and is posted for free here around 2 PM ET. To get your real-time copy, sign up for the free or premium version here: Opening Print Subscribe.
S&P 500: Is the Longest Winning streak in 20 years, Long in the Tooth?
Follow @MrTopStep on Twitter and please share if you find our work valuable!
Our View
The Globex session saw a pop up to 5682.50, dropped 40 points, and rallied up to 5677 after US April non-farm payrolls came out +177K vs. +130K—higher than expected—and then rallied up to 5699.00. It opened the regular session at 5686.50, sold off 35 points, and then came roaring back with the NQ leading the way.
Stocks were buoyed by easing tension between the US and China, strong data, and Goldman Sachs CTA numbers that showed $42bn of global equities were bought. Throughout the day, and despite the higher closes, it looked like the rotations were: buy the ES / sell the NQ, and buy the 10-year note and sell the 30-year bond.
After the initial selloff and a lot of little dips, the ES rallied up to 5724.75. That’s when the NQ started going offered and pushed the ES down to the 5700 level, as the 3:50 imbalance showed $4 billion to buy. It settled at 5710.75, up 98.75 points or 1.76%, up 878.75 points from the 4832.00 low on April 7, a gain of over 18%.
It was an extremely long and choppy trading day.
The 5/5/25 Lowdown
S&P, Dow, Nasdaq, and Russell net changes on Friday’s close:
For Friday:
The S&P closed up 82.53 points, or 1.5%, to 5,686.67. The Dow rose 564.47 points, or 1.4%, to 41,317.43. The Nasdaq was up 267 points, or 1.5%, and the Russell 2000 was up 63.12 points, or 3.2%.
For the week:
The S&P is up 161.46 points, or 2.9%. The Dow is up 1,203.93 points, or 3%. The Nasdaq is up 670.05 points, or 3.4%, and the Russell 2000 is up 63.12 points, or 3.2%.
For the year:
The S&P is down 194.96 points, or -3.3%. The Dow is down 1,226.79 points, or -2.9%. The Nasdaq is down 1,333.06, or 6.9%, and the Russell 2000 is down 209.42 points, or 9.4%.
The index markets extended their winning streak to 9 higher closes in a row, its longest winning streak since 2004, and reclaimed the ground it lost since President Donald Trump started pushing his trade war in early April.
On April 24th and 25th, I said that the markets would make new highs into all the economic releases and tech earnings—and they wasted no time, closing higher every day last week. I know the markets got a boost from Beijing saying they were evaluating talks with the US, and the jobs number did come in better than expected. But Monday, April 21, was when the ES made its low at 5127.75, rallied 90 points in the final hour, and still closed lower for the day.
The week of April 21st was also the week Trump said he was not going to fire Fed Chair Jerome Powell—and soon after, the headlines slowed.
The other part of this, and it was evident in the CTA numbers above, is that investors dumped a record level of stocks so aggressively during the height of the risk-off, and are now piling back in.
On the other side of this risk-off is gold. It made a high at $3,485.60 and recently made a low at $3,212.80, a drop of $272.80 or 7.83%. While the gold drop is significant, it’s a drop in the bucket compared to a 23% gain over the last year, a 51.11% gain over the last two years, or a 78% gain over the last three years.
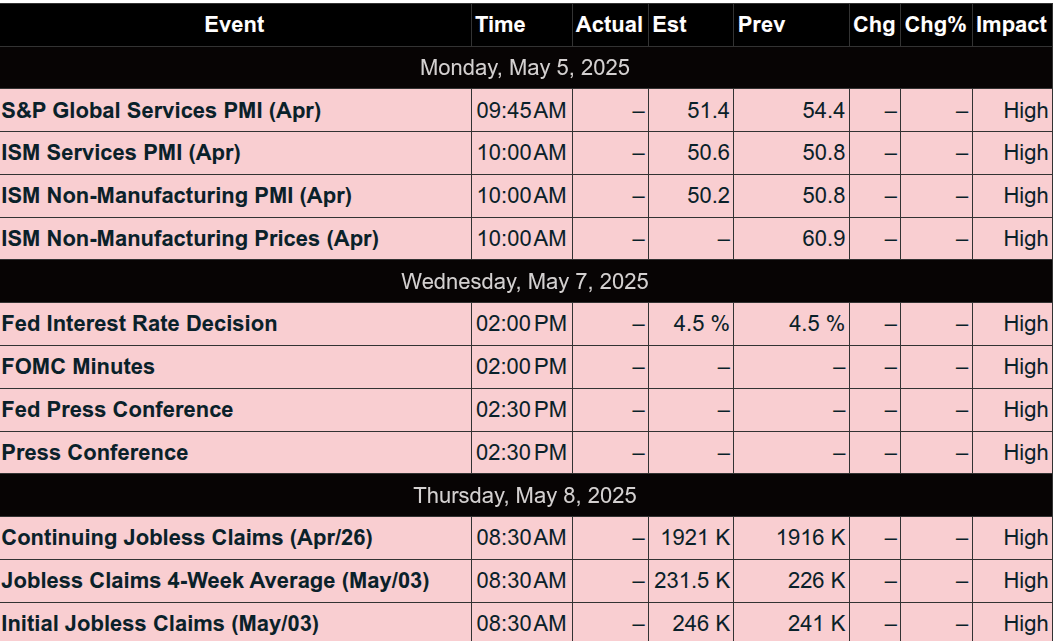
The week ahead has only 7 economic releases: the FOMC at 2:00 Wednesday, and Powell speaking at 2:30; and 9 Fed speakers on Friday from 5:55 am to 7:45 pm. There’s a 3-year note auction ($58bn) today, a 10-year note auction ($42 billion) on Tuesday, and a 30-year auction ($25 billion) on Thursday.
Earnings this week include:
-
May 5: Ford Motor Company (F) and Palantir Technologies (PLTR)
-
May 6: Advanced Micro Devices (AMD) and Archer-Daniels-Midland Company (ADM)
-
May 7: The Walt Disney Company (DIS) and Uber Technologies (UBER)
-
May 8: Shopify Inc. (SHOP) and Coinbase Global (COIN)
-
May 9: Enbridge Inc. (ENB)
As of May 2, 2025, 72% of the companies in the S&P 500 have reported earnings, with 62% of those companies reporting revenues above estimates.
Our Lean
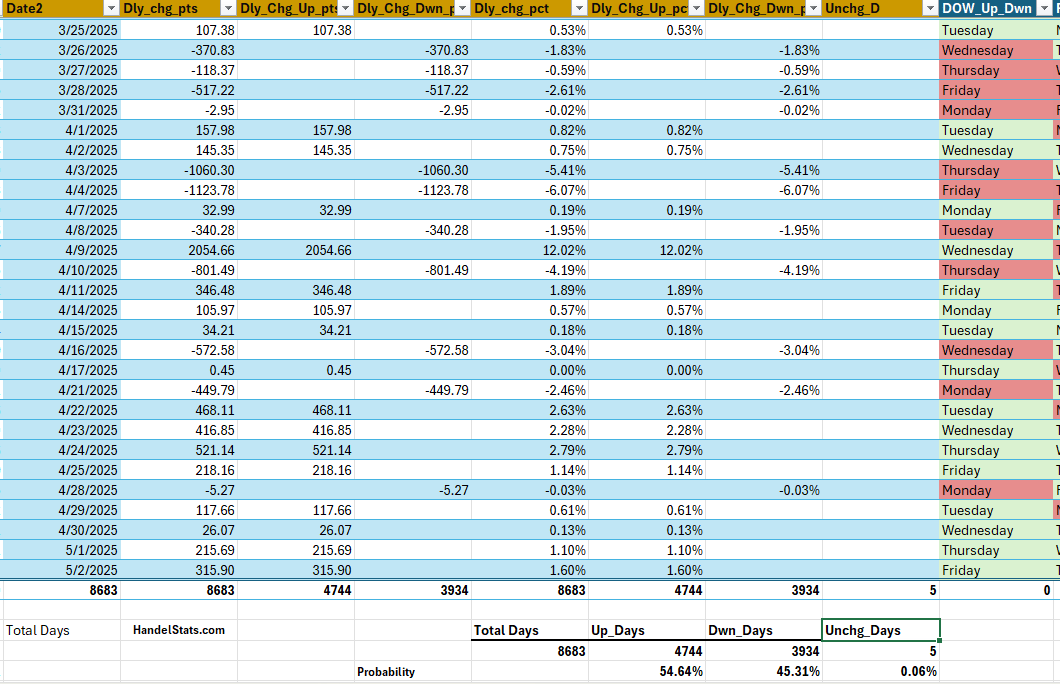
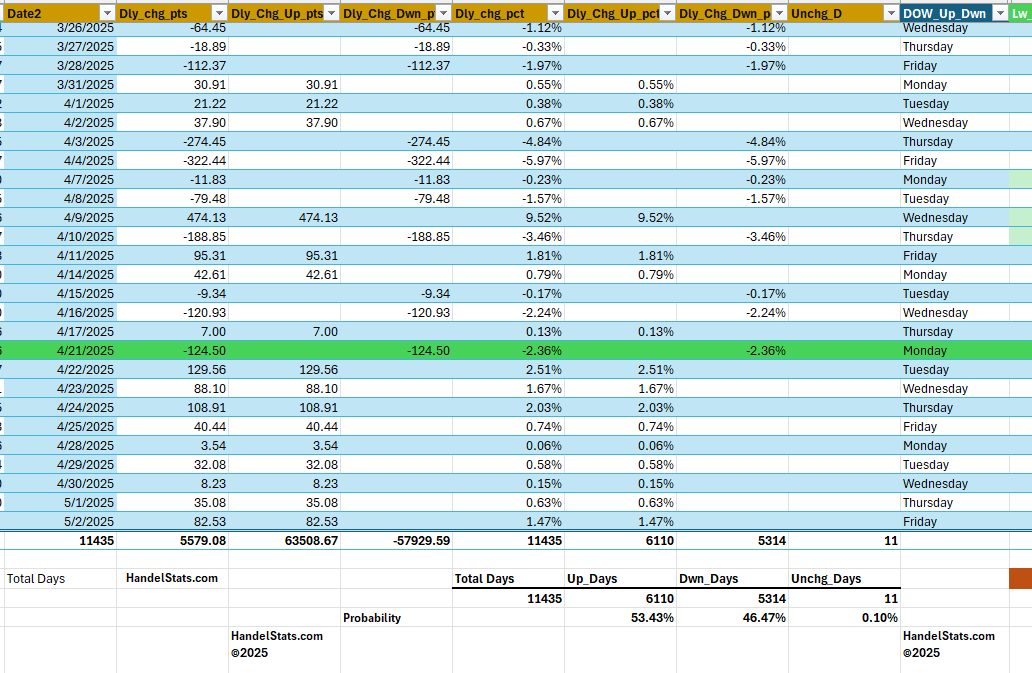
The ES is 14% off its low, the NQ has rallied 15.3%, the YM has rallied a whopping 35%, and the RTY (Russell 2000) is about 10% off its low. It’s hard to deny that the markets have rallied, especially with 9 days in a row of higher closes, but history may be catching up to the rally. Since 1980:
Streaks:
-
14 eight-day streaks
-
4 nine-day streaks
-
3 ten-day streaks
-
2 eleven-day streaks
-
1 twelve-day streak
Our lean: One would think that after a big 8- to 12-day rally, there would be a decent pullback, but the stats actually only show a few instances where there were some sizable pullbacks. The 10th day up was followed by mixed markets and recouped any pullbacks. The 11-day streak was followed by a 2% decline, and after the 12-day streak was mixed. In fact, after all the declines, the ES rallied again.
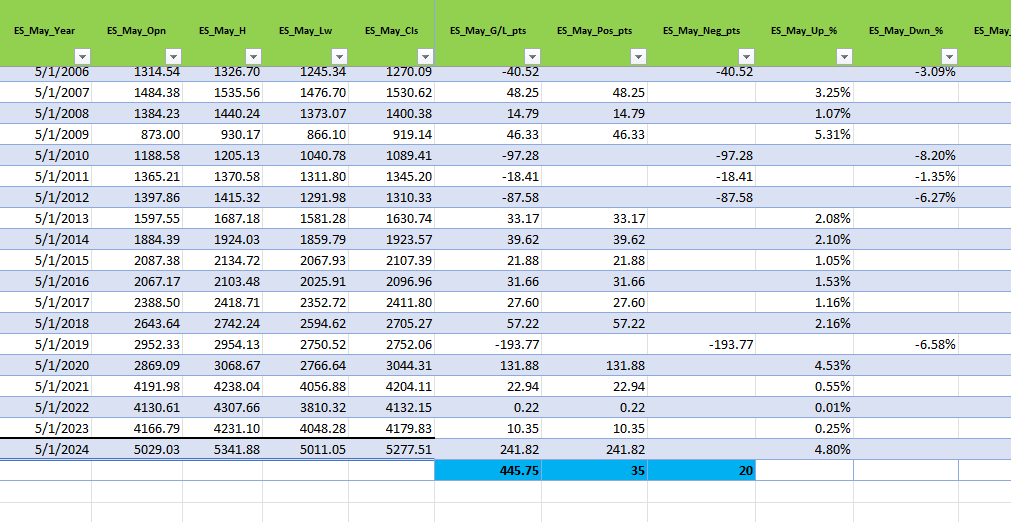
We all know the old trading adage “Sell it in May and walk away.” While May has seen some big downs, it’s also been up 12 of the last 13 years, but you can see for yourself. I understand that some people don’t pay attention to historical stats, but winning streaks like this are few and far between.
One of the toughest trades is picking a top. I’m not saying the streak is over, but it’s nearing, and based on the size of the move up, we could see a few down days. I want to sell the rallies, but I’m worried about getting bushwhacked by positive US/China tariff headlines.
That said, I think the ES streak is heading into no man’s land. Maybe there are a few more up days, but the index markets are long in the tooth. Maybe it’s time for a small 0DTE put.
MiM and Daily Recap
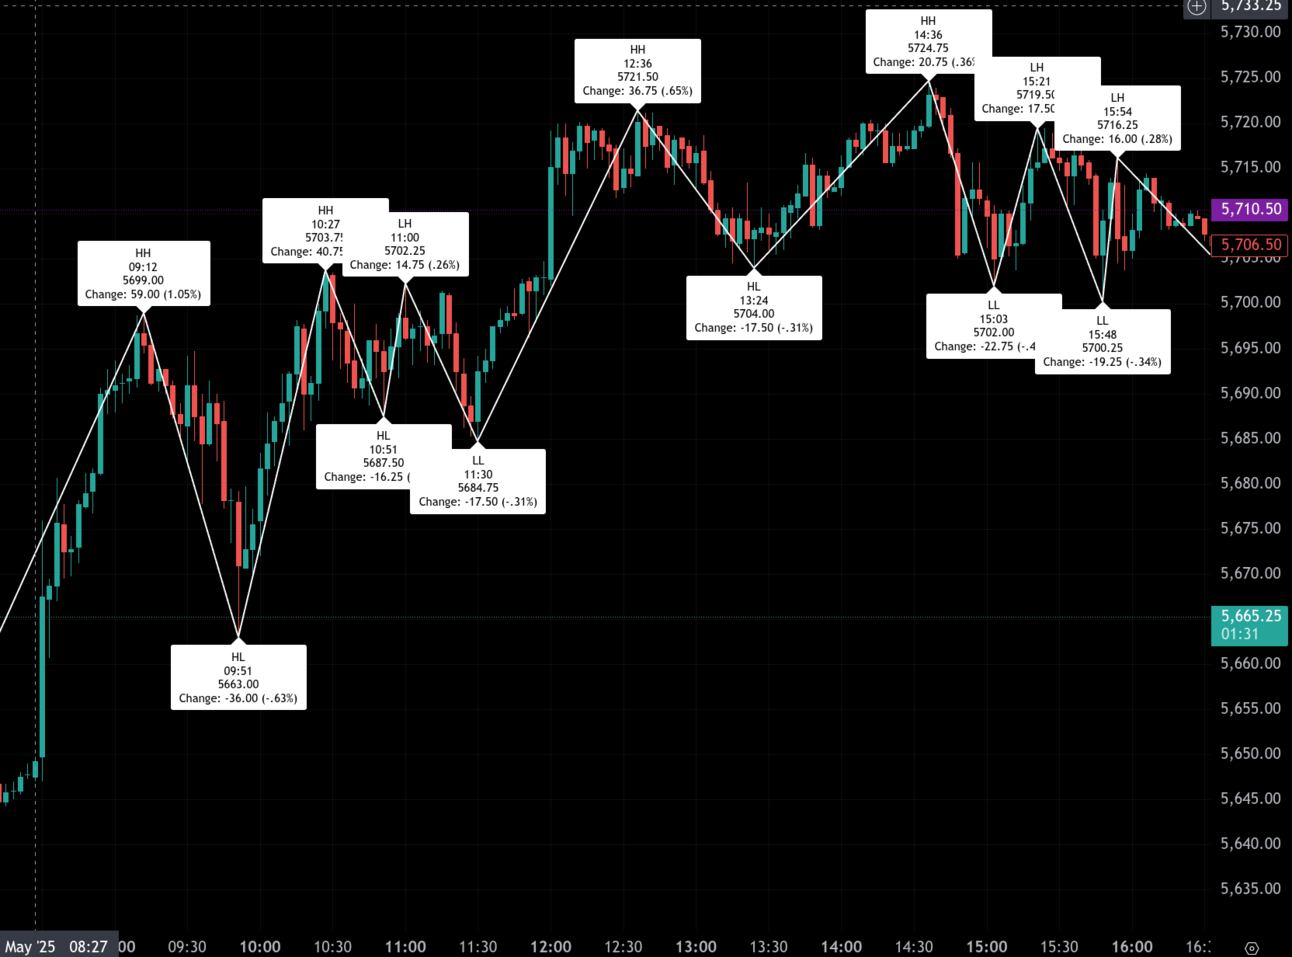
The S&P 500 futures (ES) ended the week with a strong upward tone, kicking off in the Globex session at 5608.50. Overnight high and low were 5699 and 5601, a 98-point trading range. After a dip to 5640.00 at 7:33 AM, bulls took control and drove the market higher into the regular session. By 9:12 AM, ES had reached 5699.00, marking a 59-point gain from the prior swing low.
However, that morning strength saw a quick reversal as sellers pressed the market to 5663.00 by 9:51 AM (after the 9:30 open of 5686.50), a drop of 36 points (-0.63%). A rebound attempt followed, peaking at 5703.75 at 10:27 AM before retreating again to 5687.50 at 10:51 AM. This stair-step action continued with a lower high at 5702.25 by 11:00 AM and a subsequent drop to the morning’s deepest low of 5684.75 at 11:30 AM.
Midday trade turned constructive. A strong rally unfolded into 12:36 PM with ES printing a high of 5721.50—up 36.75 points (+0.65%) from the prior low. The move lost steam into early afternoon, sliding to 5704.00 at 1:24 PM. From there, another advance emerged, topping out at 5724.75 at 2:36 PM, just shy of the midday high.
The late day was characterized by rotation and a bearish tilt. Lower highs were marked at 5719.50 at 3:51 PM and 5716.25 at 3:54 PM. Price sagged into a lower low of 5706.00 at 4:03 PM, the regular session closed reflecting a modest 19.50-point gain (+0.34%) from the session open, and a robust 81.00-point advance (+1.44%) from the previous cash close. The final cleanup hour added a slight bump to close at 5710.50.
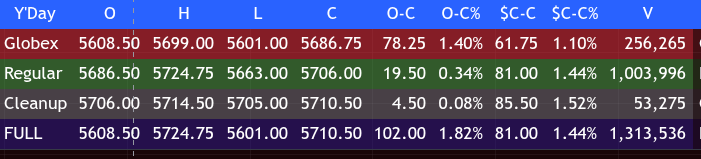
Volume was solid with 1,003,996 contracts traded in the regular session and a total session volume of 1.31 million contracts.
Monday’s tone was net bullish, supported by a strong Globex rally and constructive cash-session follow-through. The Globex session led with a 78.25-point move (+1.40%), while the full session tallied a 102-point gain from open to close. The strongest upward impulse occurred before the open, setting the tone for the day.
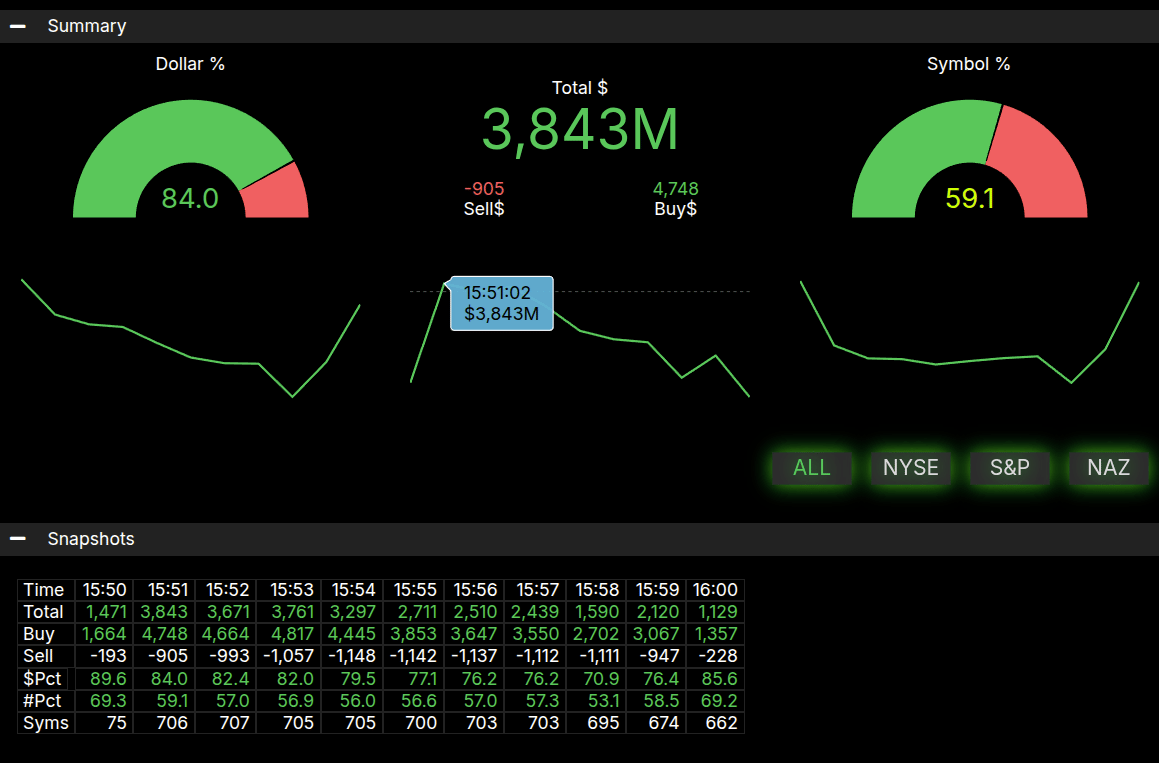
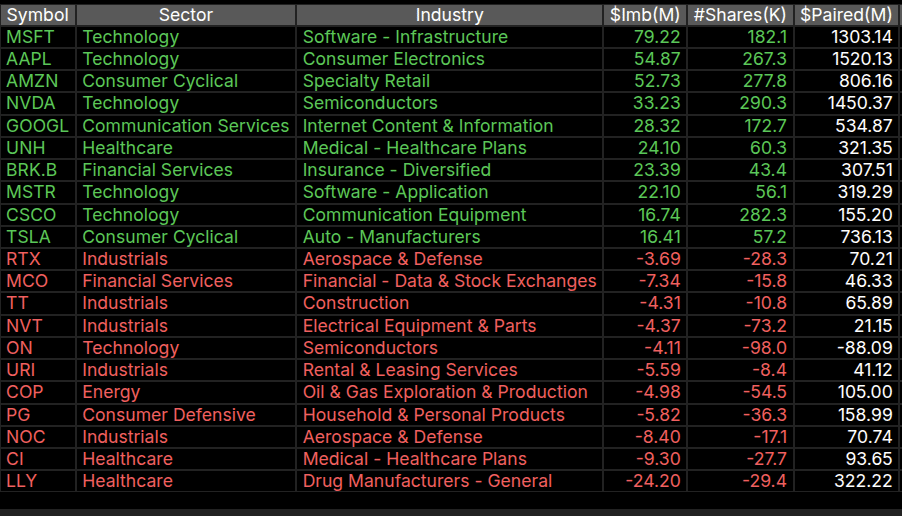
The Market-on-Close (MOC) imbalance leaned to the buy side, though not decisively. At 3:51 PM, total paired-off imbalance dollars peaked at $3.843B, with $4.748B on the buy side versus $905M to sell. However, the symbol imbalance was more neutral, ending at 59.1% to the buy side, below the ±66% threshold typically associated with strong directional flows. While dollar-weighted interest suggested buyers remained active into the bell, the symbol mix showed less conviction, limiting the late-day lift.
Despite some intraday back-and-forth, bulls maintained the edge, particularly with strong early session momentum and a closing imbalance that favored further accumulation. With the ES settling 81 points higher from the previous day, the overall structure remains upward-biased heading into Tuesday’s session.
Technical Edge
Fair Values for May 5, 2025:
-
SP: 21.1
-
NQ: 89.21
-
Dow: 102.15
Daily Breadth Data 📊
-
For Friday, May 2, 2025
-
NYSE Breadth: 85% Upside Volume
-
Nasdaq Breadth: 74% Upside Volume
-
Total Breadth: 80% Upside Volume
-
NYSE Advance/Decline: 82% Advance
-
Nasdaq Advance/Decline: 73% Advance
-
Total Advance/Decline: 77% Advance
-
NYSE New Highs/New Lows: 58 / 24
-
Nasdaq New Highs/New Lows: 115 / 51
-
NYSE TRIN: 0.98
-
Nasdaq TRIN: 0.96
-
Weekly Breadth Data 📈
-
For the Week Ending May 2, 2025
-
NYSE Breadth: 59% Upside Volume
-
Nasdaq Breadth: 69% Upside Volume
-
Total Breadth: 65% Upside Volume
-
NYSE Advance/Decline: 72% Advance
-
Nasdaq Advance/Decline: 67% Advance
-
Total Advance/Decline: 70% Advance
-
NYSE New Highs/New Lows: 96 / 72
-
Nasdaq New Highs/New Lows: 215 / 216
-
NYSE TRIN: 0.93
-
Nasdaq TRIN: 0.87
-
Room Summaries:
Polaris Trading Group Summary Friday, May 2, 2025
Friday’s trading session in the PTG Room, led by PTGDavid, unfolded with a clear long bias anchored around strong economic data and technical alignment. Despite a slow grind through the morning, the day delivered a decisive bullish move, culminating in multiple target hits and an energized finish.
Key Events & Trades:
-
Pre-Market Setup:
David highlighted early that bulls were in control following the better-than-expected April payrolls report (177K vs 138K expected), and recommended staying aligned with the long side on dips. -
Technical Anchors:
-
VWAP and 5685 served as key support gauges.
-
Focus was on 5710 as a “Liberation Day” target, called out early (10:16 AM).
-
Emphasis on respecting dominant market force—Primary Directive: Stay in alignment.
-
-
Key Execution & Targets Hit:
-
David emphasized “Buy Response” trades off VWAP and first touches—these were high-probability plays.
-
5710 target hit at 12:01 PM, accompanied by a celebratory “BOOOOOOOM” and confirmation of target fulfillment. This was a major highlight of the day.
-
Trade sequence included A10 A4 entry with runners, resulting in clean profit.
-
Afternoon follow-through pushed for the final CD3 target at 5734.50, which became the stretch goal.
-
-
Support Held:
-
Price dipped back to the 5700–5705 zone multiple times in the afternoon, and each time support held firmly, reaffirming the bullish stance.
-
The late session MOC (Market On Close) Buy Imbalance of $4 Billion confirmed institutional interest and helped drive a final push.
-
Lessons & Takeaways:
-
Alignment is Everything:
David reiterated the importance of following the dominant force. Shorts were discouraged, and those who stayed long on dips were rewarded. -
Patience in a Grinder:
The morning session lacked “meat on the bone,” but patient traders were rewarded when the market finally broke through 5700 resistance. -
Preparation + Execution:
Clear targets (like 5710) were set early, and the team stayed focused. The 3-Day Super Cycle concept played out once again, reinforcing repeatable patterns in the PTG method.
Tone of the Room:
Supportive, celebratory, and focused. Multiple traders engaged, and there was camaraderie as David guided the room through setups and victories. Moments of humor and motivation lightened the intensity of the grind.
Final Word:
A textbook PTG day—bulls in control, targets achieved, and alignment rewarded. Traders who followed the plan and stayed patient walked away with solid gains and reinforced confidence in the process.
DTG Room Preview – Monday, May 5, 2025
-
Markets & Macro:
-
S&P 500 posted its strongest weekly streak since 2004, erasing recent losses.
-
Rally driven by a strong April jobs report and optimism around renewed US-China trade talks.
-
Fed decision Wednesday could challenge momentum; no rate changes expected, but economic signals are mixed.
-
-
Berkshire Hathaway:
-
Shares hit an all-time high Friday, now up 17% YTD.
-
Warren Buffett suggests Greg Abel as successor at annual meeting.
-
Berkshire is now the 7th largest S&P 500 company with a $1.1T market cap.
-
-
Corporate Earnings:
-
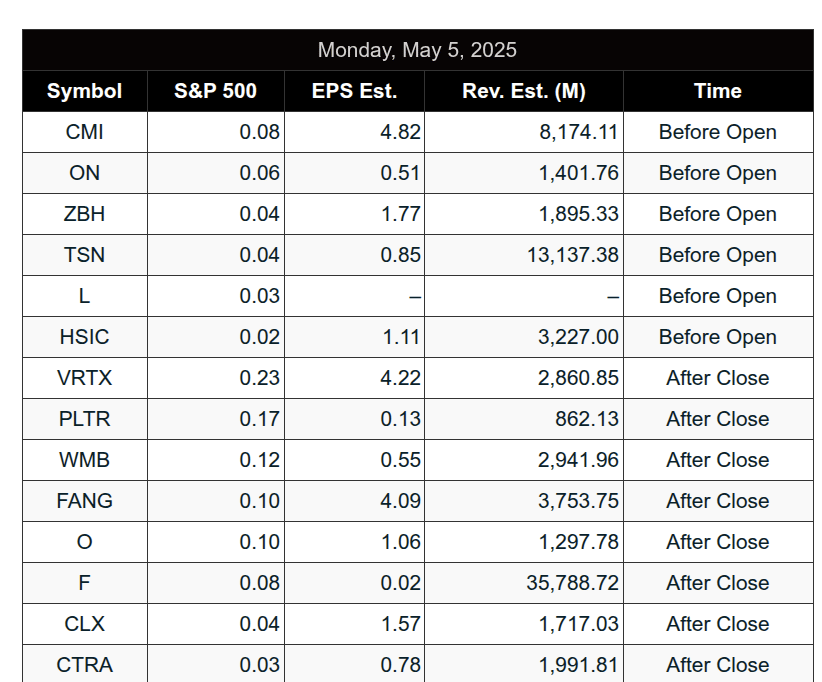
Key reports today: Ford (F), Palantir (PLTR), Disney (DIS), AMD (AMD).
-
Premarket earnings include ARES, BNTX, CAN, Cummins (CMI), Tyson Foods (TSN), and more.
-
After-hours reports from names like VRTX, CLX, WMB, and others.
-
Analysts have lowered S&P 500 EPS estimates by just 2.4%, indicating cautious optimism.
-
-
Other Highlights:
-
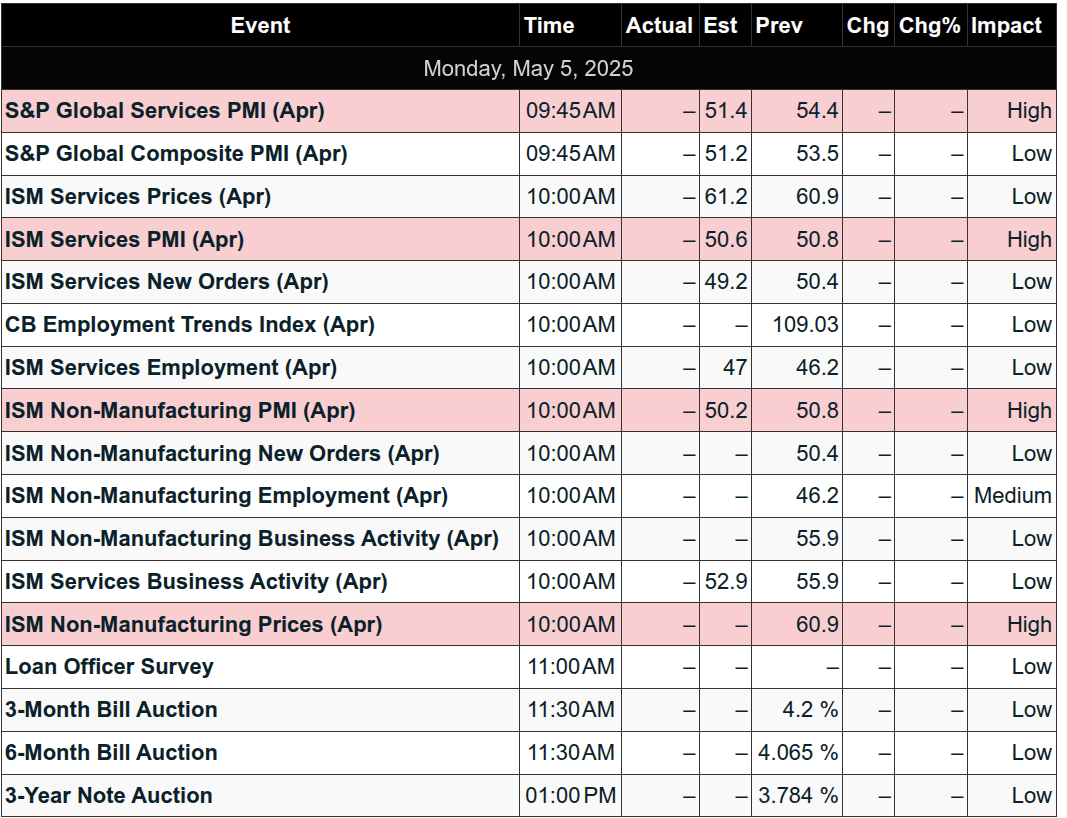
Economic data today: S&P Global Services PMI (9:45am ET), ISM Services PMI (10:00am ET).
-
Volatility ticked up with Friday’s move; ES 5-day ADR now 110.50 points.
-
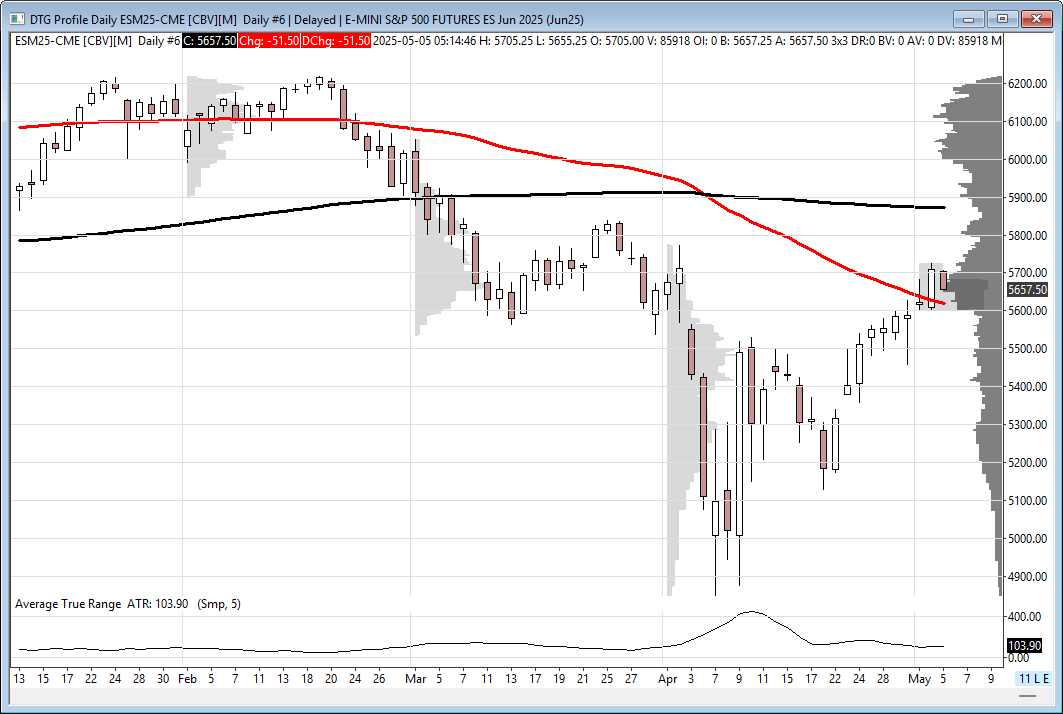
ES continues climbing short-term uptrend channels; 50-day MA at 5618.75 in focus.
-
No significant overnight whale activity noted.
-
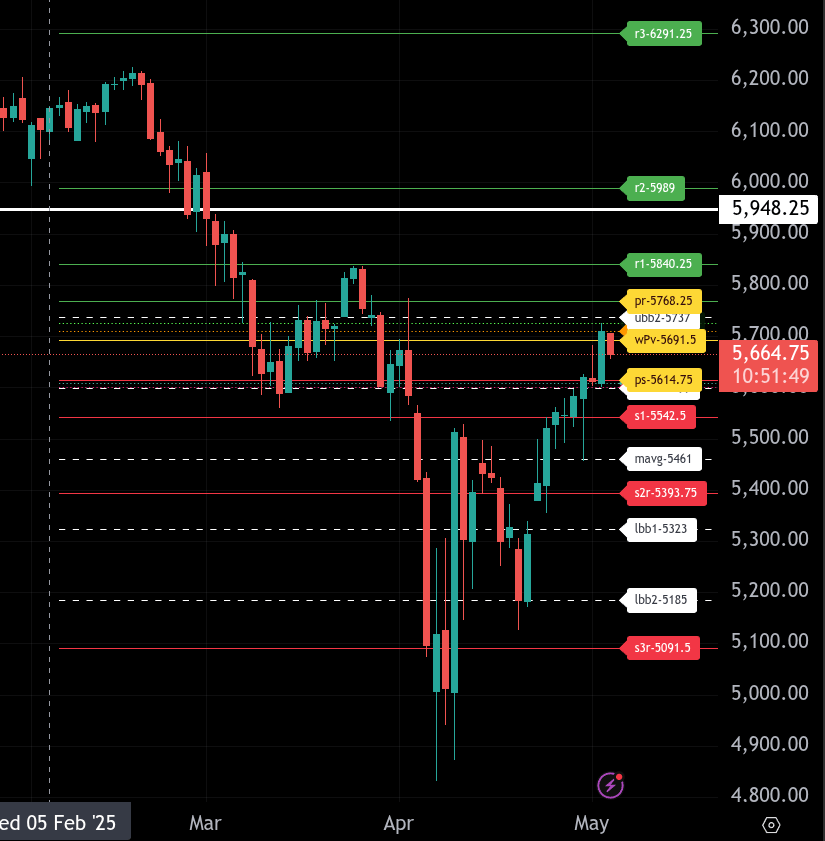
ES

The bull/bear line for ES is at 5691.50. This level marks the key pivot for sentiment today. Trading below this level suggests a bearish bias, and bulls must reclaim it to regain control of the trend.
Currently, ES is trading around 5664.00 during the Globex session, which is below the bull/bear line and reflects continued weakness after Friday’s close. If this downside momentum persists, look for price to target the lower intraday range level at 5614.75. A breakdown below that would open the door for a test of deeper support at 5608.25 and then 5599.00. The last major support level is down at 5542.50.
On the upside, any recovery attempt must first retake 5691.50. If bulls can sustain trade above that level, then 5710.50 becomes the next upside hurdle, followed by 5724.75. The upper intraday range target is at 5768.25, and if that is breached, the next resistance comes in at 5840.25.
Until 5691.50 is recovered, the short-term bias remains bearish. Watch for potential reversals or failed bounce attempts near key resistance levels during the regular session.
NQ
The bull/bear line for the NQ is at 20,128. This is the key pivot level for today. If NQ can stay above this line, bullish momentum may resume. However, as of the current Globex session, NQ is trading near 20,002.75, which places it below the bull/bear line and suggests bearish pressure heading into the open.
The upper intraday range target is 20,465. If bulls can reclaim 20,128 and hold, a push toward 20,204.50, then 20,276.75, 20,349.50, and potentially the full target at 20,465 is possible.
The lower intraday range target is 19,791. If NQ remains below 20,128, and especially if it breaks under 19,749.50 (pl), look for potential continuation down to 19,791, then possibly 19,473.75.
For today, the market bias is bearish below 20,128. Bulls need to reclaim and sustain trade above that level to neutralize the selling and shift the tone back to the upside.
Calendars
Economic
Important events for the rest of the week:
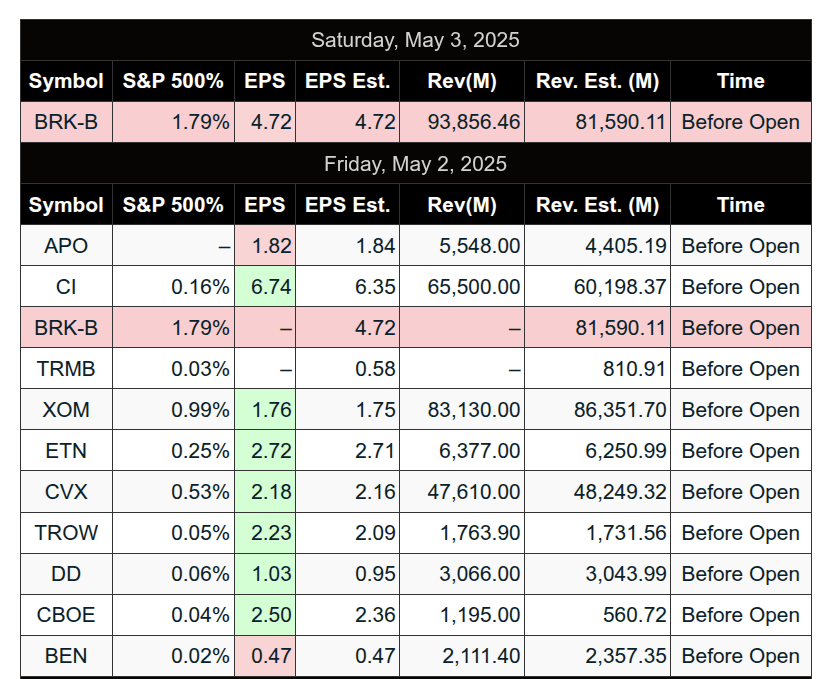
S&P 500 Earnings
Recent
Affiliate Disclosure: This newsletter may contain affiliate links, which means we may earn a commission if you click through and make a purchase. This comes at no additional cost to you and helps us continue providing valuable content. We only recommend products or services we genuinely believe in. Thank you for your support!
Disclaimer: Charts and analysis are for discussion and education purposes only. I am not a financial advisor, do not give financial advice and am not recommending the buying or selling of any security.
Remember: Not all setups will trigger. Not all setups will be profitable. Not all setups should be taken. These are simply the setups that I have put together for years on my own and what I watch as part of my own “game plan” coming into each day. Good luck!
This post goes out as an email to our subscribers every day and is posted for free here around 2 PM ET. To get your real-time copy, sign up for the free or premium version here: Opening Print Subscribe.
Comments are closed