This post goes out as an email to our subscribers every day and is posted for free here around 2 PM ET. To get your real-time copy, sign up for the free or premium version here: Opening Print Subscribe.
S&P 500: Money Makes The World Go Round
Follow @MrTopStep on Twitter and please share if you find our work valuable!
Our View
How does the S&P resolve the highest yields since 2007? The markets do a one-day sell-off and then back-and-fill, open lower and rally. It’s exactly like I said — the S&P has been making good out of bad news.
It doesn’t really matter what you or I think, because U.S. investors are shoving money back into the stock market at a record pace. In the last three weeks, U.S. stock buyers have bought $48 billion in stock, and we saw some of that recently when the NYSE 3:50 imbalance meter bought over $16 billion over just a few days. When you have this type of non-stop money flow and low volume, it’s hard to fight — even after an over 20% rally.
For the week ending May 16, 2025: ETFs had $31.29 billion in net issuance, offsetting $2.69 billion in mutual fund outflows, leading to $28.60 billion in combined inflows. Leading the ETF inflows list once again was the Vanguard S&P 500 ETF (VOO), which pulled in $4.8 billion. The fund has now amassed a staggering $62.5 billion in inflows for the year, by far the most of any ETF.
In second place was the Invesco QQQ Trust (QQQ), with $4.6 billion of inflows. The Nasdaq-100 has mirrored the broader market’s rebound and is now up 2% year to date, after being down 18.5% at its trough last month.
Year-to-date inflows have now topped $400 billion, putting 2025 on track to be one of the biggest years ever for ETF demand, attracting $146 billion, more than double the combined inflows to Europe, Japan, China, and India. An estimated $50 billion to $100 billion moved from the U.S. stock market to European equities in 2025, based on reported outflows ($42.7 billion confirmed through May 9).
Like historical stats, following the stock market inflows and outflows has always been helpful in determining direction — and clearly, the numbers above prove that.
Late in the day, the ES and NQ chopped in a narrow range, traded up to a new high at 5895 as NVDA and a few other tech stocks fell, and the ES sold off 40 points. I think the above flows are a countersink to the falling bond and note prices, but what if they continue to fall, and yields continue to rise?
@CMEGroup Memorial Day Holiday Schedule
Great Goldman Sachs article on Gold below:
Why gold prices are predicted to rise to record highs

Gold prices have broken a series of records over the past year, and the rally is expected to continue. Goldman Sachs Research forecasts that gold will climb to $3,700 per troy ounce by the end of 2025, up from $3,326 on May 23.
The surge in 2025 has been fueled by renewed investor appetite and a long-term structural shift in central bank demand.
Additional momentum has come from uncertainty surrounding the Trump administration’s tariffs on major trading partners. Since March, investors have increasingly turned to gold, citing economic concerns and market volatility.
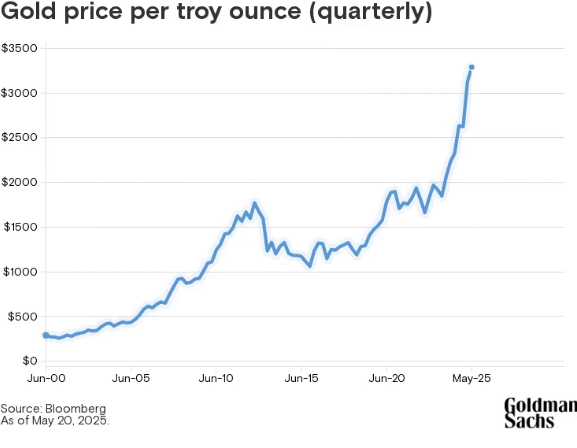
“Whenever there’s a lot of uncertainty, traders temporarily park their money in gold. When there’s clarity, gold prices tend to drop again because traders know what to do with their money,” says Lina Thomas, a commodities strategist at Goldman Sachs Research.
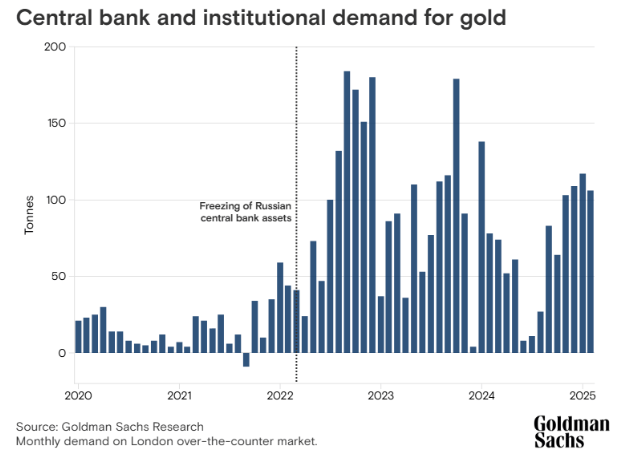
Emerging market central banks are increasing their gold holdings
Over the longer term, Thomas expects central banks—especially in emerging markets—to continue supporting gold prices. Russia’s invasion of Ukraine and the subsequent freezing of Russia’s foreign assets by Western nations marked a significant shift. Since 2022, these central banks have increased their gold purchases fivefold, according to Goldman Sachs Research.
Developed market central banks tend to have larger gold holdings,
partly as a legacy of the gold standard era when sovereign money supplies were linked to the commodity, leaving them with a higher proportion of their reserve assets in gold.
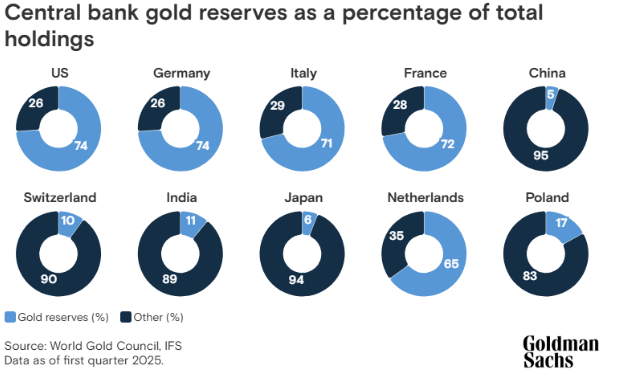
For example, China holds less than 10% of its reserves in gold, compared with about 70% or more for the US, Germany, France, and Italy. Foreign currencies make up a larger share of emerging market central bank holdings.
“The global average is roughly 20%, which we view as a plausible medium-term target for large emerging central banks,” says Lina Thomas.
The growing role of gold ETFs
While central bank purchases have been the main force behind rising gold prices in recent years, exchange-traded fund (ETF) holdings are increasingly contributing to demand. ETF holdings typically track interest rates—rising when rates fall—but they tend to overshoot when recession fears increase.
A recession now appears less likely, with signs of progress on trade-policy negotiations. Goldman Sachs economists estimate a 35% chance of a US recession in the next 12 months, down from 45% earlier. Still, in the event of a downturn, gold prices could climb to $3,880 per troy ounce.
“While the key factor since 2022 used to be central bank buying alone, ETF investors are now joining the gold rally,” Thomas notes. “As both compete for the same bullion, we are expecting gold prices to rise even further.”
Our Lean
One of the rotations we have not been talking about has been out of treasuries and into Bitcoin. The net changes over the last 15 sessions show the 30-year bonds have fallen 3.1%, the 10-year note fell 1%, while Bitcoin has risen 13% to new all-time contract highs at $111,986.44 after the Senate voted to advance a bill aimed at regulating stablecoins. This is not a winning spread for the stock market.
Today, I am going to let Rich Miller do the lean. I have spoken about Rich Miller for the last few years and have watched firsthand how the coding of his algorithm has improved by leaps and bounds. Today’s study is titled Pre-Memorial Day Market Study — Historical Edge on the Friday Before Memorial Day.
To learn more about Rich and his service, follow @HandelStats on Twitter or visit his website at HandelStats.com.
Have a great Memorial Day holiday.
📈 Pre-Memorial Day Market Study — Historical Edge on the Friday Before Memorial Day
Overview
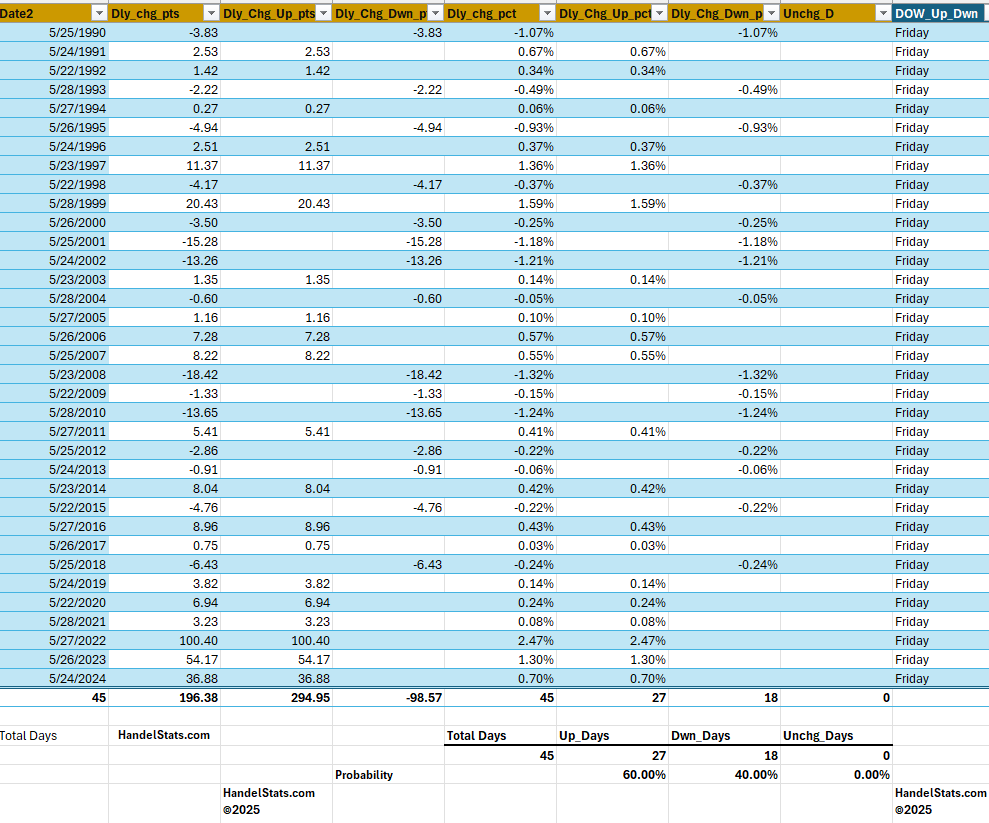
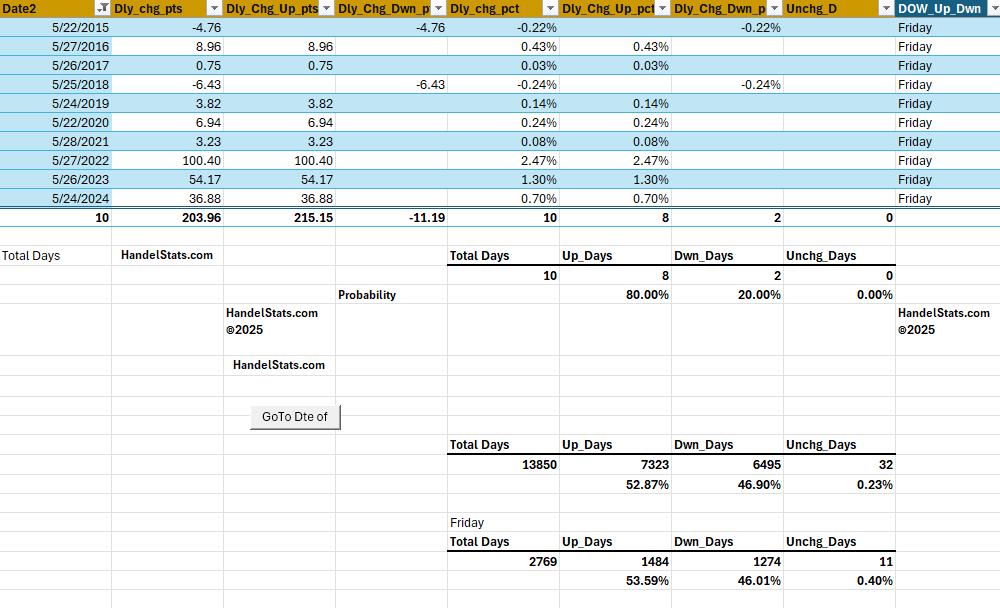
Our latest analysis at HandelStats.com explores market behavior on the Friday before Memorial Day, spanning from 1980 to 2024 — a total of 45 occurrences. We also ran a focused view from 2014 onward to observe recent behavioral trends.
🗓️ Day Before Memorial Day: Historical Performance
Period
Total Days
Up Days
Down Days
Up %
Down %
1980–2024
45
27
18
60.00%
40.00%
2014–2024
10
8
2
80.00%
20.00%
-
The 60% win rate since 1980 already suggests a favorable upward bias.
-
More notably, the last 10 years have shown a powerful 80% tendency toward gains.
📊 How This Compares to Normal Fridays and All Trading Days
Category
Up %
Down %
Unchanged %
All Trading Days
52.87%
46.90%
0.23%
All Fridays
53.59%
46.01%
0.40%
Friday Before Memorial Day (1980–)
60.00%
40.00%
0.00%
Friday Before Memorial Day (2014–)
80.00%
20.00%
0.00%
The Friday before Memorial Day outperforms the average Friday and significantly outpaces the broader market’s daily probabilities — especially in recent years.
📘 Interpretation
This may reflect:
-
Pre-holiday optimism or “risk-on” trader psychology
-
Lightened volume and institutional positioning
-
Tactical bias among quant/systematic models
✅ Final Takeaway
If seasonality matters to your trading strategy, the Friday before Memorial Day is historically a strong bullish setup — particularly over the last decade. While past performance is not a guarantee of future results, this edge may support short-term long exposure or reduced hedging into the extended weekend.
Source: Proprietary research via HandelStats.com
Data through: May 24, 2024
Method: Daily change (points and percentage), categorized by up/down/unchanged across historical calendar dates.
MiM and Daily Recap
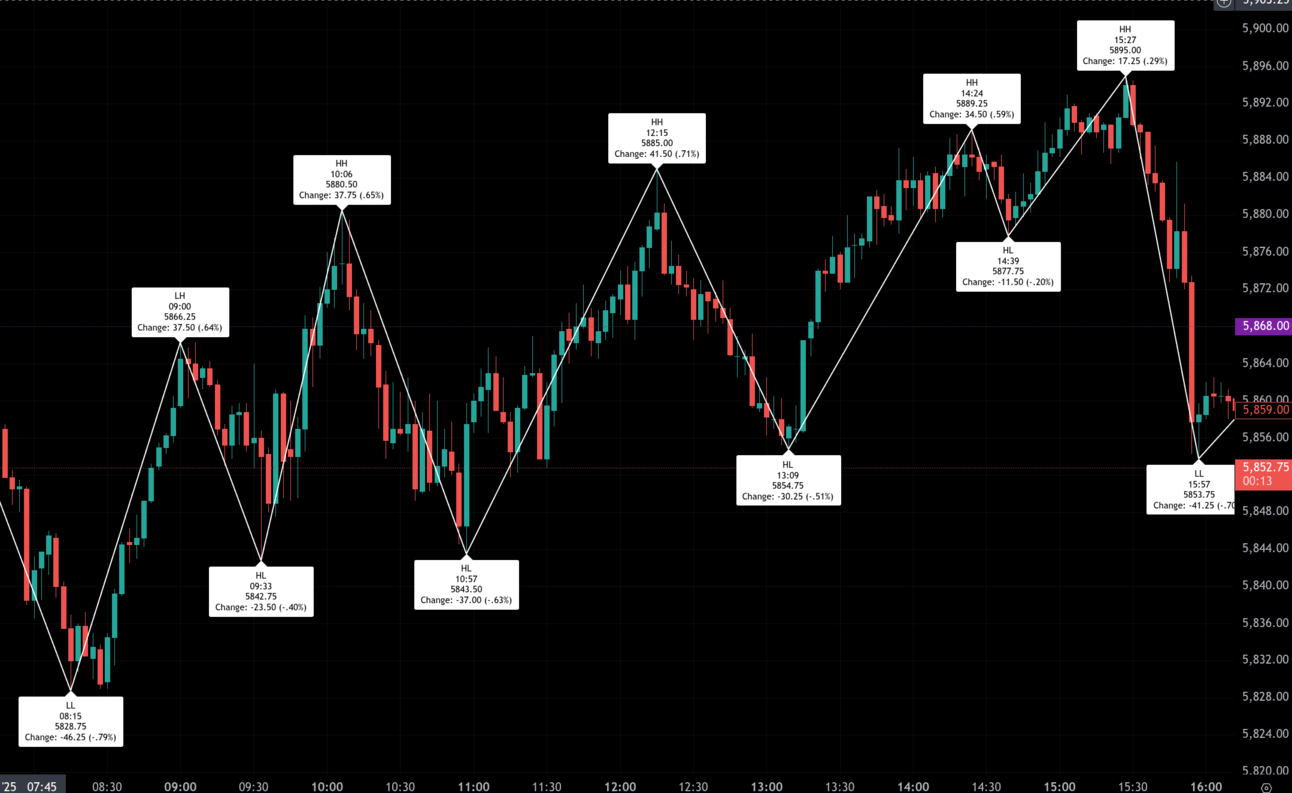
The Thursday ES session began on a weak note, with overnight Globex pressure dragging prices to a premarket low of 5828.75 at 8:15 AM. This marked a 46.25-point decline (-0.79%) from the previous day’s settlement of 5875.00. Buyers stepped in early, driving a sharp recovery into the 9:00 AM hour, where the first significant lower high formed at 5866.25, up 37.50 points (+0.64%) from the low.
However, the cash session open at 5855.50 brought some hesitation. A quick retreat to 5842.75 at 9:33 AM resulted in a 23.50-point pullback (-0.40%), but the market regained footing and rallied toward a new morning high of 5880.50 at 10:06 AM—another 37.75-point surge (+0.65%).
A deeper decline followed as sellers pushed price back to 5843.50 by 10:57 AM, a 37.00-point loss (-0.63%). From there, a more sustained bullish impulse took hold, pushing ES to a fresh intraday high of 5885.00 at 12:15 PM, a 41.50-point move (+0.71%).
That rally lost steam shortly after, giving way to a minor retracement to 5854.75 at 1:09 PM before bulls pressed onward again. A new high of 5892.25 was tagged at 2:24 PM, marking a 34.50-point rally (+0.59%). A slight dip into 2:39 PM saw price ease to 5877.75 (-11.50 pts, -0.20%) before one last burst took ES to the session high of 5895.00 at 3:27 PM. This final advance added 17.25 points (+0.29%).
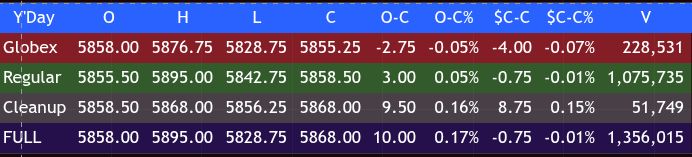
But the strength didn’t hold. Into the final half-hour, a wave of selling pressure emerged, dragging ES sharply down to a session low of 5853.75 at 3:57 PM, down 41.25 points (-0.70%) from the high. The regular session closed at 5855.50, a modest 3.00-point gain from the open (+0.05%), while the full session finished at 5868.00, representing a net change of +10.00 points (+0.17%) from Wednesday’s close.
Market Tone & Notable Factors
The overall tone was mixed with a bullish tilt through much of the session before a clear shift to selling into the close. While buyers consistently stepped in at higher lows throughout the day, the late breakdown from the 3:27 PM peak of 5895.00 into the 3:57 PM low of 5853.75 showed exhaustion and liquidation.
Volume during the regular session was solid at 1,075,735 contracts, with the full session totaling 1,356,015. This suggests strong participation, especially in the final hour.
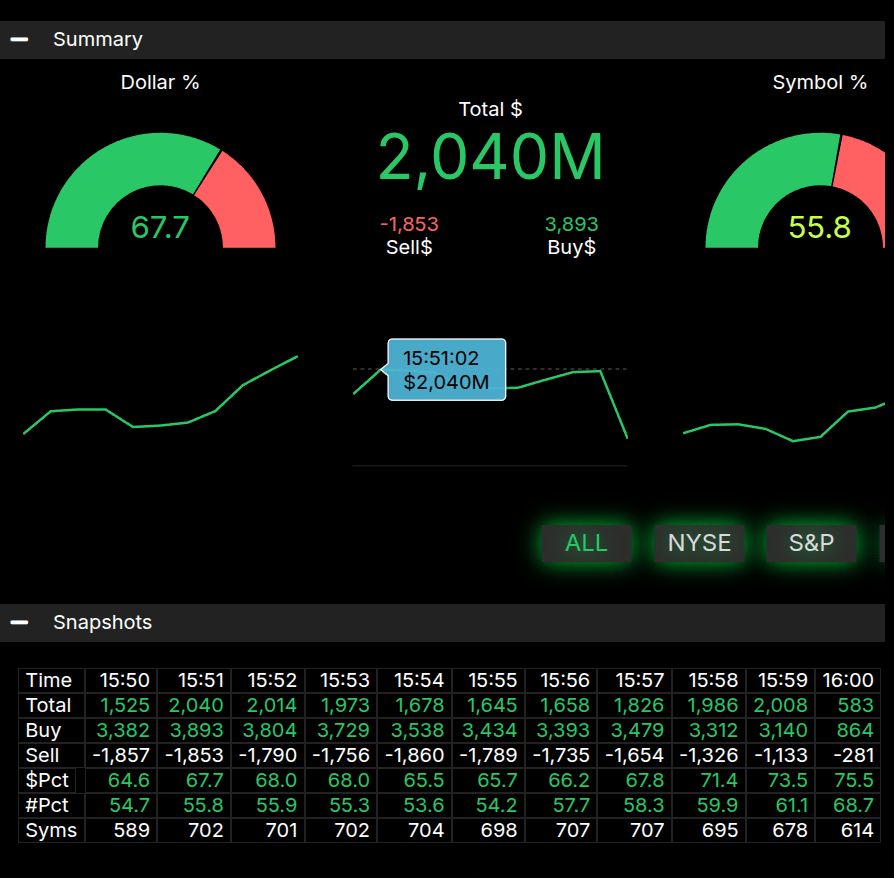
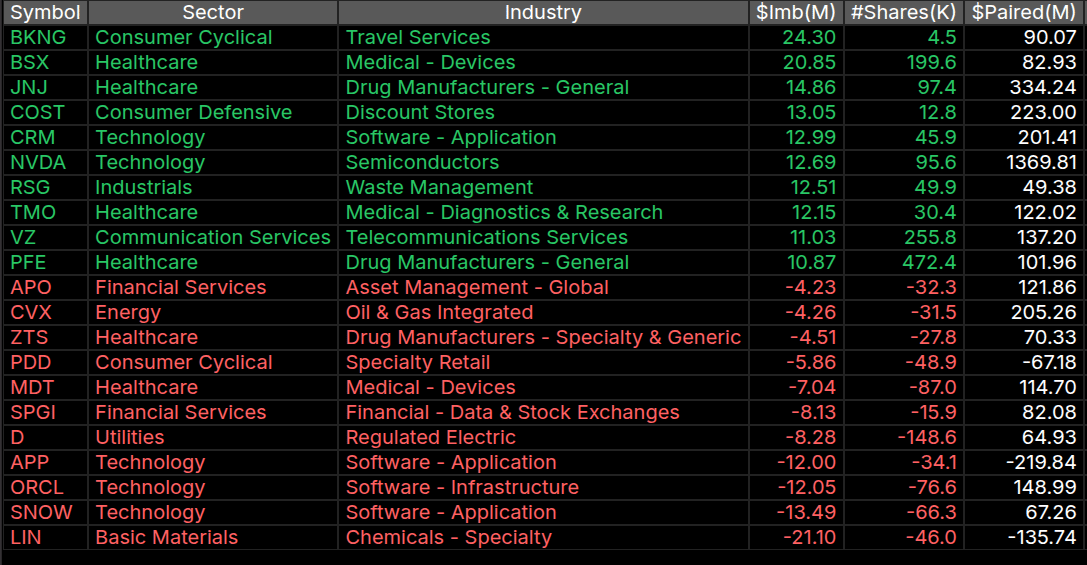
MOC imbalance data showed a notable buy bias with 67.7% of dollar flow on the buy side, reaching a $2.04B imbalance at 3:51 PM. While the percentage of symbols on the buy side only reached 55.8%, the dollar imbalance exceeded the ±66% threshold, signaling strong institutional buy pressure. However, this flow failed to hold prices up, likely because much of the buying occurred before the final wave of selling hit.
In conclusion, despite positive net changes for the day, the failure to hold gains above 5890 and the sharp drop into the close temper the bullish narrative. With Friday heading into Memorial Day weekend, attention will likely focus on whether buyers can reassert control or if the closing weakness signals further pressure ahead.
Technical Edge
Fair Values for May 23, 2025
-
SP: 15.79
-
NQ: 65.04
-
Dow: 80.18
Daily Breadth Data 📊
For Thursday, May 22, 2025
-
NYSE Breadth: 46% Upside Volume
-
Nasdaq Breadth: 58% Upside Volume
-
Total Breadth: 56% Upside Volume
-
NYSE Advance/Decline: 47% Advance
-
Nasdaq Advance/Decline: 50% Advance
-
Total Advance/Decline: 49% Advance
-
NYSE New Highs/New Lows: 30 / 60
-
Nasdaq New Highs/New Lows: 85 / 125
-
NYSE TRIN: 0.89
-
Nasdaq TRIN: 0.71
Weekly Breadth Data 📈
Week Ending Friday, May 16, 2025
-
NYSE Breadth: 63% Upside Volume
-
Nasdaq Breadth: 67% Upside Volume
-
Total Breadth: 66% Upside Volume
-
NYSE Advance/Decline: 76% Advance
-
Nasdaq Advance/Decline: 71% Advance
-
Total Advance/Decline: 73% Advance
-
NYSE New Highs/New Lows: 175 / 63
-
Nasdaq New Highs/New Lows: 334 / 266
-
NYSE TRIN: 1.76
-
Nasdaq TRIN: 1.20
Guest Posts:
Get instant access to our partners’ real-time market data and insights not available anywhere else. Here is last night’s Founder’s note getting you ready for today’s market and explaining the constraints in yesterday’s market. – MrTopStep
Founder’s Note:
Futures are -30bps ahead of the 3-day weekend. Things were quiet until Trump threatened tariffs on AAPL – when that happened ES lost 20 handles in seconds. Liquidity holes.
No major data is on top for today – and we think traders will still default to wanting to be short vol over the long weekend which should be supportive of stocks – this idea is a bit less strong now given the Trump tweets which sent ES to 10-day lows.
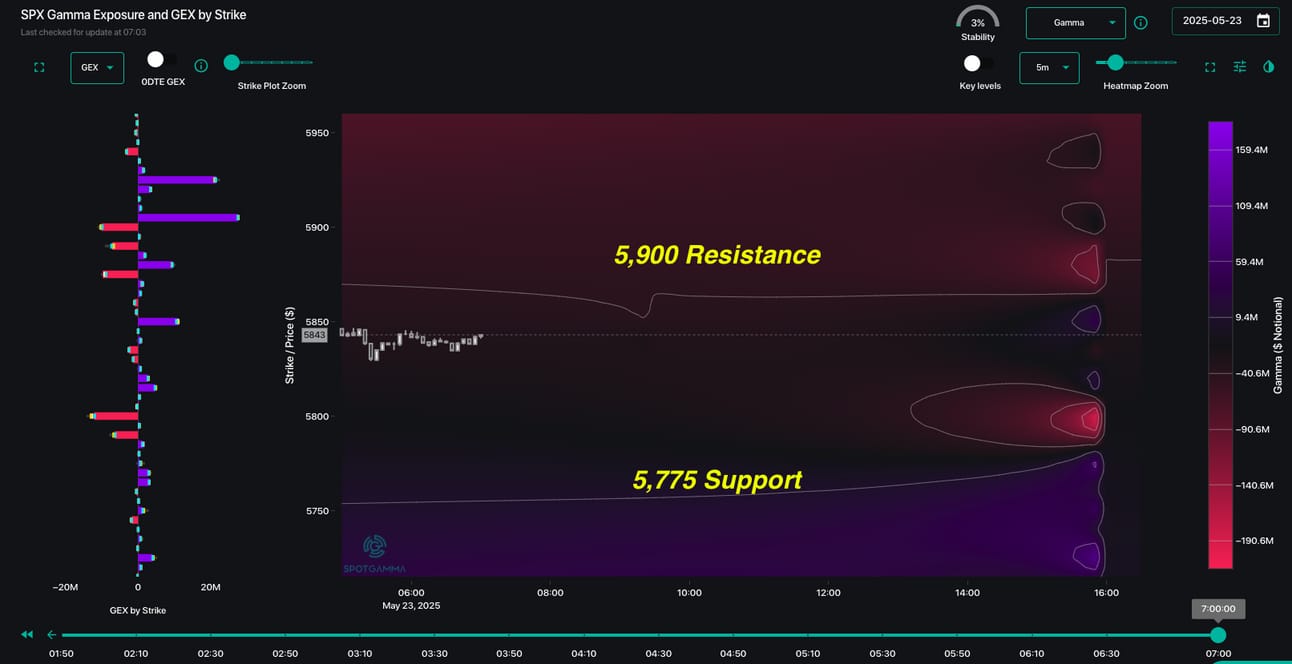
The SPX levels for today look exactly like yesterday: 5,900 area resistance and no major support until 5,775. The 0DTE straddle is also near the same price: $38/65bps. This underpricing of vol (in our opinion) presents risk in an of itself – if the market does not have major support/resistance for 50-60 handles and the SPX thinks the max move is 40, it could lead to a vol short cover which adds some market momentum.
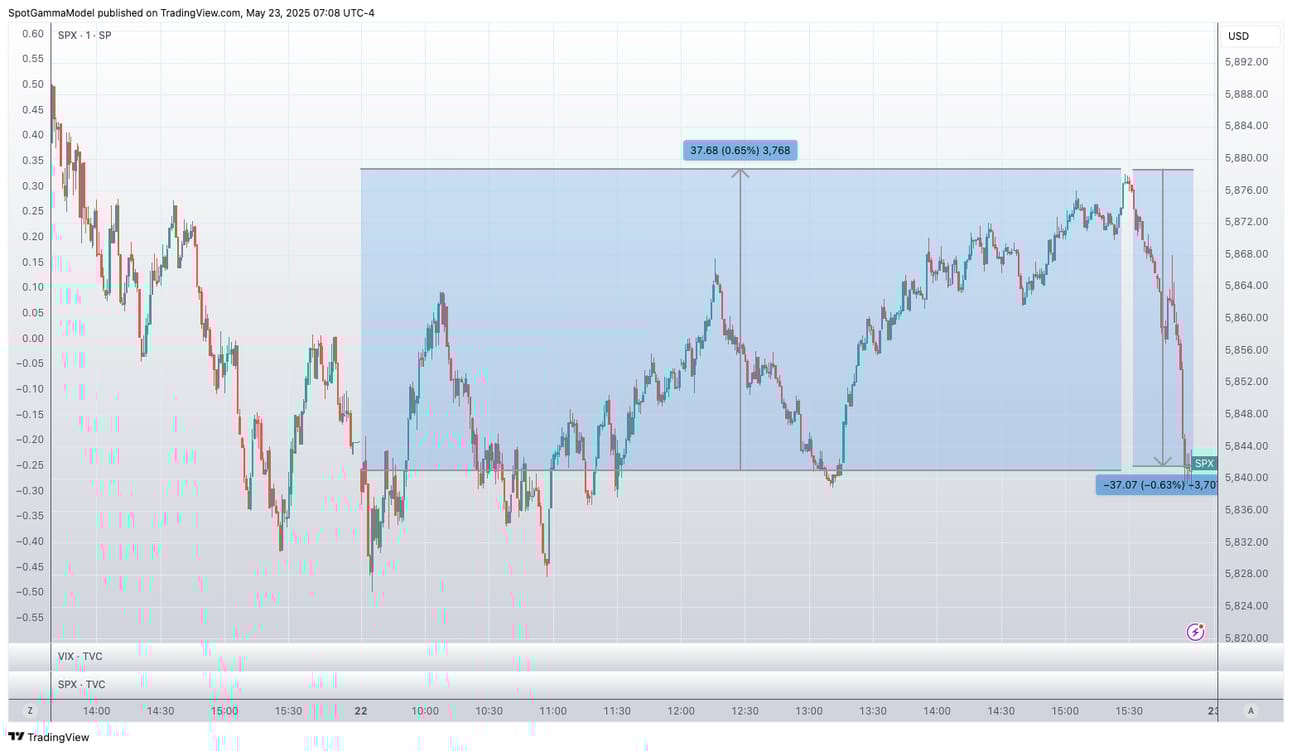
We noted that straddle felt to cheap yesterday, and the SPX rallied to +65bps (the 0DTE straddle price) to intraday highs of 5,877 before collapsing 35 handles in 30 minutes. That ultimately left the SPX exactly unchanged on the day. Two things on this: we don’t think its ironic the market pivoted at the 0DTE straddle price – that seems to happen often – and 2) losing 35 handles in a heartbeat reiterates the liquidity issue (just like this AM futures drop).
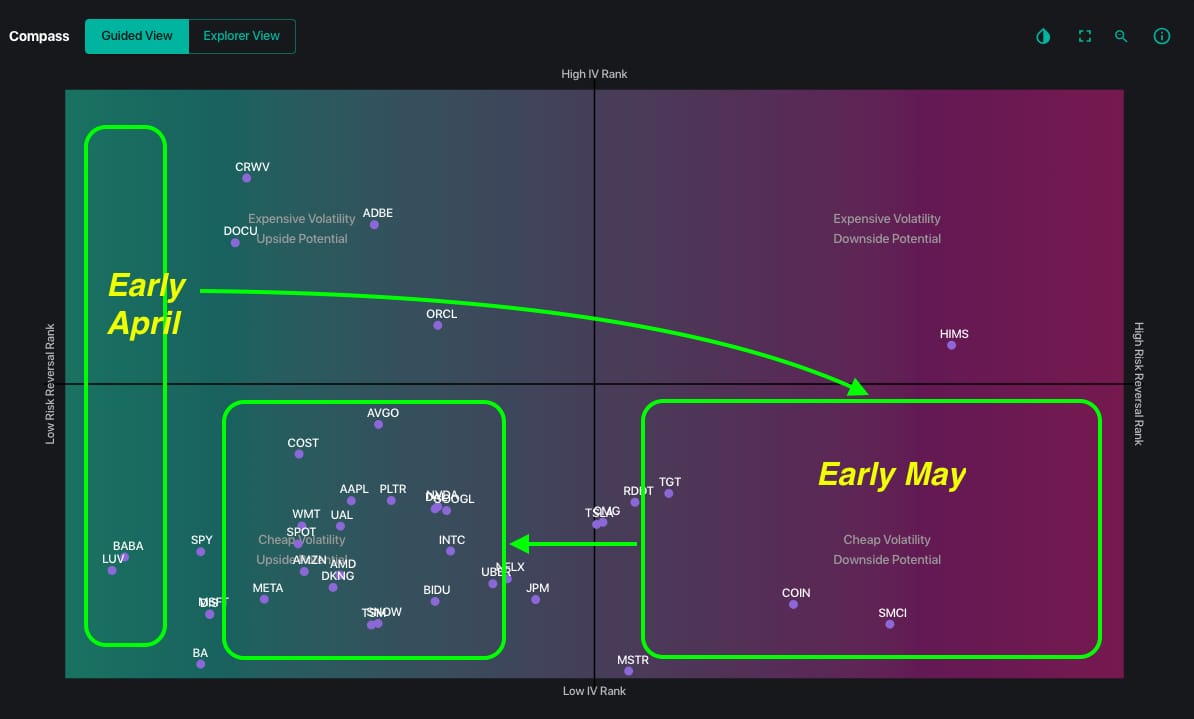
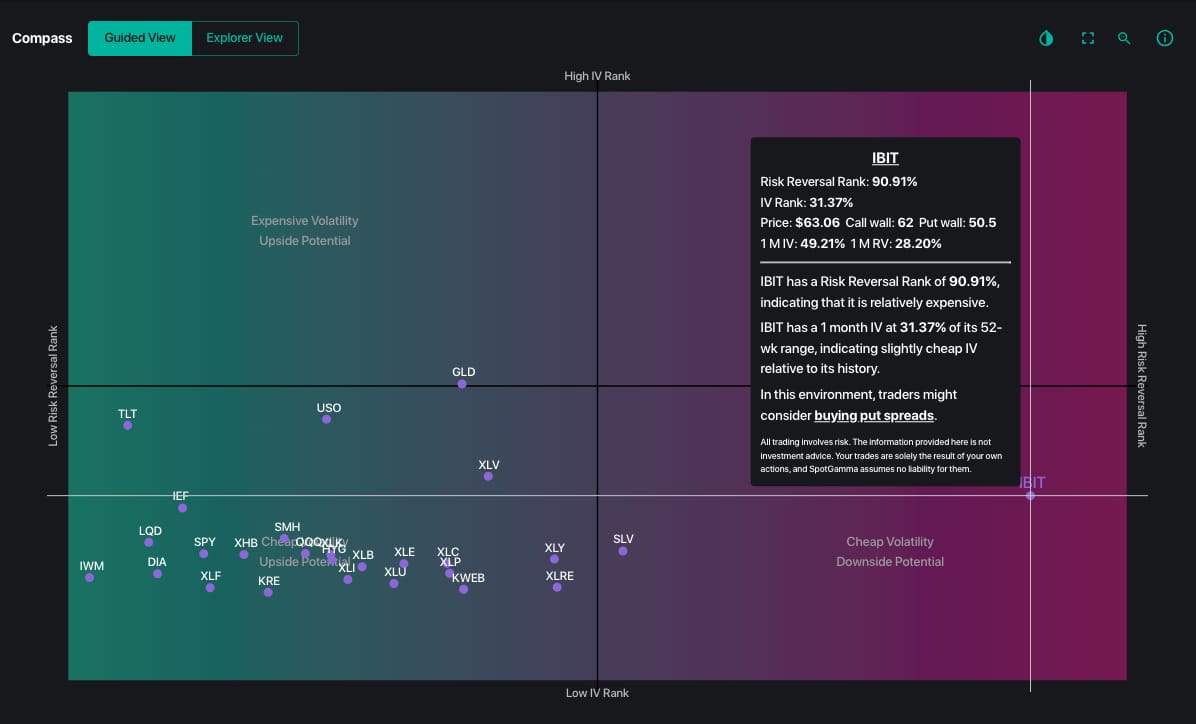
One thing catching our eye is the cooling of call skews, as seen in Compass. In early April we went from very heavy put skews & high IV’s, to low IV’s and high call skews – and now call skews have flattened for many top names. This call skew has come off just from stocks going into OPEX at 3 month highs – and quite frankly many of them are just a whisker away from those highs. This should be welcome news for bulls, as it suggests that re-entering upside exposure is cheaper now vs last week. It does suggest that traders are now less aggressively long, which syncs with the general upside stall-out that came earlier this week.
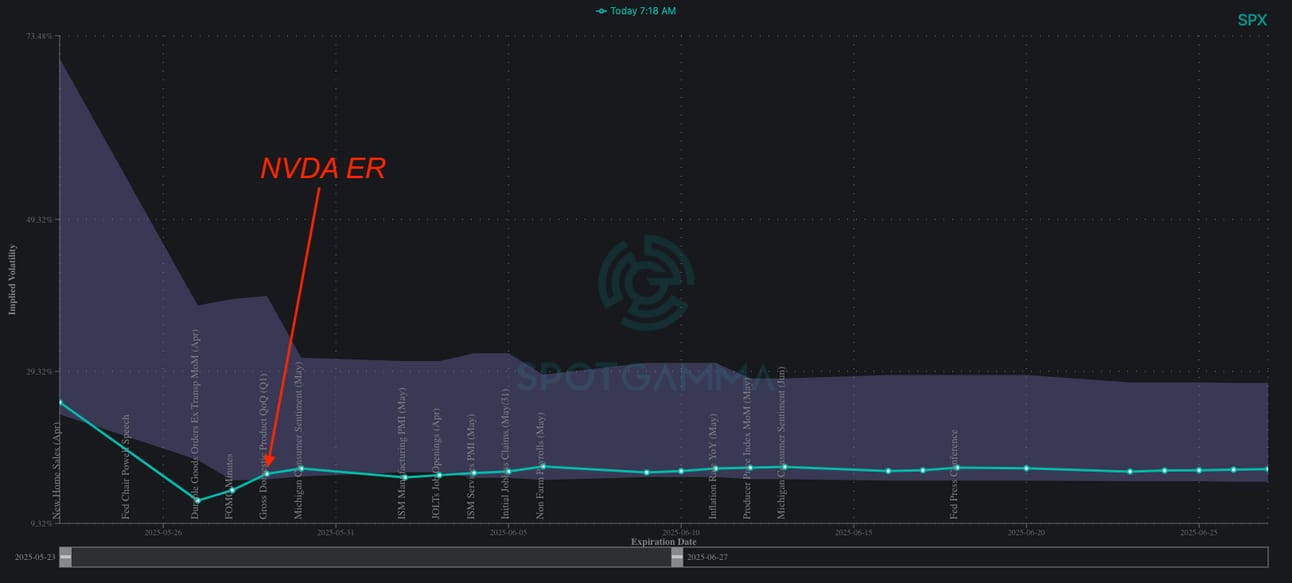
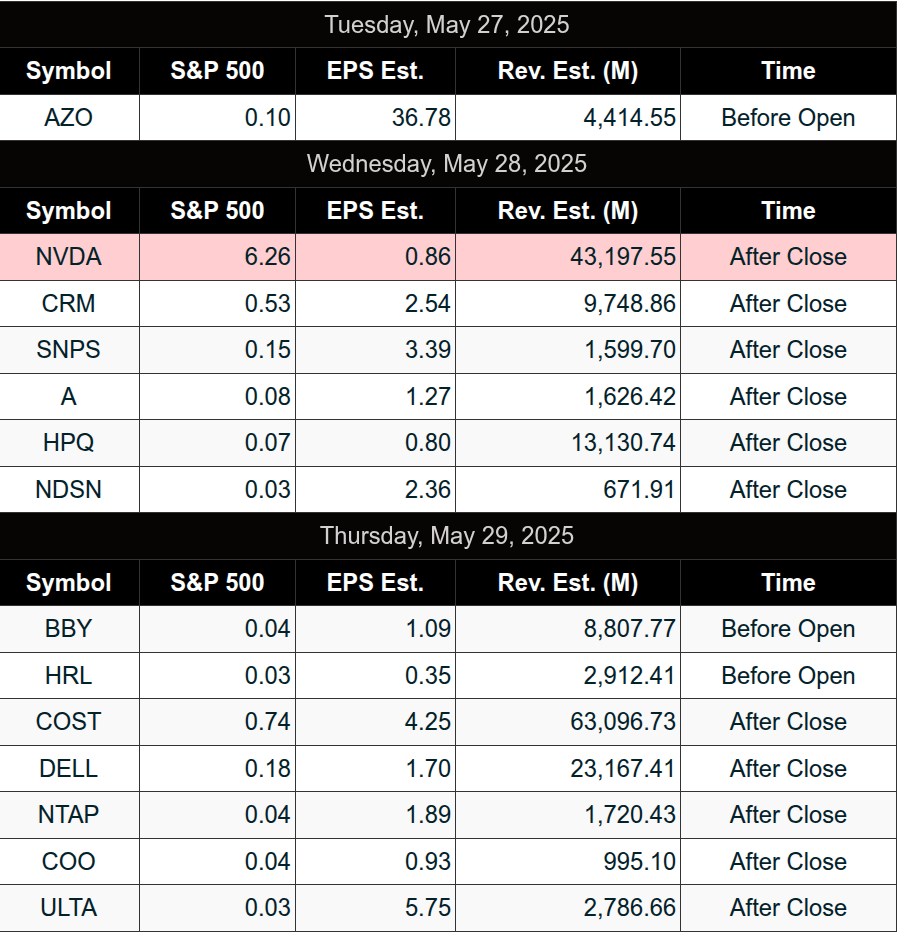
Much of the world is focused on next weeks NVDA earnings which is Wed night. The SPX term structure does seem to have a bit of a kink to it related to the earnings, with ultra low 12% implied vols marked for Tuesday. We will continue to believe these vols are too cheap – be it the pre-NVDA marks or post. This does not mean we want to carry a full short position – but we do want to carry some downside protection. Quite frankly, that downside protection does not have much carry cost (in our opinion), and the cheaper equity calls give better fixed risk ways of playing upside for those that remain bullish. For us – we want to see the SPX regain 5,900 before flipping to a bullish stance.
Last thing – bitcoin. We’ve been tracking the IBIT vols for a few months now, and as bitcoin is breaking to new ATH’s we see the IV rank start to lift. We think this is a bullish construct, as we think that short term highs will come when BTC/IBIT goes “stock up, vol up” resulting in a high IV rank and high call/risk reversal rank. We started to see some of that crypto FOMO percolate yesterday, with many speculative stocks like “Cantor Crypto Ventures” (CEP) rising +10%.
For playing IBIT we like >=1-month call spreads (as per Tuesday), which help to isolate the high call skew cost, but still gets exposure at relative low IV levels.

Get instant access to our partners real-time market data and insights not available anywhere else. Here is last night Founder’s note getting you ready for today’s market and explaining the constraints in yesterday’s market. – MrTopStep
Trading Room News:
Polaris Trading Group Summary – Thursday, May 22, 2025
Yesterday’s session was a textbook example of a Cycle Day 2 (CD2) trading environment with rhythmic two-way action, offering traders both opportunities and valuable lessons across the session.
Morning Session Highlights:
-
Overnight activity met both upper (5870) and lower (5830) DTS targets, setting a balanced tone.
-
PTGDavid outlined key scenarios: Bullish above 5855 aiming for 5875, and Bearish below it toward 5825.
-
Early action saw a “textbook buy response” from the D-LEVEL, reinforced by a 1-min DMI BUY signal. David emphasized structuring trades using RSPR and the OODA loop—stressing thoughtful execution.
-
The CL Open Range Long target 2 was fulfilled, signaling early success.
-
The tone was measured, with traders reminded to use the Rubik’s Trader Cube to determine bias amid range conditions.
Midday Session:
-
The market began showing a lean to the long side, with bulls targeting a clean break and hold above 5875.
-
David guided the team to watch the market’s response to a poor 20Y bond auction—highlighting the importance of macro context.
-
As expected for CD2, action remained within range rhythms, ideal for mean-reversion trades around key levels like Open Range HILO.
Afternoon & Power Hour:
-
Momentum built in the afternoon:
-
Bull Stacker from the 65s launched a powerful bid into the 80s, with the move being sustained above Initial Balance High.
-
David called out the dominant buyers lifting offers and the firm bid through the PUT WALL near 91s.
-
-
Power Hour brought continued bullish action, peaking before a late-day “rug pull” — a rapid reversal into the close.
-
Despite the pullback, it was a well-executed CD2 that followed the expected template nearly perfectly.
-
A strong MOC (Market on Close) Buy imbalance of $1.6B was noted, though price closed near VWAP.
Key Lessons & Tools:
-
Importance of Stacker and Trender indicators for staying aligned with market bias—David repeatedly emphasized them as foundational.
-
Discipline in execution: Clicking only when it matches your predefined rules.
-
Patience and responsiveness in a CD2 environment, using structured tools like the Rubik’s Cube and RSPR methodology.
Looking Ahead:
-
David will be trading only the AM session Friday (doctor’s appointment).
-
Reminder: Monday markets closed.
Overall, the room navigated a classic range-trade day with multiple actionable setups. The real strength came in sticking to structure and letting the day unfold without forcing trades—a hallmark of PTG’s disciplined approach.
DTG Room Preview – Friday, May 23, 2025
-
Markets Reversal: All three major indexes lost gains late Wednesday after the House passed Trump’s revised tax bill, raising debt concerns.
-
Debt & Yields:
-
Moody’s downgrade has heightened focus on long-term Treasuries.
-
The 30-year yield briefly topped 5.1%, a level last seen during the financial crisis.
-
Investors are selling Treasuries amid fears over US fiscal stability – dubbed the “Sell America” trade.
-
-
Fiscal Concerns:
-
Tax bill expected to add over $3 trillion to national debt over 10 years.
-
Total national debt has hit $36 trillion, with public debt near 100% of GDP.
-
Major cuts to Medicare, Social Security, or defense remain politically challenging.
-
-
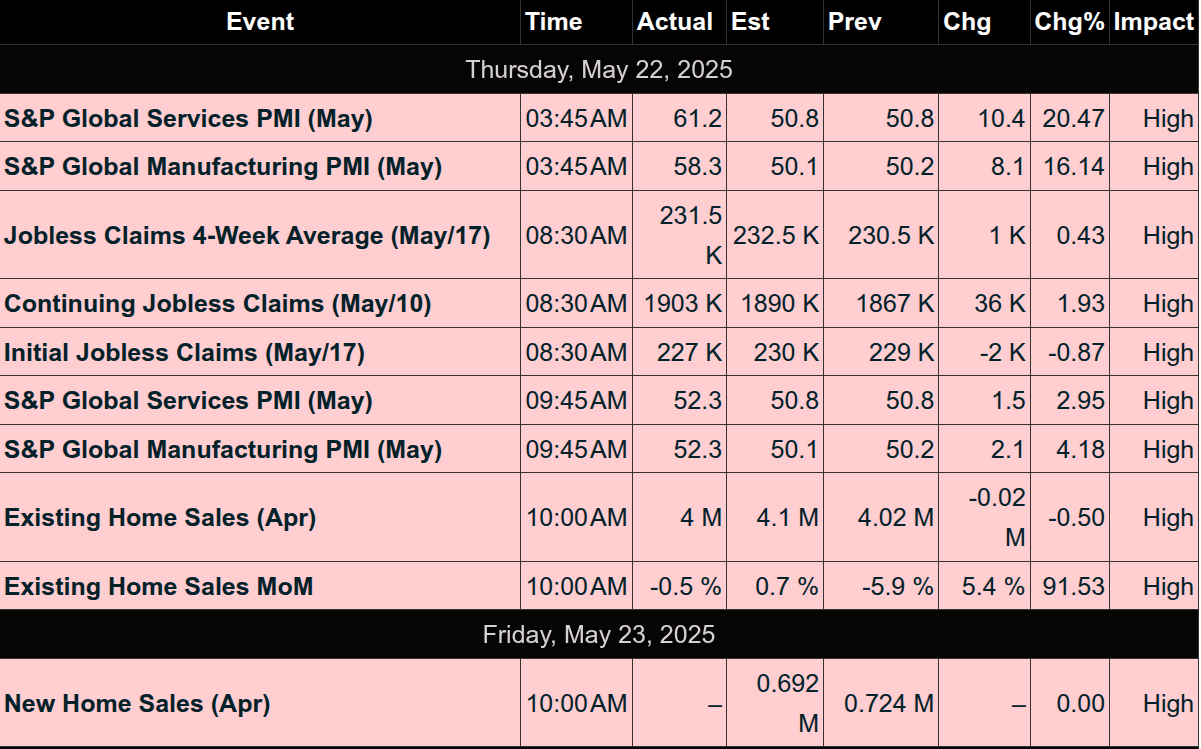
Economic Data:
-
S&P Global flash PMIs showed improved activity in May, helped by a 90-day tariff pause.
-
Jobless claims rose; the 4-week average is now at its highest since November 2021.
-
-
Corporate News:
-
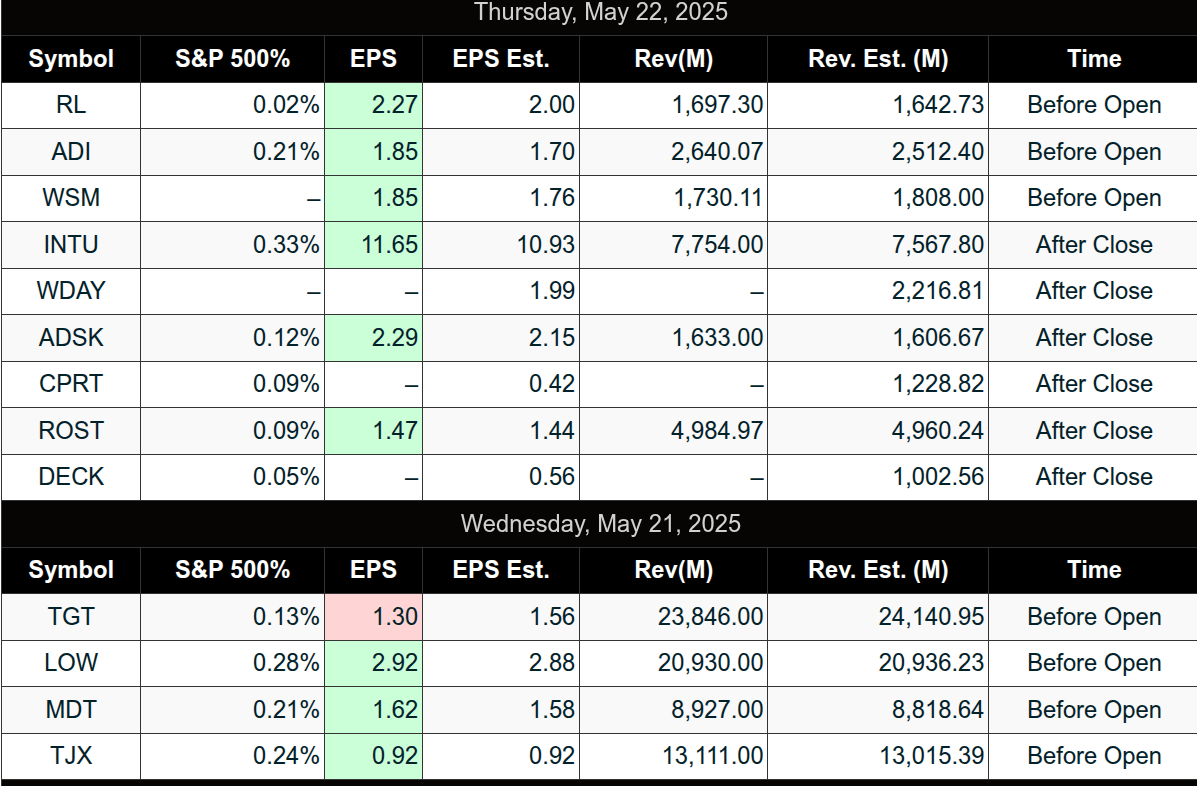
Target (TGT) missed earnings and lowered sales outlook.
-
Analysts including Bank of America and Melius downgraded TGT; consensus rating now at its lowest since 2018.
-
Earnings to watch: Booz Allen Hamilton (BAH), Coca-Cola Europacific (CCEP).
-
-
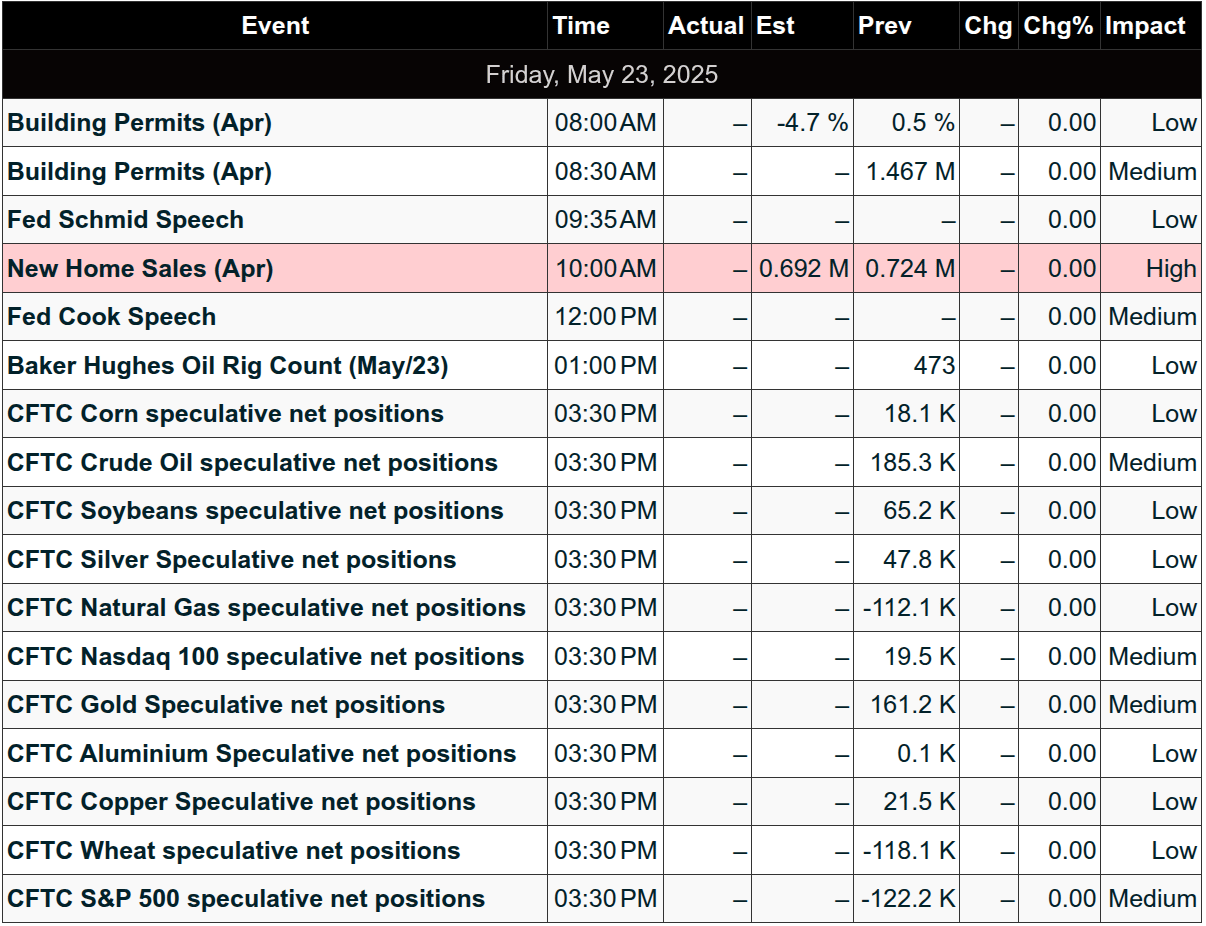
Today’s Calendar:
-
Economic: New Home Sales @ 10:00am ET.
-
Fed Speakers: Musalem (9:35am), Schmid (9:35am), Cook (12:00pm).
-
-
Market Conditions:
-
Volatility steady; ES 5-day average range is 81.25 points.
-
Expect lower volume due to upcoming Memorial Day holiday (markets closed Monday).
-
-
Technical Outlook:
-
Whale bias modestly bullish.
-
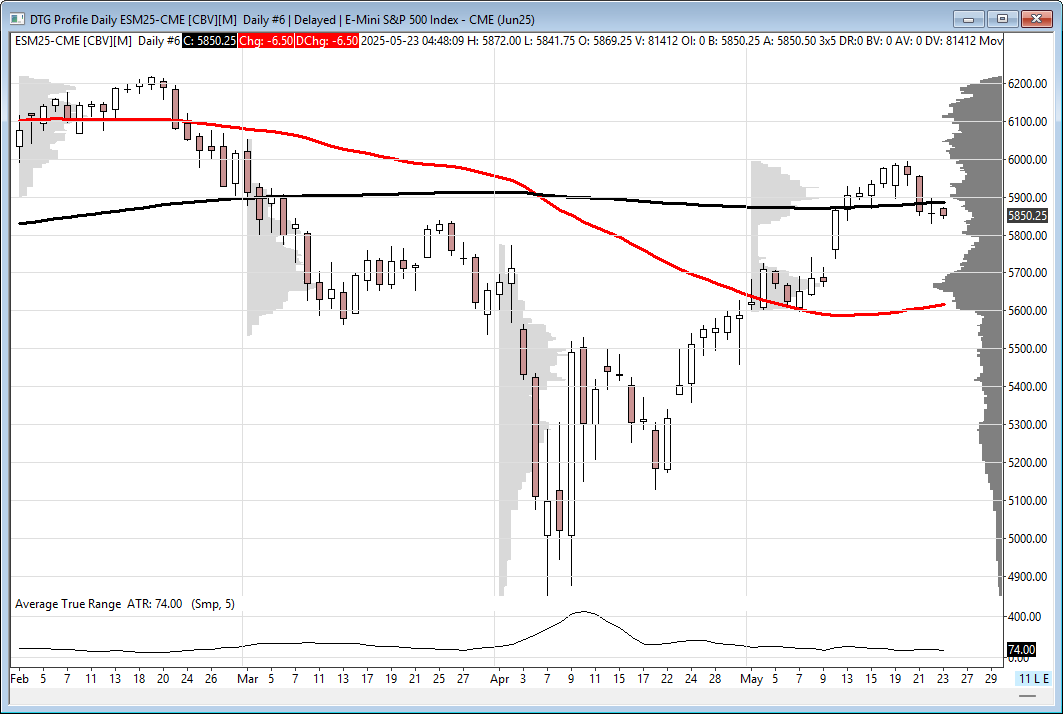
ES remains in short-term uptrend; 200-day MA (5686.75) is near-term resistance.
-
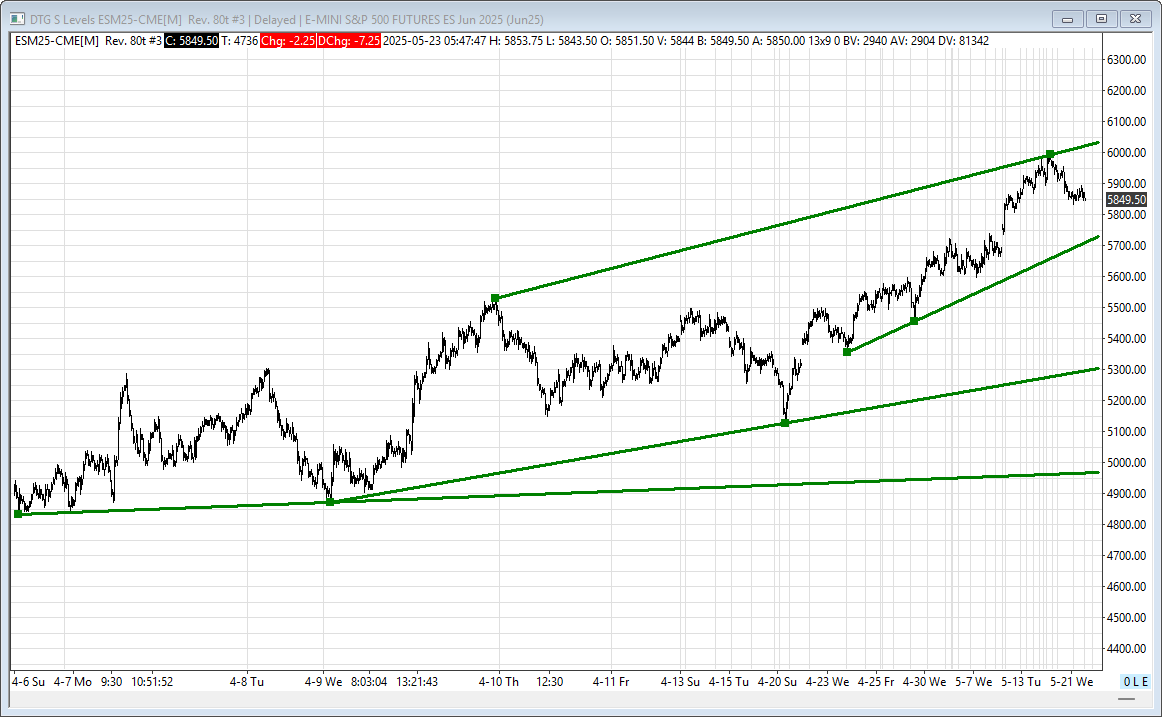
Key trendline levels: Resistance 6024/29, Support 5720/25, 5301/06, 4972/77.
-
ES
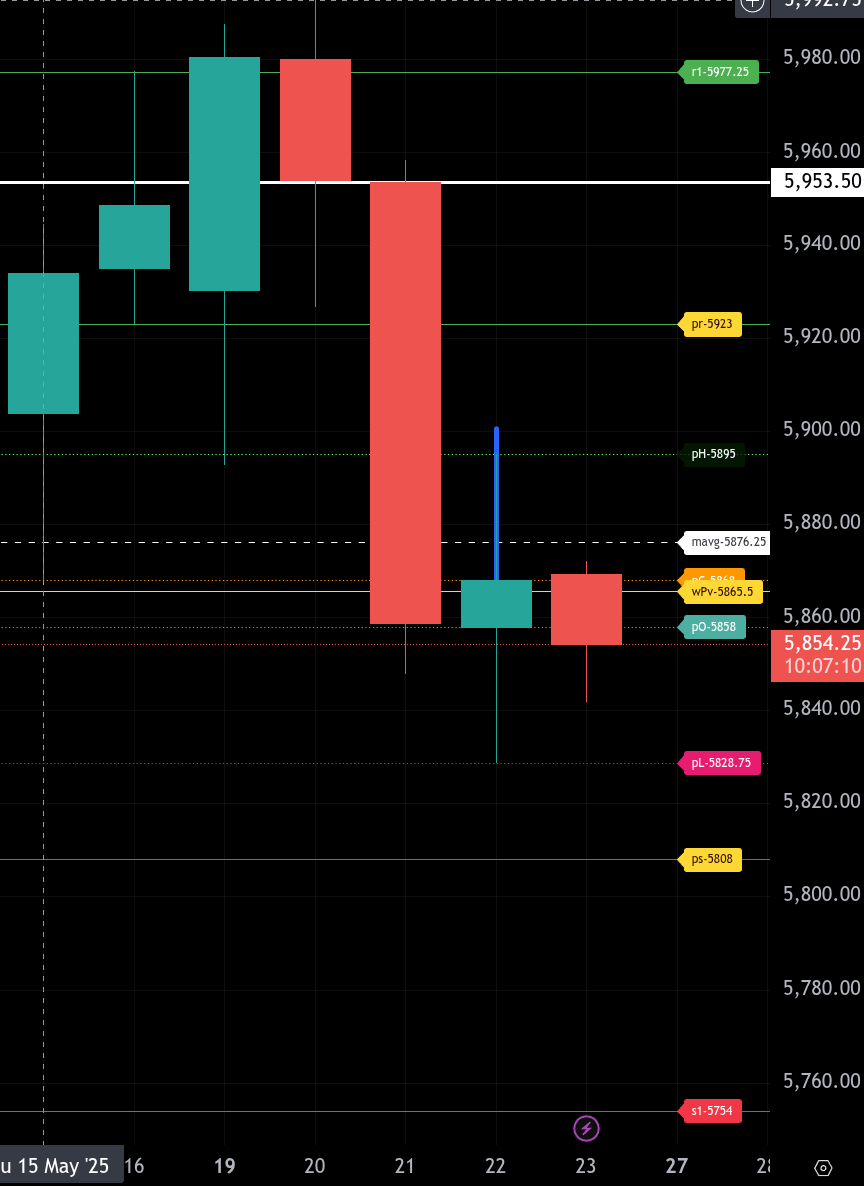
The bull/bear line for the ES is at 5865.50. This is the pivotal level for today’s session, and sustained trade below this line confirms a bearish bias.
Currently, ES is trading around 5854.25, indicating bearish sentiment remains in control beneath the bull/bear level. If sellers continue to dominate, the next downside target is 5828.80, and further pressure may extend to the lower range target at 5808.00. These levels will serve as important benchmarks for continuation or reversal signals.
On the upside, the first resistance to monitor is the 5876.30 area, where the moving average and overnight high converge. A reclaim of 5865.50 followed by acceptance above 5876.30 opens the door to test 5895.00 and 5923.00. A sustained breakout above the upper range target at 5923.00 would shift momentum back in favor of the bulls.
Additional resistance stands at 5977.30, though this is currently a stretch target unless we see a dramatic reversal in tone.
In summary, the trend remains bearish below 5865.50. Bulls will need to recover this level early in the session to have a chance at pushing price higher. Watch for reactions at 5808.00 on the downside and 5895.00 on the upside for the next directional cues.
NQ
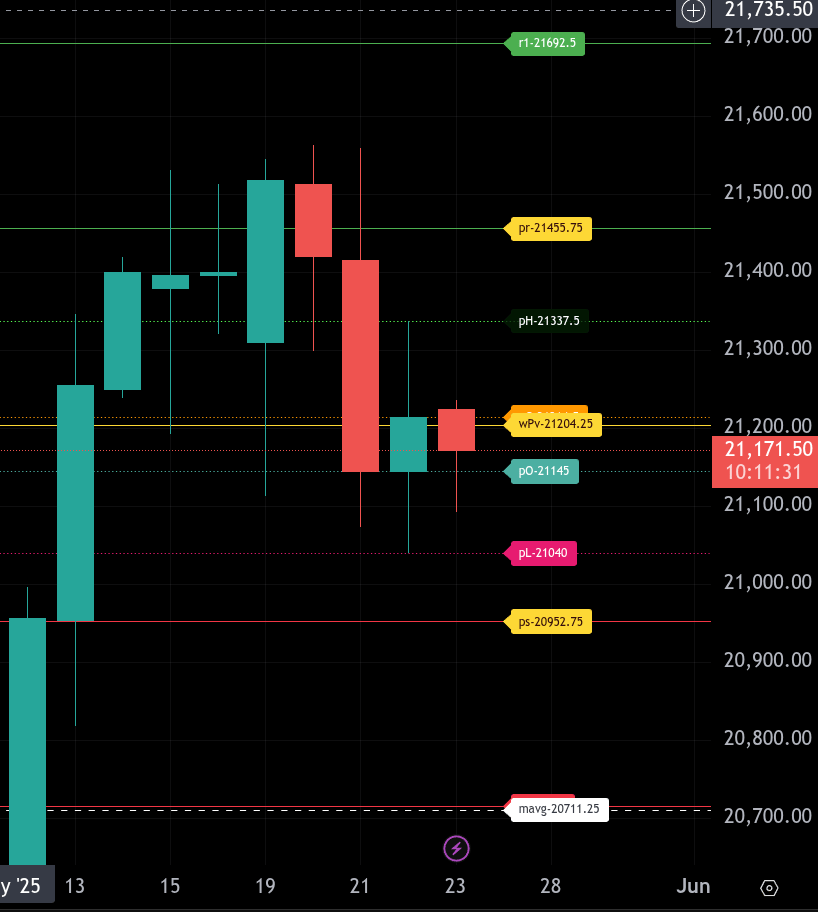
The bull/bear line for the NQ is at 21,204.25. This level marks the dividing line for directional bias. Holding below suggests continued weakness, while reclaiming it and holding above could shift sentiment to bullish intraday.
Currently, NQ is trading around 21,171.50, which places it below the bull/bear line. As long as price remains under this level, sellers maintain control, with intraday downside targets first to 21,145.00 and then to 21,040.00. The lower range target for today sits at 20,952.75, and a break below there could accelerate downside momentum.
If buyers can push the NQ back above 21,204.25 and establish acceptance, look for a potential rally toward 21,337.50, followed by resistance at 21,455.75, our upper range target. Sustained strength above this level would be required to open the door to a move toward the upper pivot at 21,692.50.
Additional support below includes 21,040.00, and the major moving average is at 20,711.25. Resistance levels above include 21,337.50 and 21,455.75.
For now, the path of least resistance remains lower while below 21,204.25. Watch for any signs of a reversal at or near the lower range to evaluate possible bounce scenarios.
Calendars
Economic Calendar Today
This Week’s High Importance
Earnings:
Affiliate Disclosure: This newsletter may contain affiliate links, which means we may earn a commission if you click through and make a purchase. This comes at no additional cost to you and helps us continue providing valuable content. We only recommend products or services we genuinely believe in. Thank you for your support!
Disclaimer: Charts and analysis are for discussion and education purposes only. I am not a financial advisor, do not give financial advice and am not recommending the buying or selling of any security.
Remember: Not all setups will trigger. Not all setups will be profitable. Not all setups should be taken. These are simply the setups that I have put together for years on my own and what I watch as part of my own “game plan” coming into each day. Good luck!!
Follow @MrTopStep on Twitter and please share if you find our work valuable!
This post goes out as an email to our subscribers every day and is posted for free here around 2 PM ET. To get your real-time copy, sign up for the free or premium version here: Opening Print Subscribe.
Comments are closed