This post goes out as an email to our subscribers every day and is posted for free here around 2 PM ET. To get your real-time copy, sign up for the free or premium version here: Opening Print Subscribe.
Stagflation Flashback: Feels Like ’74 All Over Again
Follow @MrTopStep on Twitter and please share if you find our work valuable!
Our View
Can you say stagflation? I can! I remember the oil embargo and my parents waiting in line for hours to put gas in the car. While I am not 100% sure that’s where we are headed today, it sure looks that way.
The last time the United States experienced true stagflation—a toxic mix of high inflation, elevated unemployment, and stagnant or negative real GDP growth—was during the 1970s. The key period was from 1973–1975, triggered by the OPEC oil embargo that quadrupled oil prices. This led to CPI inflation peaking at 12.3% in 1974, unemployment surpassing 9% in May 1975, and real GDP contracting by –0.5% in 1974 and –0.2% in 1975. It was a recession that shattered the traditional Phillips Curve tradeoff of low unemployment with high inflation and coined the term “stagflation.”
A second wave hit in 1978–1980, sparked by the 1979 Iranian Revolution and another oil shock. This pushed inflation to 14.8% in March 1980, unemployment back toward 8%, and real GDP growth sharply slowed before turning negative in 1980. That period only ended after Federal Reserve Chair Paul Volcker hiked rates to nearly 20% in 1980–1981, which sparked a deep 1981–1982 recession.
Our Lean
U.S. Dollar Index ($DXY)
Monthly Chart
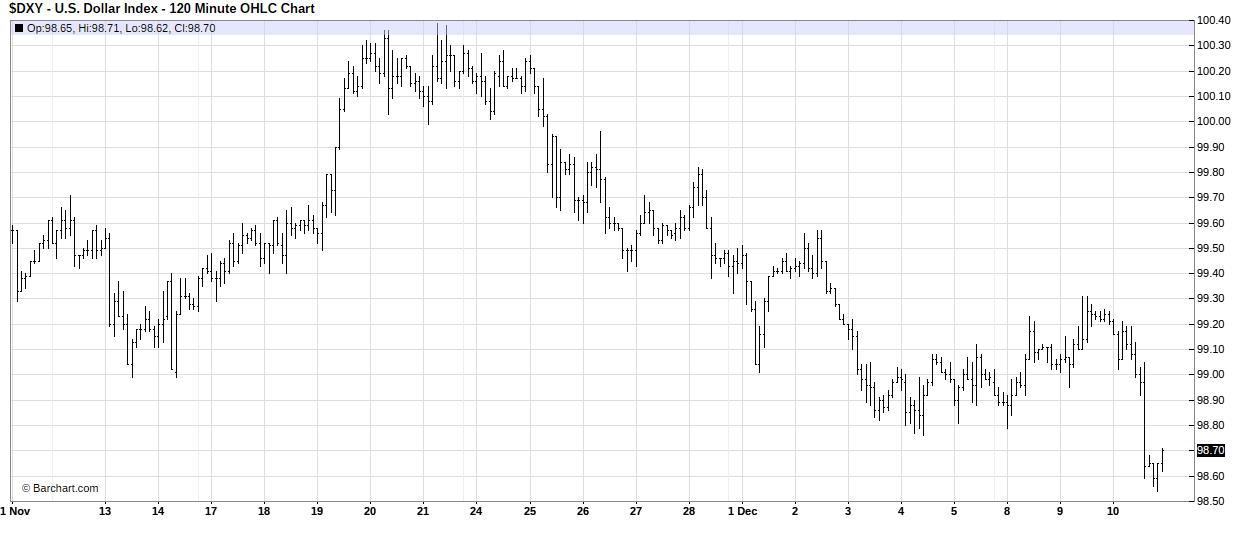
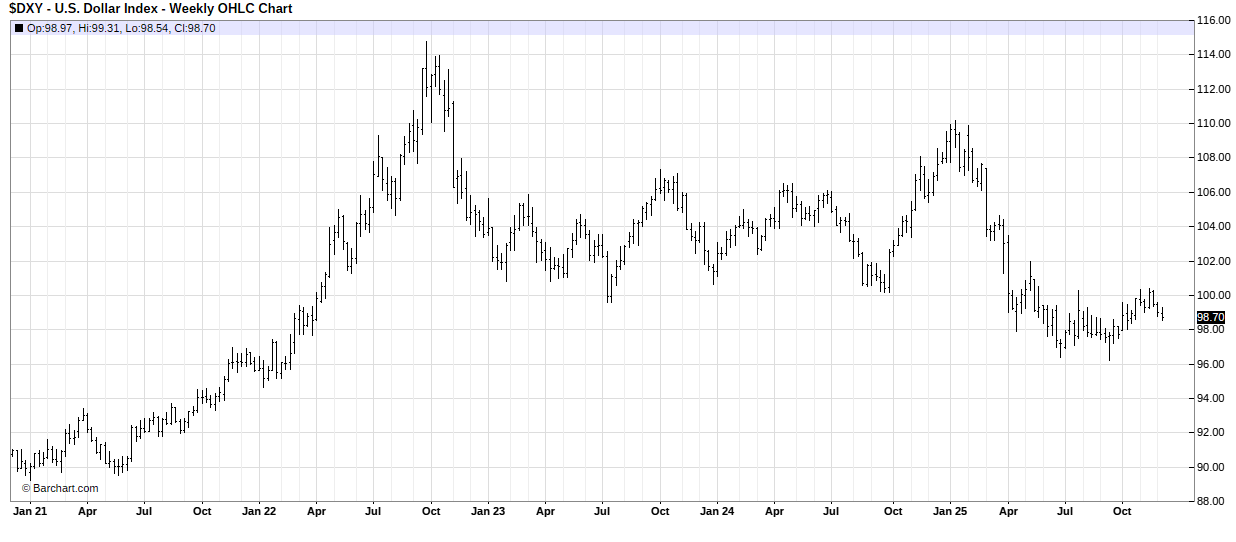
The dollar got pummeled again. Out of the last 13 sessions, the dollar has been down in 9 of them, with one day unchanged. Here is a link to Barchart’s DXY (Dollar Index).
It really seems like the Indians are circling the wagons.
Our lean: I can’t rule out a bounce, but today is the Thursday before Week 2 options expiration. The rule is to look for a low today and then up into expiration. I can’t rule out that the “sell the Fed news” move is over, and if the ES starts taking out the Globex lows and breaks support at the 6800 level, there could be more room on the downside. The only thing I can say is: sell the dead cat bounces today.

Market Recap:
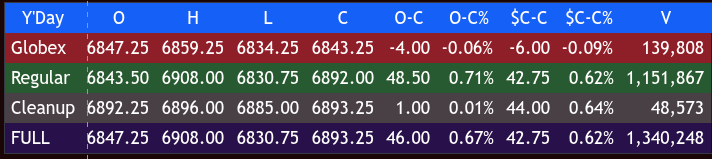
The ES traded down to 6834.25 and made a high at 6859.25 on Globex, opening Wednesday’s Fed-filled session at 6843.50, down 4 points. After the open, the ES traded 6838.26, rallied up to 6845.75, and then sold off to the early low of 6830.74 at 9:35. It then traded up to 6852.50, sold off down to a higher low at 6834.25 at 10:40, rallied up to 6850.00 at 10:50, sold off to another higher low at 6832.00 at 11:00, and then rallied again to another new daily high at 6856.75 at 11:25.
The ES gradually pulled back to 6847.00 — 2 ticks above the VWAP — at 12:40, and then rallied to another new high at 6860.25 at 12:55. It sold off to 6842.00 at 1:55 and rallied up to 6875.50 at 2:10 after the Fed headlines hit. It then sold off to 6850.50 at 2:25, rallied up to 6886.50 at 2:35 after Powell’s press conference started, traded 6851.25 at 2:40, rallied back up to 6886.50 again, and then sold off to 6851.25.
The ES made seven higher highs all the way up to 6908.00 at 3:30, pulled back to 6900.25 at 3:40, and traded 6900.75 as the 3:50 imbalance showed $500 million to sell and $2.2 billion to buy on the NASDAQ. It sold off down to 6889.75 at 3:59 and traded 6892.00 on the 4:00 cash close. After 4:00, the ES sold off to 6885.00, rallied to 6896.00 at 4:45, and settled at 6893.25, up 46.00 points or +0.67%. The NQ settled at 25,798.00, up 98.25 points or +0.38%.
In the end, I noticed how the early sell programs seemed to be limited in scope. Here are a few posts I made when I picked up on it:
IMPRO : Dboy : (9:34:44 AM) : sould not do very much
IMPRO : Dboy : (11:16:22 AM) : I got this gut feelingwe could see a pop into the Fed
In terms of the ES and NQ’s overall tone, there was a clear flip in price action around 12:30. In terms of the ES’s overall trade, volume nearly doubled after 2:00 PM, with 1.34 million contracts traded.
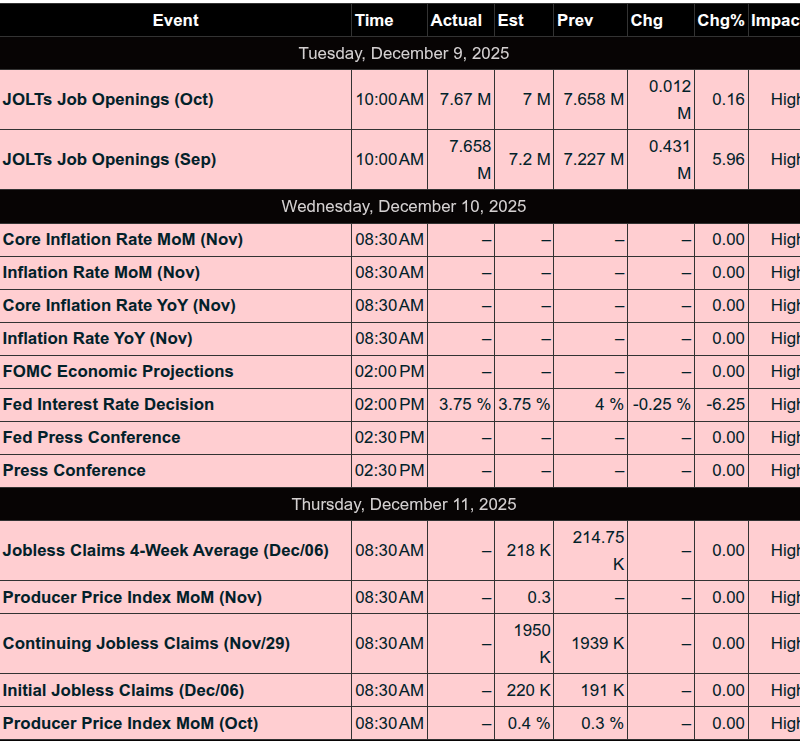
We have a full spread of economic reports today: the Producer Price Index (PPI) for November at 8:30 AM ET; weekly Initial Jobless Claims at 8:30 AM ET; U.S. International Trade data for September at 8:30 AM ET; the Quarterly Services Survey at 10:00 AM ET; State Employment and Unemployment data for September at 10:00 AM ET; and the Wholesale Inventories report at 10:00 AM ET.
The ES fell sharply on Globex down to 6817.25, down over 1%, and the NQ traded down to 25,383.00, down over 1.5%. There was some news of a massive Ukrainian drone attack on Moscow, but I don’t think that was the driver. I think it was the Fed’s sea change on lowering rates in 2026. While I didn’t see this coming, it makes sense. As I have always said, the S&P hates uncertainty.
MiM
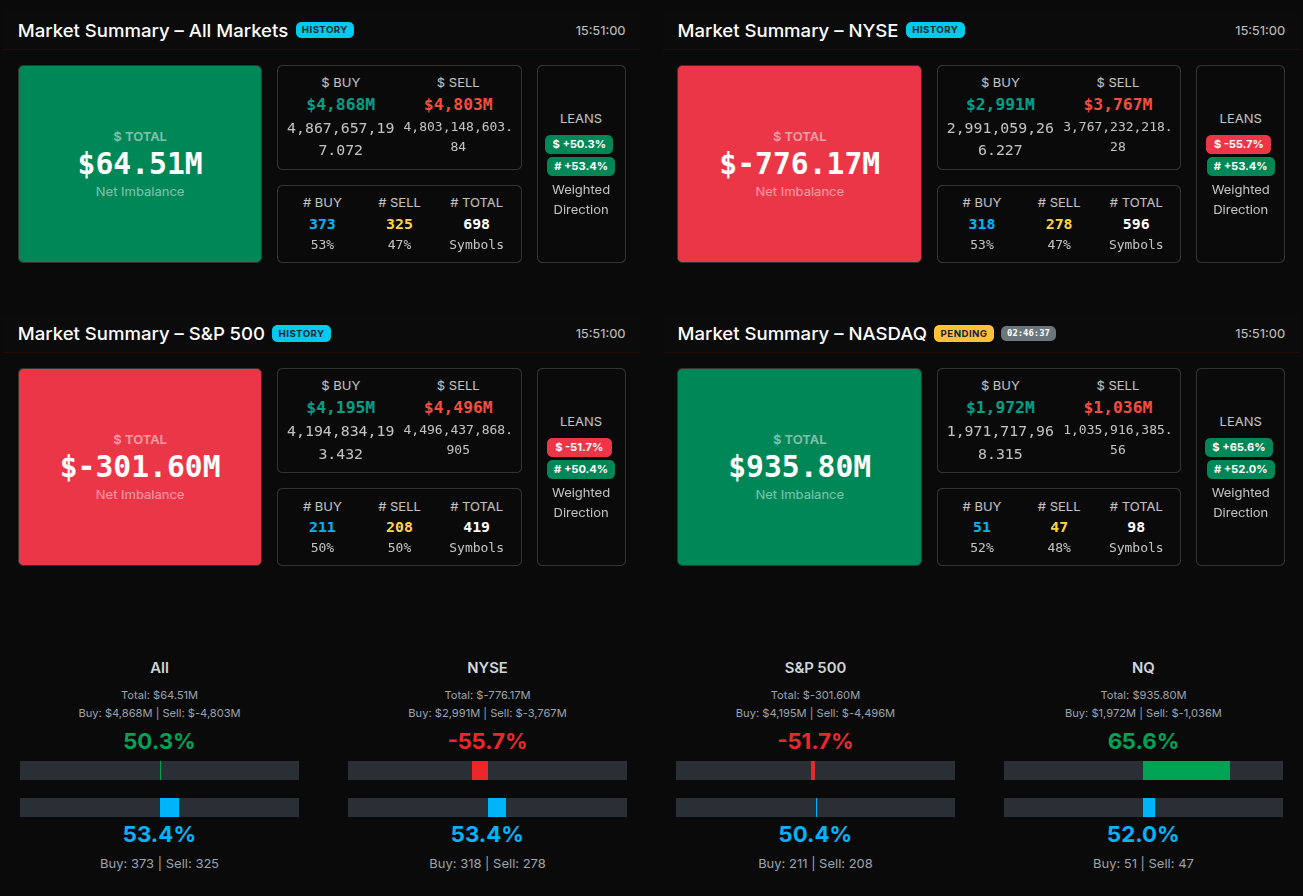
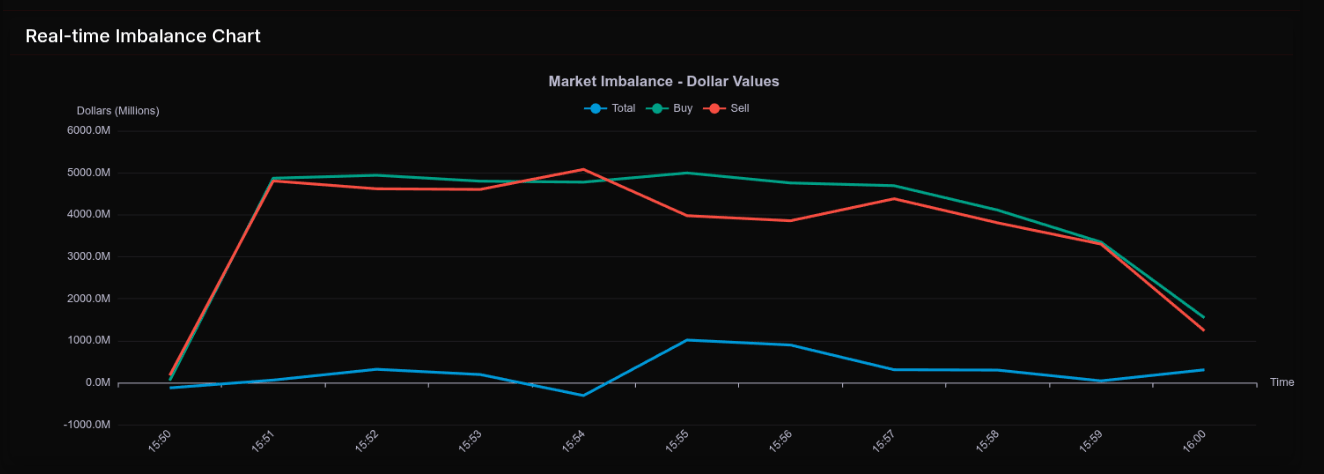
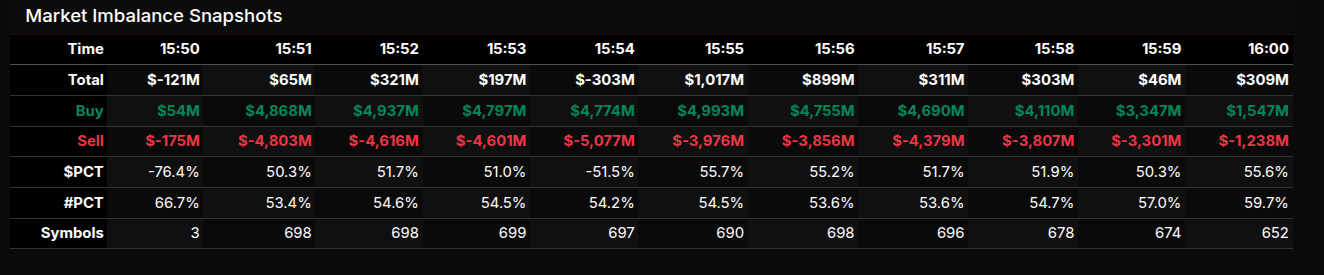
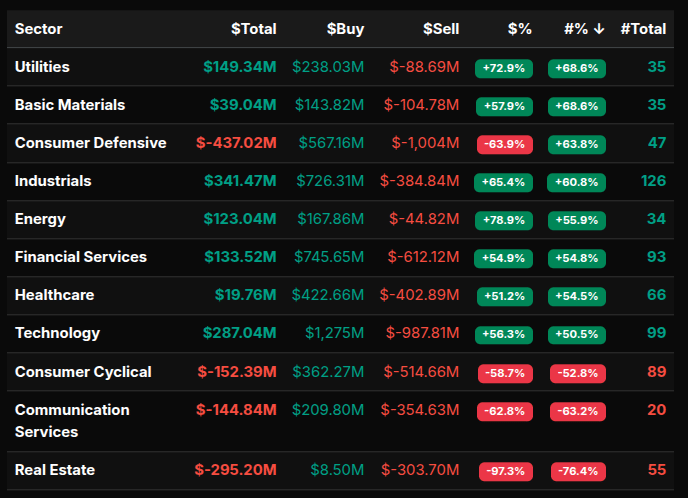
The Market-on-Close auction opened at 15:51 with a modest $65M buy imbalance, but under the surface, the tape was far from neutral. Both buy and sell interest surged immediately to roughly $4.8B each, creating a rotational backdrop with $PCT reading 50.3% and a near-even symbol split of 373 buys vs. 325 sells.
From 15:52 through 15:54, the MOC held in this rotational zone. Total imbalances fluctuated between $197M and -$303M, while buy and sell pressure stayed tightly paired around the $4.7B–$4.9B range. Lean gauges hovered near the 50% line, confirming that no side had decisive control. The only real movement happened at the symbol level, where participation broadened to nearly 700 names, but still without directional commitment.
The first sign of expansion came at 15:55 when the total jumped to $1.017B buy, driven mainly by a brief pullback in sell interest to $3.976B. But the shift didn’t last. By 15:56 the imbalance slipped back to $899M, and from 15:57–15:59 the auction reverted into narrow, rotational readings between $303M and $46M, with buy and sell flows once again tightly paired. Into the bell, the imbalance lifted slightly to $309M, a mild uptick but not a trend.
Sector flows paint the real story. Utilities (+72.9%), Industrials (+65.4%), Energy (+78.9%), and Technology (+56.3%) showed notable buy leans, each above the 66% threshold at points—indicating pockets of wholesale buying. Meanwhile, Consumer Defensive (-63.9%), Consumer Cyclical (-58.7%), and Communication Services (-62.8%) were sold aggressively. Real Estate posted the heaviest skew at -97.3%, a clear liquidation signal.
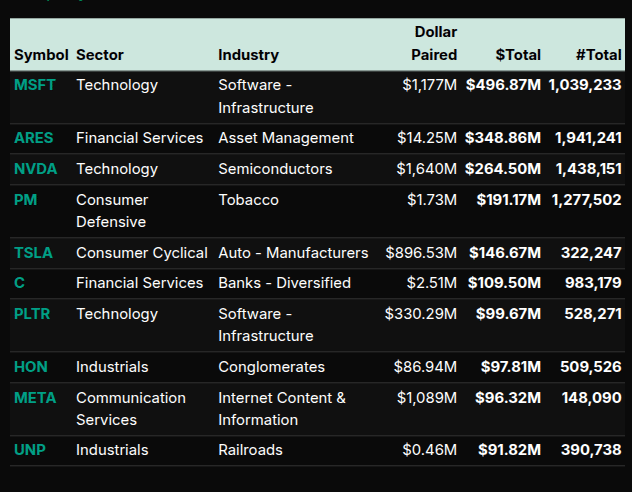
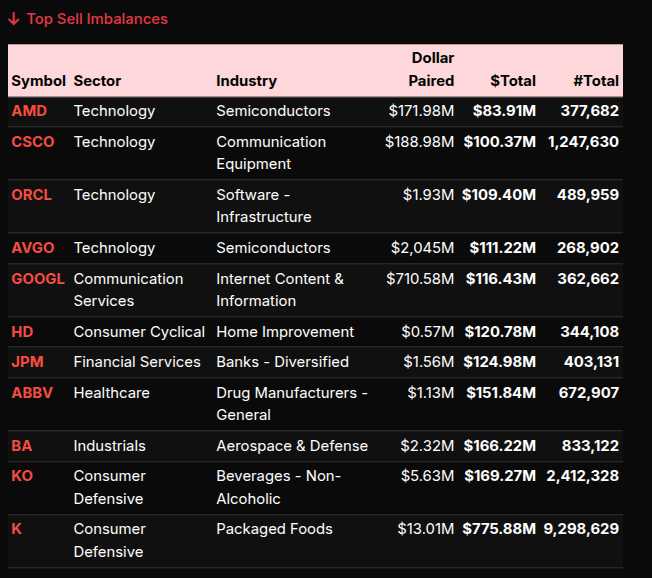
On the individual names, the sell tape was dominated by AMD, CSCO, ORCL, AVGO, GOOGL, HD, JPM, ABBV, BA, KO, and K—a broad mix spanning tech, financials, healthcare, and staples. Buy interest concentrated in MSFT, ARES, NVDA, PM, TSLA, C, PLTR, HON, META, and UNP, giving Technology, Industrials, and Financials the strongest backbone into the close.
Overall, this was a rotational MOC with brief buy-side expansion, heavy sector dispersion, and no true directional conviction into the bell.
Guest Posts:
Technical Edge
Fair Values for December 11, 2025
-
S&P: 5.69
-
NQ: 25.58
-
Dow: 41.11
Daily Breadth Data 📊
For Wednesday, December 10, 2025
-
NYSE Breadth: 71% Upside Volume
-
Nasdaq Breadth: 57% Upside Volume
-
Total Breadth: 59% Upside Volume
-
NYSE Advance/Decline: 72% Advance
-
Nasdaq Advance/Decline: 65% Advance
-
Total Advance/Decline: 68% Advance
-
NYSE New Highs/New Lows: 181 / 19
-
Nasdaq New Highs/New Lows: 334 / 104
-
NYSE TRIN: 1.18
-
Nasdaq TRIN: 1.39
Weekly Breadth Data 📈
For the Week Ending Friday, December 5, 2025
-
NYSE Breadth: 51% Upside Volume
-
Nasdaq Breadth: 54% Upside Volume
-
Total Breadth: 52% Upside Volume
-
NYSE Advance/Decline: 48% Advance
-
Nasdaq Advance/Decline: 52% Advance
-
Total Advance/Decline: 51% Advance
-
NYSE New Highs/New Lows: 273 / 72
-
Nasdaq New Highs/New Lows: 441 / 297
-
NYSE TRIN: 0.90
-
Nasdaq TRIN: 0.93
BTS Levels:
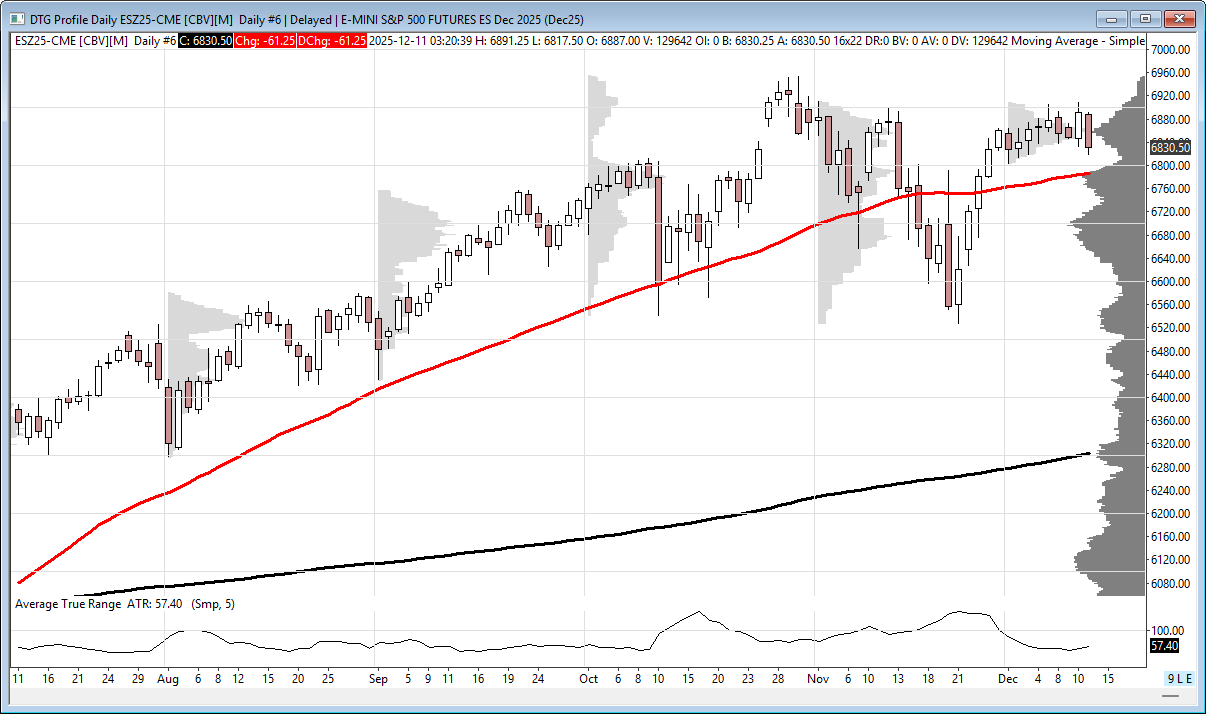
ESZ2025
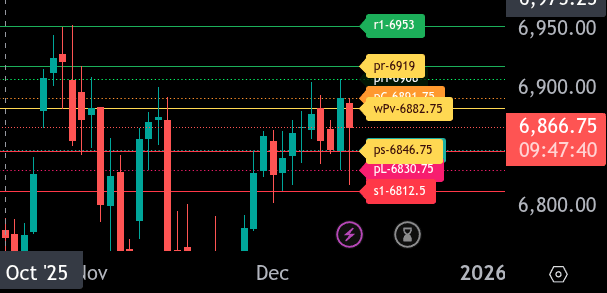
The bull/bear line for the ES is at 6,882.75. With price currently trading near 6,866.25, the tone remains soft beneath this level. A sustained move back above 6,882.75 is needed to shift momentum upward.
The upper range target sits at 6,919. If buyers reclaim the bull/bear line, the path opens toward resistance at 6,891.75 and then 6,908 before the upper range target at 6,919.
Support is layered below at 6,846.75, followed by 6,830.75 and deeper support at 6,812.50. Holding above 6,846.75 is key to preventing a slide into the lower support band.
Overall, the intraday bias favors sellers below 6,882.75. Reclaiming and holding above this level would pivot the day toward testing upside levels, with 6,919 as the primary upside target.
NQZ2025
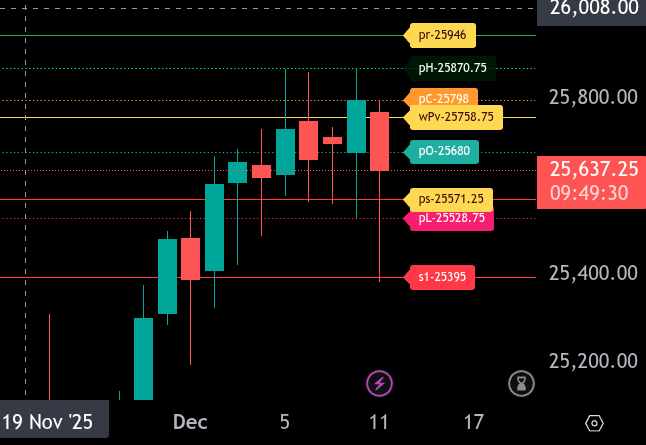
The bull/bear line for NQ is at 25,758.75. Price is trading below this level near 25,634.00, keeping the tone bearish unless buyers can reclaim 25,758.75.
The upper range target is 25,946.00. If NQ can firm up above the bull/bear line and hold, upside rotations toward 25,798.00, 25,870.75, and ultimately 25,946.00 are the key progression levels. Above 25,946.00, the next resistance sits at 26,122.25.
The lower range target is 25,571.25. If sellers continue to press below the bull/bear line, support comes in at 25,680.00, then 25,571.25. A break of 25,571.25 exposes 25,528.75 and deeper support at 25,395.00.
Overall, the bias remains soft below 25,758.75. Reclaiming the bull/bear line would shift momentum toward the upper range target, while continued rejection keeps pressure on the lower support zones.
Economic Calendar Today
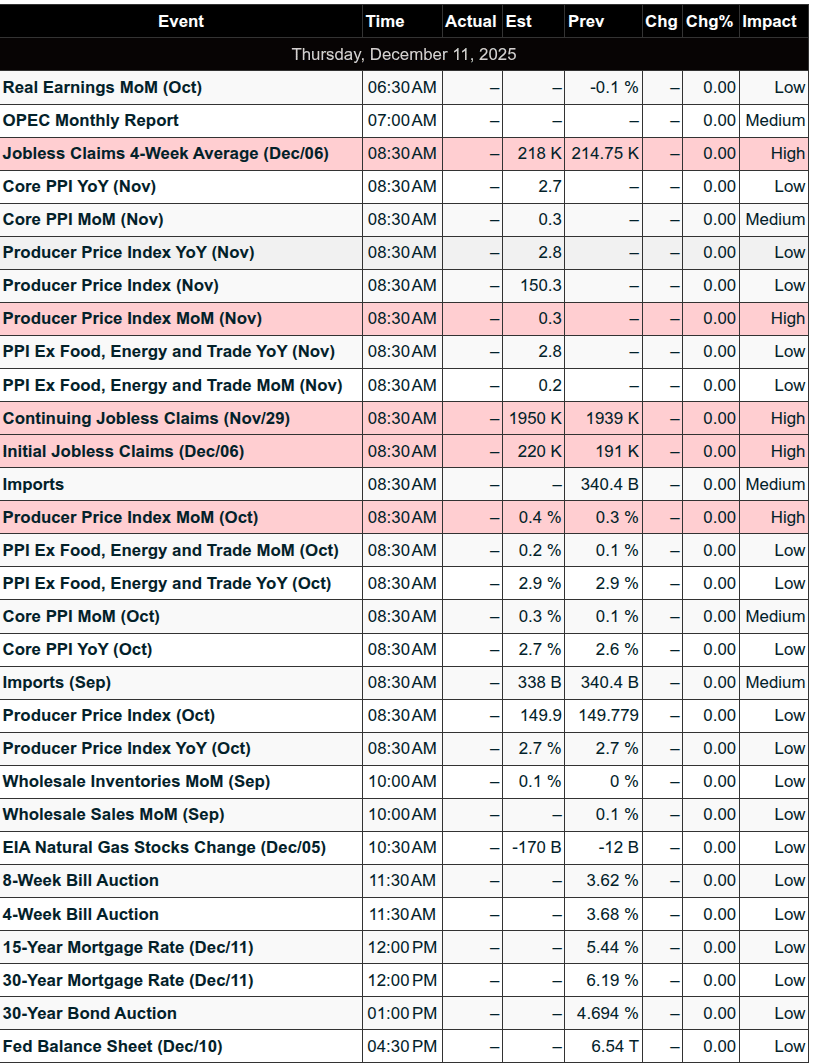
This Week’s High Importance
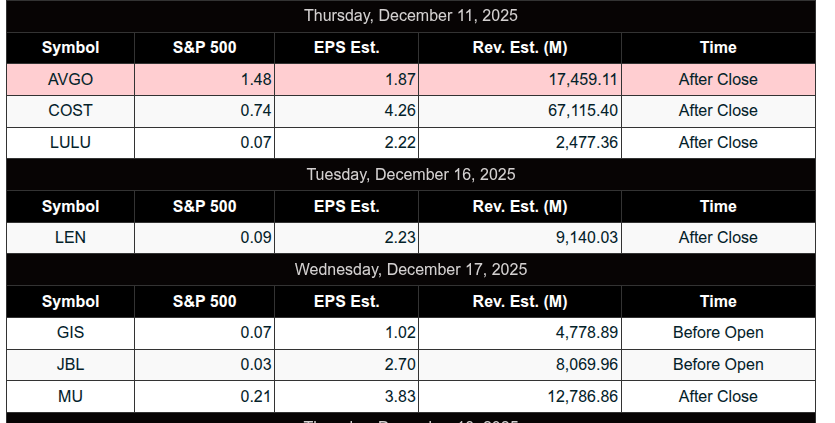
Earnings:
Trading Room News:
PTG Room Summary – Wednesday, December 10, 2025
FOMC days are known for volatility, and yesterday delivered with precision. The room executed well-planned setups during the early session, navigated a dynamic post-Fed environment, and capitalized on both long and short plays. The PTG Fed Day Cheatsheet proved to be an invaluable guide, with targets and timing hitting nearly to the tick.
Morning Session Highlights:
-
Pre-market Strategy was clearly defined by both Manny and PTGDavid, focusing on support buys near 6831–6835, and watching for reactions at the key VWAP zone (6845).
-
Manny executed beautifully on a Globex Support Buy at 6831–6835, booking +5 and +10 points, then managing a runner from 6842.50.
-
Early price action repeatedly tested the 6830–6835 zone, which aligned with the day’s DTS Briefing Key Zone and triggered multiple buy responses—a textbook example of level-based trading.
-
CL Open Range short hit all targets, confirming precision alignment with premarket plans.
Lessons & Insights:
-
PeterN reminded the room: “Trading is IF-THEN statements applied to key levels.”
-
David’s reminder: “Your job isn’t to predict the Fed. It’s to execute the levels with discipline once the chaos resolves.” A vital mindset, especially on volatile days.
-
Solid discussion around range trading tools (PKB, RSPR), premium/discount extremes, and execution within order flow context.
FOMC – 2:00 PM EST: Fireworks Begin
-
Fed cuts rates by 25bps and announces Treasury Bill purchases starting Dec 12 — surprising the market.
-
Immediate bullish reaction: Price sustains above 6845, fulfilling Bull Scenario targets to 6865, then extending further.
-
Money Box Range levels (both upside and downside) fully achieved, showing the effectiveness of the PTG structure.
-
Cycle Day 2 High of 6899.90 was fulfilled exactly, emphasizing the accuracy of projections and discipline in execution.
-
NQ joined the party, fulfilling its Cycle Day 2 upside target (25855) — confirming broader market alignment.
-
The Trend Lock Play #3 unfolded perfectly into the close, consistent with PTG’s FOMC Playbook.
Tools & Resources Praised:
-
The newly introduced QR (Quick Reference) Cheatsheets for the Fed meeting and presser were highly praised by multiple members) for accuracy and clarity.
-
David hinted they will become a regular Fed Day feature.
Looking Ahead:
David advised the room to bring their A-game on Thursday, expecting strong rhythm and follow-through post-FOMC.
Summary of Key Executions:
Trade Setup
Outcome
Support Buy 6831–6835
Executed by Manny for +5, +10 pts & runner
CL Open Range Short
All targets fulfilled
LB&F of ONL
+5 pts (Manny)
Bull Scenario Above 6845
6860, 6865, and 6884 targets fulfilled
CD2 High 6899.90
Achieved precisely
Trend Lock Play #3
Confirmed with PM rally
NQ CD2 Target 25855
Fulfilled
Another masterclass in structured, disciplined trading by PTG and its members.
Well-prepared traders were well-rewarded.
DTG Room Preview – Thursday, December 11, 2025
-
Fed & Market Reaction:
The Fed delivered a widely expected 25 bps rate cut and signaled a pause on further cuts. Markets initially reacted bullishly, with volatility rising post-announcement.Oracle (ORCL) Shock:
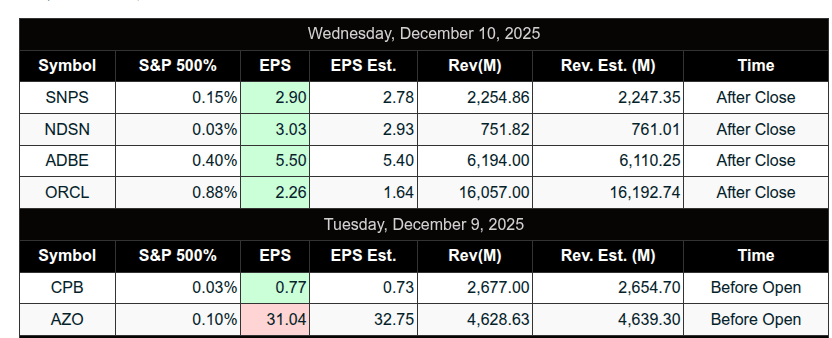
Oracle dropped over 12% post-earnings. Despite a 14% YoY revenue rise, it missed estimates ($16.06B vs $16.21B expected). Cloud revenue met targets, and EPS beat at $2.26 vs $1.64 est. However, heavy AI investment, rising debt levels, and ballooning RPOs ($455B, up 440% YoY) spooked investors, triggering fears of an AI bubble. Oracle’s CDS pricing hit its highest since 2009, and Bitcoin fell over 4% below $90K in response.Geopolitical Risk:
The U.S. seized a 2M barrel “stateless” oil tanker linked to Venezuela, escalating tensions. Venezuela condemned it as “piracy,” raising concerns over oil trade disruption.Earnings & Data Ahead:
Premarket: Ciena (CIEN).
After-hours: Broadcom (AVGO), Costco (COST), Lululemon (LULU).
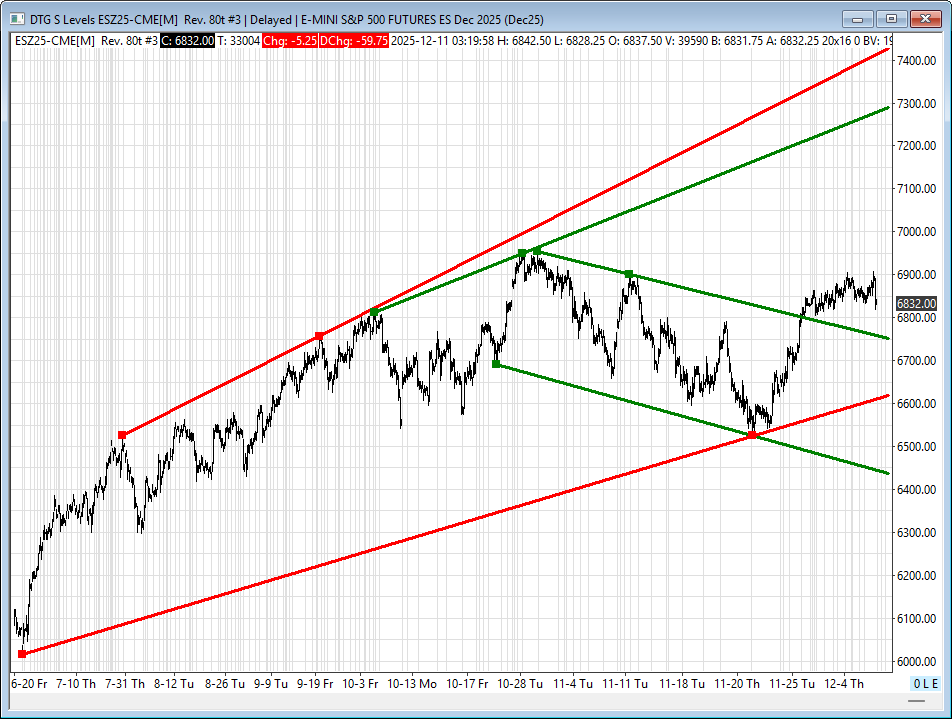
Economic releases: Jobless Claims, delayed Trade Balance (8:30am ET), and Wholesale Inventories (10:00am ET).Futures/Technical Picture (ES):
-
Overnight selloff expanded volatility; 5-day ADR now 51.5 pts.
-
ES still whipsawing sideways post-Fed.
-
Key resistance: 7287/92, 7430/35.
-
Key support: 6758/53 (former channel top), 6614/19, 6430/25.
-
Whale bias bearish into morning data on light but notable overnight large trader flows.
-
Affiliate Disclosure: This newsletter may contain affiliate links, which means we may earn a commission if you click through and make a purchase. This comes at no additional cost to you and helps us continue providing valuable content. We only recommend products or services we genuinely believe in. Thank you for your support!
Disclaimer: Charts and analysis are for discussion and education purposes only. I am not a financial advisor, do not give financial advice and am not recommending the buying or selling of any security.
Remember: Not all setups will trigger. Not all setups will be profitable. Not all setups should be taken. These are simply the setups that I have put together for years on my own and what I watch as part of my own “game plan” coming into each day. Good luck!
This post goes out as an email to our subscribers every day and is posted for free here around 2 PM ET. To get your real-time copy, sign up for the free or premium version here: Opening Print Subscribe.
Comments are closed