This post goes out as an email to our subscribers every day and is posted for free here around 2 PM ET. To get your real-time copy, sign up for the free or premium version here: Opening Print Subscribe.
Follow @MrTopStep on Twitter and please share if you find our work valuable!
Our View
I think this is very much a “one day at a time” type market. Yes, the indices have jumped, but the geopolitical picture remains clouded.
The entire picture remains very fluid, and despite Trump trying to get the Iranians to negotiate an end to the war, they are not budging, and the attacks on both sides continue.
Trump issued a stark warning on social media, declaring that Tuesday would be “Power Plant Day and Bridge Day, all wrapped up in one” in Iran if Tehran does not reopen the Strait of Hormuz.
“If Iran does not open the strait, you’ll be living in Hell,” he added in the post.
Meanwhile, mediators from Egypt, Pakistan, and Turkey have proposed a 45-day ceasefire and the reopening of the Strait of Hormuz to both Iran and the United States. The goal is to create a window for negotiations aimed at ending the war, according to two Mideast officials who spoke to The Associated Press.The proposal was sent late Sunday night to Iranian Foreign Minister Abbas Araghchi and U.S. Mideast envoy Steve Witkoff. As of now, neither side has responded, the officials said. They requested anonymity to discuss the sensitive, private negotiations.This comes amid ongoing airstrikes on Iran that have killed more than 25 people in the latest wave, as reported in the broader Associated Press article.
The ES opened lower and traded down to 6567, rallied up to 6651.25 and is trading 6629.00, up 6.75 points. China and Russia are working to negotiate a peace plan also. I think all said want an a cease fire so negotiations are start but the big question remains, will it happen? To me the gap downs are getting bought that pushes me to think something positive could happen but will it be the end of the war? I’m not sure. The risk seem more on the upside now, can the ES and NQ hold the rallies. Will crude oil fall? You can sell the rips and buy the pull backs or just be patient and buy the pull backs.
Our Lean
You know the game show ‘Agree or Disagree’? Well that’s where we are at. You can agree that Trump has pulled another TACO and the markets are going to keep up or you can disagree that the war isn’t coming to a close and that this is just another dead cat bounce. For me it’s a combination of all the above. On one side I understand that at some point the PPT ( Plunge Protection Team) has to come to the rescue and on the other side I understand the if oil prices continue to move higher stock will fall again.
As I have always said, I do not pretend to be smarter than you and while I may have a good feel for the markets I also understand losing streaks and bad calls, it’s part of the game and how we survive in the type of trading environment is not always easy. What I do feel strongly about is exactly what I said before Trump took office, as long as he is the president there will be elevated volatility and so far that has been spot on and will continue
If you are looking for a respite do’n’ hold your breath and today end Trump’s deadline.
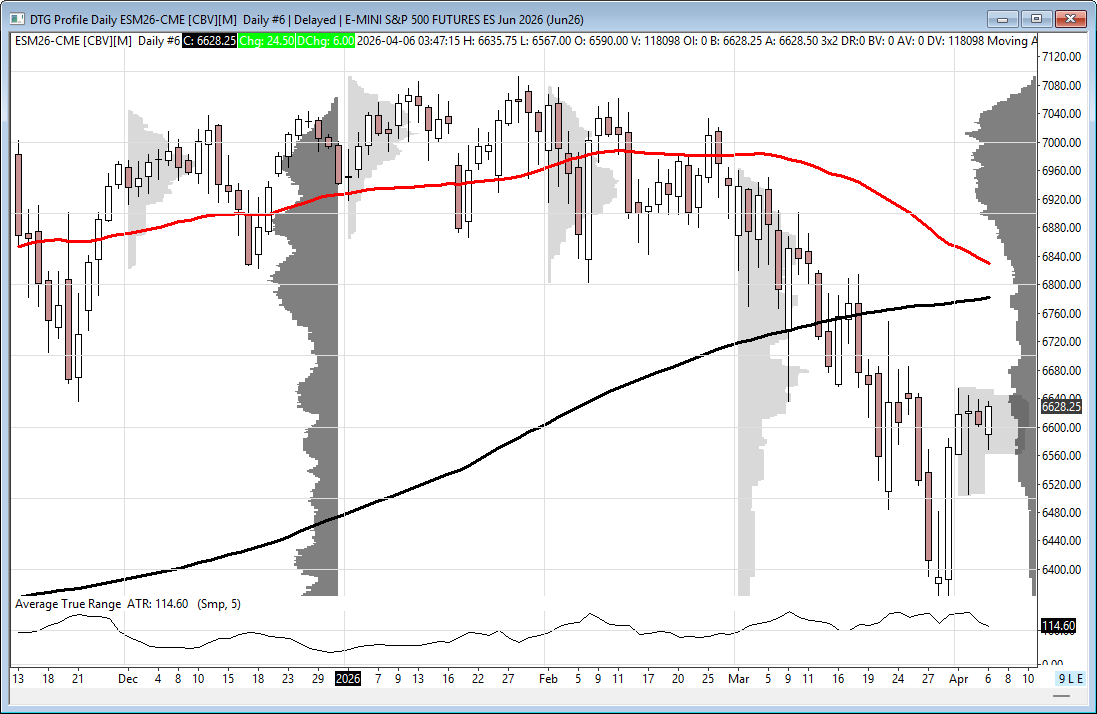
Claud ES Market Profile Levels
Multi-Timeframe Value Areas
6741.74
Fib 38.2% (Full Range) ★★☆
Key Fibonacci retracement of the 9-month range — rallies commonly stall here in downtrends.
6722.50
Wk 11 POC ★★☆
Point of Control for the week of Mar 10. High-volume node from the breakdown week — strong resistance on any recovery.
6717.50
Wk 11 VAH ★☆☆
Upper boundary of the week 11 value area. Part of the 6,710–6,725 resistance band from the Mar selloff week.
6692.50
Wk 11 VAL ★★☆
Lower boundary of week 11 value area. Prior support that capped the week’s range; now first overhead reference from that profile.
6685.58
Fib 23.6% (Mar Range) ★☆☆
23.6% retracement of the Mar 20 intraday spike (6,483–6,748). Minor fib; relevant on short-term moves only.
6682.50
Swing High ★☆☆
Mar 18–23 bounce high. Weak resistance — likely only a brief pause on the way to stronger levels above.
6680.00
POC All-Time / 10–60D ★★★
POC for the full dataset AND the 10/20/60-day profiles — extraordinary multi-timeframe confluence. Long-term fair value anchor; expect sharp reactions.
6678.17
Pivot R1 ★☆☆
First pivot resistance from the Mar 24 session. Intraday upside target.
6675.00
POC 5/20/60-Day ★★★
Secondary POC aligning across the 5-day, 20-day, and 60-day profiles. Stacked confluence with the 6,680 all-time POC — the 6,675–6,680 zone is the single most important level on the sheet.
6665.68
VWAP (9-Month) ★★★
Institutional benchmark. Price is 43 pts below — reclaiming flips aggregate bias from bearish to neutral. Most important nearby hurdle.
6660.00
HVN Cluster (All TFs) ★★☆
High Volume Node across all timeframe profiles. The 6,655–6,665 band attracted significant volume — expect price to slow here and potentially consolidate.
6655.00
Wk 12 POC ★★☆
Point of Control for the week of Mar 17. Heavy volume traded here during the Mar selloff — sellers will likely defend this zone.
6654.50
Swing High ★☆☆
Mar 23–24 bounce high. Minor overhead resistance; part of the 6,632–6,655 supply cluster.
6651.70
10-Day MA ★★☆
Declining 10-day MA sitting 30 pts above price. First dynamic resistance — close above confirms short-term stabilization.
6647.33
Daily Pivot ★☆☆
Standard daily pivot from Mar 24 (H:6684, L:6616, C:6640). Price below = intraday bearish bias.
6646.96
Fib 38.2% (Mar Range) ★★☆
38.2% retracement of the Mar 20 intraday spike (6,483–6,748). Counter-trend rallies commonly stall here.
6632.00
Fib 50% (Full Range) ★★☆
Exact midpoint of the 9-month range — only 10 pts away. Critical near-term test; equal odds of rejection or breakthrough.
6630.00
5-Day HVN ★★☆
Highest volume node in the 5-day profile (6,620–6,640 band). Short-term price acceptance zone — resistance until decisively cleared.
6622.25
Previous close
03/25/2026 · At 5-day POC (6,620) · Inside value area · Bearish while below VWAP 6,665.68
6620.00
5-Day POC ★★★
Point of Control for the last 5 sessions. Most-traded price in the near-term — current price is testing this level. Key pivot for intraday direction.
6617.50
Wk 13 POC ★★★
Point of Control for the current week (Mar 24–25). Most-traded price this week — holding above confirms near-term acceptance; losing it is bearish.
6615.75
Fib 50% (Mar Range) ★★☆
50% retracement of the Mar 20 intraday range. First support on any pullback — mid-range pivot.
6610.00
VAL All-TF / Wk 12 VAL ★★★
VAL is identical across 10/20/60-day and all-data profiles AND aligns with the week 12 VAL. Reclaiming and holding above this confirms return to value — most important support cluster on the sheet.
6609.92
Pivot S1 ★☆☆
First pivot support from Mar 24. Confluent with VAL at 6,610 — forms a tight 6,609–6,616 support shelf.
6597.50
Wk 13 VAL ★★☆
Lower boundary of this week’s value area. Losing this level means price has rejected the current week’s value area — bearish near-term signal.
6598.25
Swing High / S-R Flip ★★☆
Former Mar 23 bounce high, now support. Bulls must defend this on any pullback — classic support-resistance flip.
6593.10
5-Day MA ★★☆
Fast 5-day MA rising from below. Dynamic support in short-term upswings — close below is an early warning.
6584.54
Fib 61.8% (Mar Range) ★★☆
Golden ratio retracement of Mar 20 spike. If 6,598 fails, this is the next meaningful Fibonacci support.
6580.00
Wk 12 VAH ★★☆
Upper boundary of week 12 value area (Mar 17–21). Prior resistance from the selloff week — now a potential support on a pullback, given price is above it.
6579.08
Pivot S2 ★☆☆
Second pivot support from Mar 24. Extended downside target within the 6,573–6,584 support cluster.
6573.50
Mar 23 Low / S-R Flip ★★☆
Mar 23 session low — prior resistance cleared by price. Pullback here tests whether buyers defend the breakout.
6572.50
5-Day VAL ★★☆
Lower boundary of the 5-day value area. Losing this level means price has broken below the near-term acceptance zone — bearish for the short-term structure.
6541.67
Pivot S3 ★★☆
Third pivot support from Mar 24. Extended downside target; often marks a capitulation low when hit intraday.
6540.10
Fib 78.6% (Mar Range) ★★☆
Deep 78.6% retracement of the Mar 20 spike. A break signals near-complete round-trip of the Mar 20 bounce.
6522.26
Fib 61.8% (Full Range) ★★★
Golden ratio retracement of the full 9-month range. One of the most significant levels on the sheet — key bull/bear structural line.
6517.00
Mar 25 Session Low ★★★
Intraday low of the most recent session. The line in the sand — a close below opens the door to 6,483.
6500.00
Round Number ★★☆
Major psychological 6,500 handle. Heavy algo/retail buy orders — expect a significant bounce attempt if tested.
6498.75
LVN (All Profiles) ★★☆
Low Volume Node — identified in the 10/20/60-day and all-data profiles. Thin-volume area where price tends to move quickly. If 6,500 breaks, expect a fast drop through this zone.
6498.30
BB Lower (2σ) ★★★
Lower Bollinger Band — statistical extreme. Closing below is rare and typically precedes a mean-reversion bounce toward 6,757.
6483.50
Mar 20 Swing Low ★★★
Most recent major swing low. The ultimate structural line in the sand — break below opens 6,445 then 6,419.
6457.50
LVN Zone ★☆☆
Low Volume Node from the all-data profile. Thin area between 6,445 and 6,483 — if the Mar 20 low breaks, price may slice through this quickly.
6445.25
Swing Low ★★☆
Intermediate support from early 2026. Failure of 6,483 targets here — a hold sets up a potential higher-low structure.
6425.83
LVN Zone ★☆☆
Low Volume Node — all-data profile. Another thin area; expect fast moves between 6,419 and 6,445 if the zone gives way.
6419.00
Structural Low ★★★
Key structural low from early February. Breaking on volume confirms broader downtrend extension toward 6,353.
6400.00
Round Number ★★☆
Secondary psychological support at the 6,400 handle. Coincides with the Feb 2026 low area.
6398.75
LVN Zone ★☆☆
Low Volume Node — all-data profile. Thin area around 6,400; breakdown through 6,400 round number may see fast continuation.
6366.02
Fib 78.6% (Full Range) ★★☆
Deep 78.6% retracement of the full 9-month range. A break signals the range is in danger of a full round-trip.
6353.25
13-Week Low ★★★
Quarterly low — widely-watched institutional reference. Breakdown here is a significant bearish event.
6340.00
LVN Zone ★☆☆
Low Volume Node — all-data profile. Thin area below the 13-week low; breakdown could accelerate toward 6,300.
6300.00
Round Number ★☆☆
Psychological support with thin price history. Could see fast moves through if broken.
6297.50
LVN Zone ★☆☆
Low Volume Node — all-data profile. Lower boundary of the displayed range; extension support only.
Weekly profiles (last 4 weeks):
Wk 11 (Mar 10 breakdown week) — POC 6,722.50, VAH 6,717.50, VAL 6,692.50
Wk 12 (Mar 17 selloff week) — POC 6,655, VAH 6,580, VAL 6,610
Wk 13 (current week Mar 24–25) — POC 6,617.50, VAH 6,680, VAL 6,597.50
5-day profile:
POC 6,620 — current price is sitting right on it, making it a critical intraday pivot.
VAH 6,680, VAL 6,572.50
HVN cluster 6,630 added as resistance.
High Volume Nodes (HVNs): The 6,655–6,665 band shows up as a heavy-volume cluster across all timeframes — added as a standalone level.
Low Volume Nodes (LVNs): The all-data profile reveals thin-volume gaps at 6,297, 6,340, 6,370, 6,399, 6,426, 6,457, and 6,499 — added as “fast-move” zones where price tends to slice through quickly if the surrounding support fails.
Market Recap
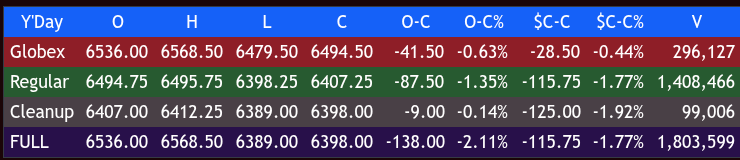
The ES that weakened late Wednesday made a high at 6632.00 and sold off down to 6503.75 on Globex after President Trump’s speech, and opened Thursday’s regular session at 6527.75, down 91.75 points or -1.41% on volume of 395k contracts traded.
After the open, the ES traded up to 6538.50, then sold off down to 6514.25 at 9:40. It rallied 130.25 points up to 6644.50 at 10:35, then sold off 46.50 points down to 6598.00 at 10:50. The ES rallied 27.00 points up to 6625.00 at 10:55, then sold off 38.50 points down to 6586.50 at 12:20. It rallied 27.75 points up to 6614.25 at 12:40, pulled back to 6594.50, and then rallied 20.75 points up to 6615.25 at 1:25.
It sold off 25.00 points down to 6590.25 at 1:50, rallied up to 6609.00 at 2:05, then pulled back to 6598.50 at 2:25. The ES rallied up to 6617.50 at 3:10, pulled back to 6605.00 at 3:30, and traded 6610.00 as the 3:50 cash imbalances showed $3.5 billion to buy and went out to $5 billion to buy.
The ES then traded up to 6625.25 at 3:55 and traded 6623.25 on the 4:00 cash close. I kind of saw this coming when I posted this:
(IMPRO: Dboy: [3:37:20 PM]: popper on the close
After 4:00, the ES traded up to 6628.75 and settled at 6622.25, up 4.50 points or +0.04%, up 3 sessions in a row. The NQ settled at 24,218.00, up 23.25 points or +0.10%, the YM settled at 46,732, down 74 points or -0.16%, and the RTY settled at 2544, up 17.30 points or +0.68% on the day.
In the end, 95% of the selling was done on Globex and just after the 9:30 open. In terms of the ES and NQ’s overall tone, they were bid all day. In terms of the ES’s overall trade, volume was higher at 1.894 million contracts traded.
The markets clawed their way back up as oil gave back some of its Globex and early-day gains. I don’t think Trump’s speech was very specific, yet it provided something for both the bulls and the bears. He continues to say that opening the strait is a problem for other countries, but I don’t understand how that works for the Arab countries that support the US and its military bases after US oil futures saw their largest daily gain since the Covid-19 crash 6 years ago, with oil futures up 66% since the start of the war. This isn’t politics for me; it’s common sense, which it seems the administration is in short supply of.

Guest Posts
Manny – https://x.com/manny_trends
A Quiet Tape… Until It Isn’t
Hope everyone enjoyed some time off this weekend.
Because the market probably won’t be giving us that same luxury.
This week has the look of one of those tense, headline-driven environments where things feel calm… until they are not.
We have ISM this morning, but the real focus is later today.
Trump speaks at 6 PM ET.
And in this tape, that matters.
Because lately, it does not take much to move this market.
One headline… and suddenly we are 50 handles higher or lower. That’s the tape right now.
So if it feels like a waiting game today, that is probably because it is.
My Approach Right Now
I am a technician.
I use a mix of technical structure and flow data.
Price comes first, always.
But when technicals start to get murky, it is important to pivot.
That is when I lean more on the data.
Right now, since forming a rounded top, ES has been trailing its daily 21 EMA.
That doesn’t give us much to work with.
Which means for today, the focus shifts more toward flow for guidance.
What the Book Is Telling Us
The first thing that stands out is positioning.
Open interest is showing clear call dominance above 6511.
That tells you where the pressure sits.
But it also tells you something else.
The market is leaning.
And when the market leans, it becomes sensitive.
Structure First
From a structural standpoint, this is still a “prove it” tape for the bulls.
To maintain any bullish posture, ES needs to hold above 6536.
Lose that, and the door opens to:
• 6511
• 6496
Below that, sellers likely regain control.
That 6496 area is where the tone really shifts.
Above it, we can argue balance.
Below it, the conversation changes.
Intraday Reality: This Looks Like a Range
Despite all the macro noise, the book is not calling for a big move during regular hours.
In fact, it is suggesting the opposite.
A sideways, rotational session.
Which makes sense.
Because the real catalysts are sitting after the close.
So what does that mean for today?
It means we trade levels.
Key Levels for Today (ES)
Support:
• 6546
• 6511–6536 (critical support zone)
Resistance:
• 6566 (GEX resistance)
• 6586 (squeeze trigger / call wall)
• 6611 (next upside magnet)
The Inflection Points
This is where the trade lives today.
Below 6546, DEX is suggesting weakness.
Break it, and we likely rotate toward 6506.
Above 6566, we start to open up upside.
If price can sustain above that level, we likely see a push toward 6611.
But the key level to watch is 6586.
That is your squeeze level.
Break and hold above that, and the market can accelerate quickly.
What Caught My Attention
One thing that stood out was the move in DIX.
A jump from 39% to 50%.
That is not noise.
That is liquidity being added back into the system.
Translation?
Someone bigger is active again.
Now, does that mean straight up?
No.
But it does mean you need to respect the possibility of support showing up when it is least expected.
The Bigger Picture
The overall read here is simple.
This is not a clean trend environment.
This is a range-bound, positioning-driven tape with catalysts sitting just outside of regular hours.
Which usually means:
• Chop during the day
• Movement after hours
• And traders getting frustrated in between
We have all seen that movie before.
The Bottom Line
Today is about discipline.
The market is giving you a range.
Respect it.
6511–6536 is your line in the sand.
6566–6586 is your upside test zone.
Everything in between?
Noise.
And in this type of tape, chasing noise is expensive.
So stay patient.
Because if nothing happens during the day…
There is a good chance something happens tonight.
If this bigger picture is the map, my daily setups are the execution plan. I post them each morning on my X feed, @manny_trends, where I share the levels and structure I am watching for the day ahead. Members of IMPRO are often the beneficiaries of that work.
Manny Payano
@manny_trends
MiM
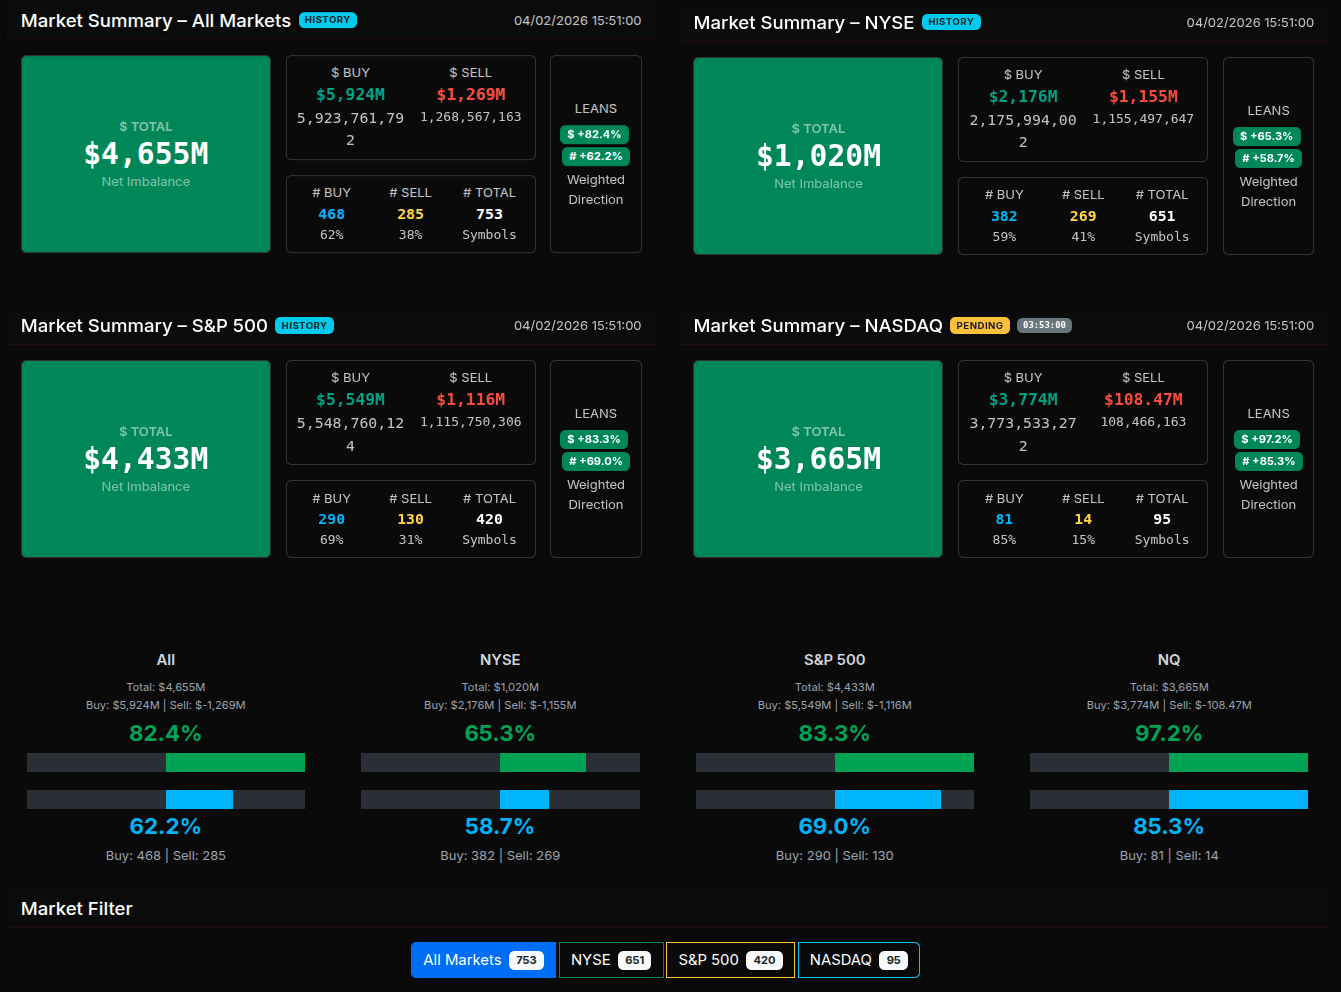
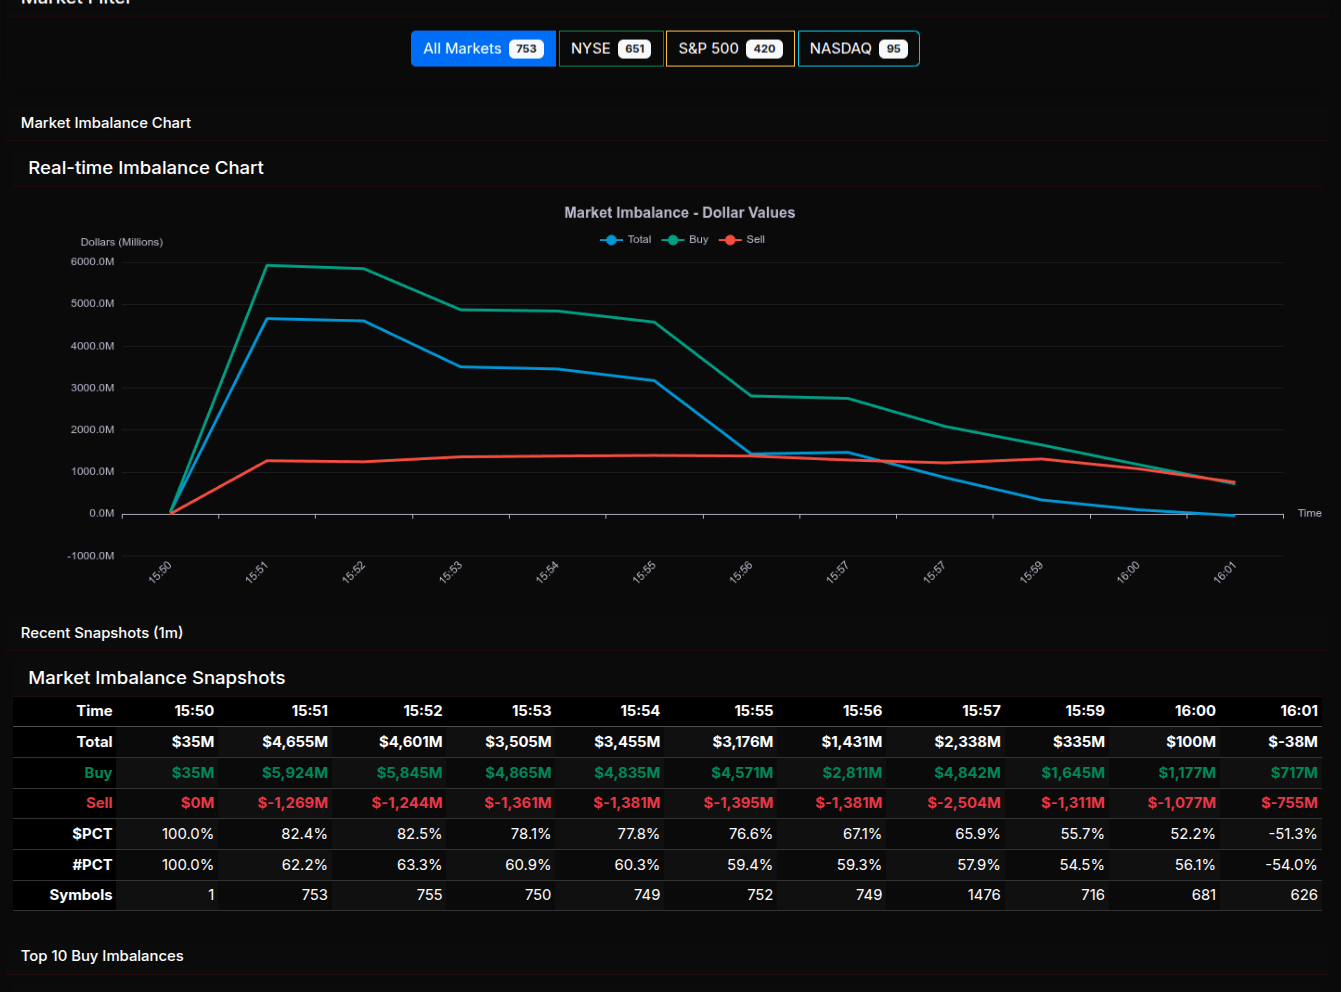
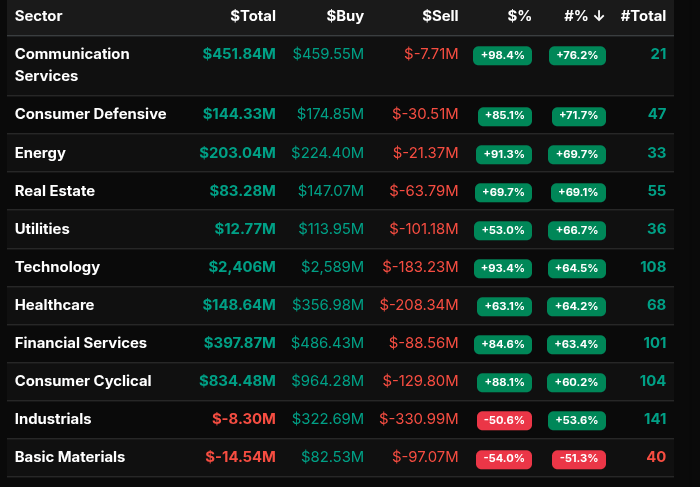
The MOC session opened with an aggressive buy imbalance that immediately set the tone for a demand-driven close. At 15:51, total imbalance surged to roughly $4.6B with buy-side flow exceeding $5.9B, producing a strong +82% lean. This was not rotational activity—it was decisive institutional buying, particularly as the NASDAQ printed an extreme +97% lean, clearly signaling program-driven accumulation rather than passive rebalancing.
As the session progressed, the imbalance steadily decayed but remained firmly bid through 15:55, where total imbalance still held above $3.1B with a +76% lean. This persistence confirms sustained buy programs rather than a one-minute spike. However, from 15:56–15:59, the tape began to transition. Buy pressure faded sharply while sell imbalances increased, compressing the net imbalance down toward $335M and eventually flipping negative into the close (-$38M). This late reversal reflects closing supply stepping in—likely profit taking or offsetting flows after the earlier institutional accumulation.
Sector-wise, the market showed broad-based buying. Technology dominated with $2.4B total and a +93% lean, reinforcing that large-cap growth names were the primary drivers. Communication Services (+98%), Energy (+91%), and Financials (+84%) also exhibited strong directional buying, indicating cross-sector demand rather than narrow leadership. In contrast, Industrials (-50%) and Basic Materials (-54%) were notable outliers, showing true sell-side control and acting as liquidity sources.
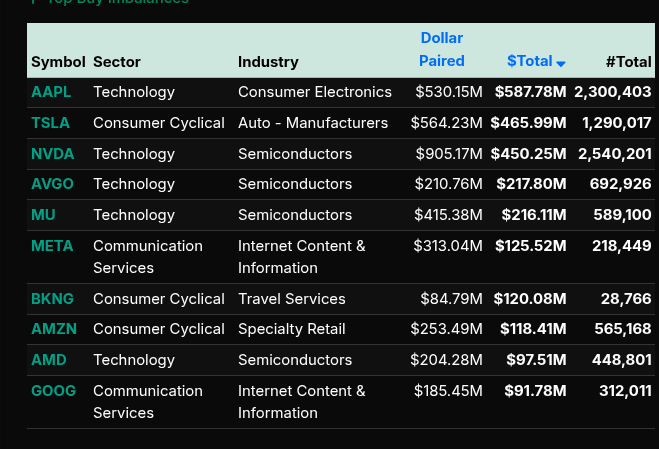
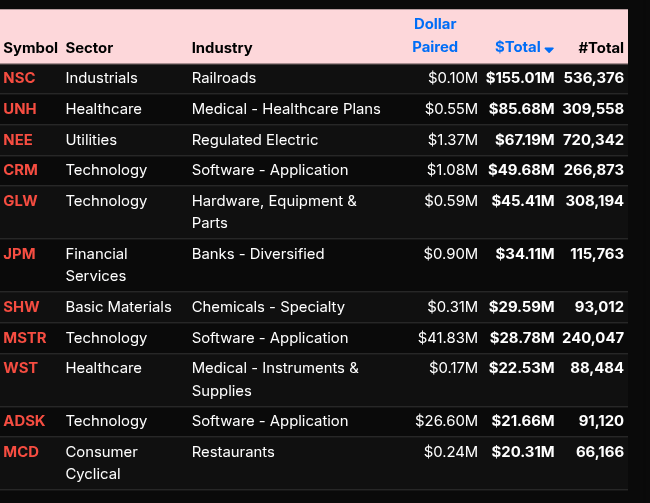
On the single-name level, the strongest buy imbalances were concentrated in mega-cap tech: AAPL ($587M), TSLA ($465M), NVDA ($450M), and AVGO/MU—confirming semiconductor and AI-related flows. These are clear examples of >66% lean behavior, representing wholesale buying. Conversely, notable sells included NSC, UNH, and NEE, suggesting defensive rotation out of certain industrial and healthcare names.
Overall, this MOC profile reflects a strong institutional buy program early, broad sector participation led by tech, and a late-session unwind that shifted the imbalance toward neutral/negative into the close.
Technical Edge
Fair Values for April 6, 2026
-
SP: 38.48
-
NQ: 167.49
-
Dow: 208.92
Daily Breadth Data 📊
For Thursday, April 2, 2026
-
• NYSE Breadth: 60% Upside Volume
• Nasdaq Breadth: 64% Upside Volume
• Total Breadth: 63% Upside Volume
• NYSE Advance/Decline: 58% Advance
• Nasdaq Advance/Decline: 57% Advance
• Total Advance/Decline: 58% Advance
• NYSE New Highs/New Lows: 43 / 89
• Nasdaq New Highs/New Lows: 86 / 184
• NYSE TRIN: 0.93
• Nasdaq TRIN: 0.73
Weekly Breadth Data 📈
For Week Ending April 2, 2026
-
• NYSE Breadth: 59% Upside Volume
• Nasdaq Breadth: 63% Upside Volume
• Total Breadth: 62% Upside Volume
• NYSE Advance/Decline: 75% Advance
• Nasdaq Advance/Decline: 73% Advance
• Total Advance/Decline: 74% Advance
• NYSE New Highs/New Lows: 151 / 305
• Nasdaq New Highs/New Lows: 191 / 734
• NYSE TRIN: 2.00
• Nasdaq TRIN: 1.53

Today’s BTS Levels:
ES M
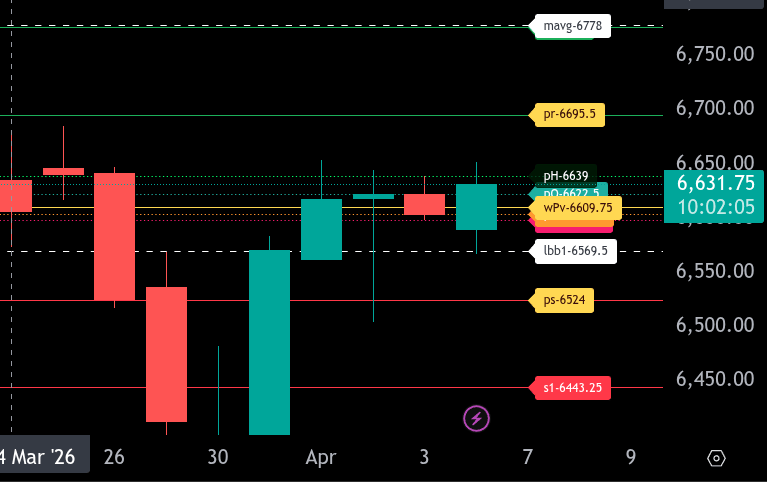
The bull/bear line for the ES is at 6609.75. This is the key pivot for today’s session. Holding above this level keeps the market in a constructive posture, while losing it shifts momentum back to the downside.
Currently, ES is trading around 6631.75, holding above the bull/bear line and attempting to build acceptance. As long as price remains above 6609.75, the path of least resistance is higher, with an initial push toward 6639.00, which has acted as near-term resistance. A clean break and hold above 6639.00 opens the door to 6695.50, our upper range target for today. Additional resistance above comes in near 6695.50, and beyond that the broader moving average resistance sits up near 6778.00.
On the downside, failure back below 6609.75 would signal weakness and likely bring a rotation into 6569.50. This level is key support from prior structure. If 6569.50 fails to hold, the next downside objective comes in at 6524.00, our lower range target. A break below that would expose deeper downside toward 6443.25.
Overall, the market is attempting to stabilize above the bull/bear line. Continued acceptance above 6609.75 favors upside continuation, while rejection back below shifts focus to lower support and range expansion to the downside.
NQ M
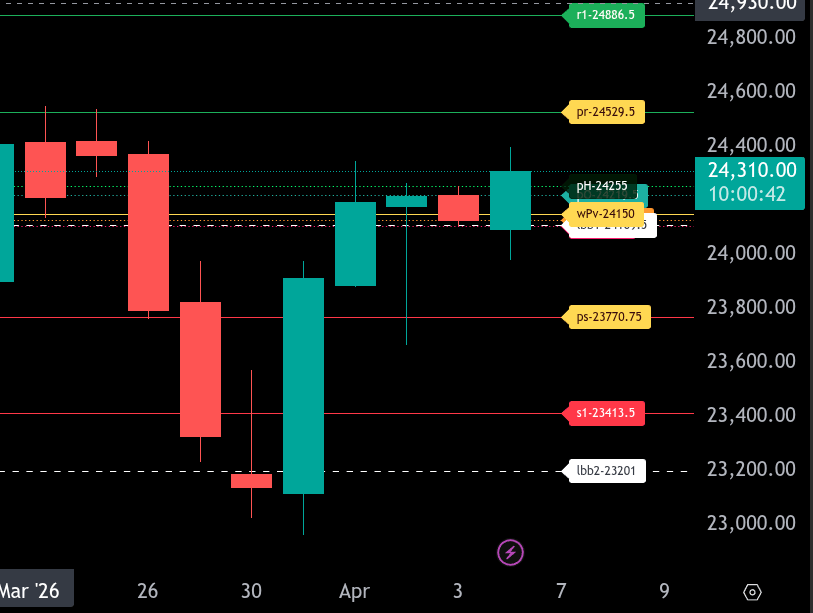
The bull/bear line for the NQ is at 24150. This is the key pivot for today. Holding above this level keeps the market in a bullish posture, while acceptance below shifts momentum back to the downside.
Currently, NQ is trading around 24310, holding above the bull/bear line and attempting to build continuation after the recent recovery. As long as price remains above 24150, dips are likely to be supported.
On the upside, resistance comes in at 24529.50, which is the upper range target for today. A sustained push through 24255 should open the door for a test of 24529.50. If momentum accelerates, extension toward 24886.50 is possible.
On the downside, if price loses 24150, expect a shift in control back to sellers. The first downside target is 23770.75, which is the lower range target. A break below this level exposes 23413.50, with further weakness potentially reaching 23201.
Overall, the market is attempting to stabilize above the bull/bear line. Bias remains cautiously bullish above 24150, but failure to hold this level would likely trigger another leg lower.
Room Summaries:
DTG Room Preview – Monday, April 6, 2026
-
Macro focus: Iran conflict, rising oil prices, inflation, and tariff refund developments are driving sentiment.
-
Inflation watch: Gasoline prices have surged ~$1, likely pushing March CPI higher (core +0.3% m/m expected). This could mark the biggest inflation uptick since 2022.
-
Fed outlook: Strong labor data + rising energy costs reinforce a no-rate-cut path near term.
-
Geopolitics: իրավիճo escalating—Trump threatening infrastructure strikes if Iran doesn’t reopen the Strait of Hormuz, though negotiations may be underway. Oil supply concerns remain even with OPEC+ output increases due to damaged assets.
-
Tariffs: Administration signaling compliance with Supreme Court ruling; refunds coming via a ~45-day, 4-step process. Potentially significant payouts to importers.
-
Today’s data: ISM Services PMI (10:00 ET). Otherwise quiet.
-
Market conditions:
-
Volatility elevated (ES 5-day ADR: 153)
-
No strong overnight positioning (light/mixed flow)
-
-
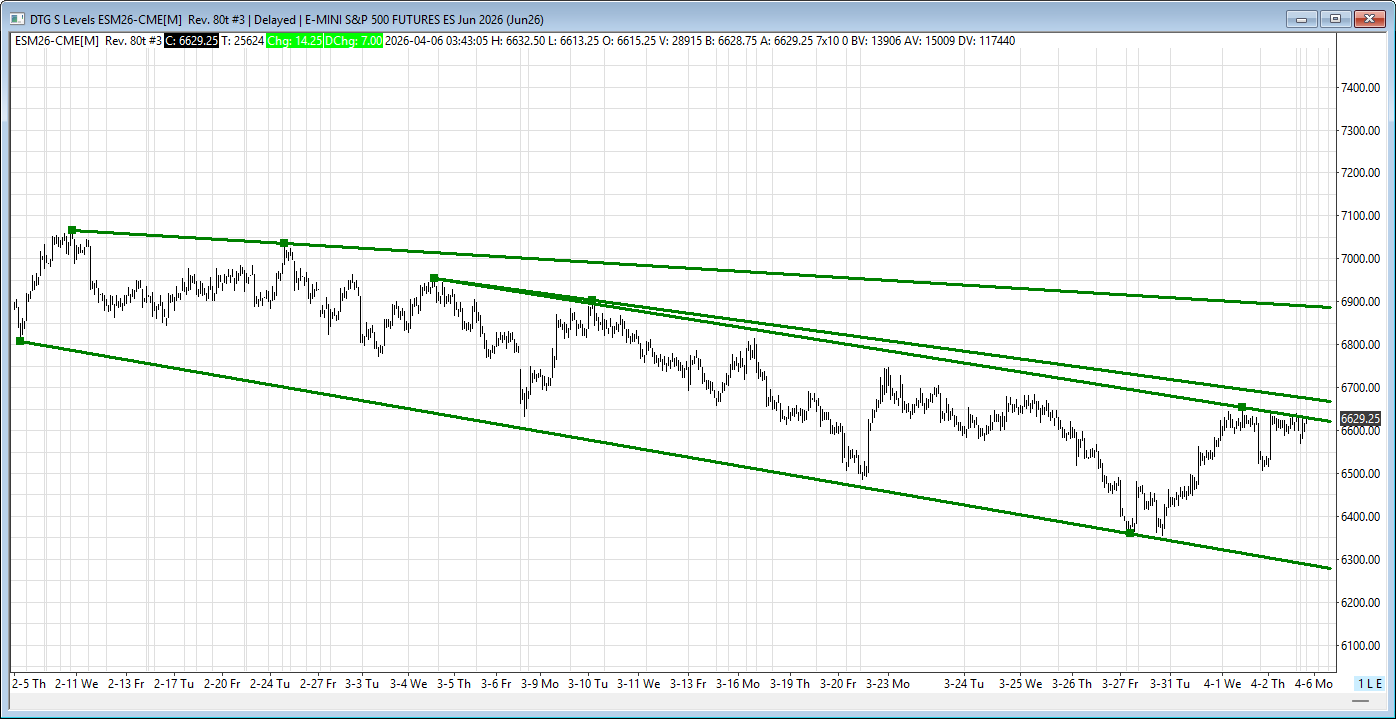
ES Technicals:
-
Resistance: 6630/27 → 6670/65 (key breakout zone for bulls)
-
Support: 6279/74
-
Downtrend intact unless bulls reclaim both resistance levels
-
200-day MA (6781) remains well above; not in play near term
-
Bottom line: Macro + geopolitics remain in control. Bulls need a clean break above 6670s to shift momentum; otherwise, downside structure still dominates.
Affiliate Disclosure: This newsletter may contain affiliate links, which means we may earn a commission if you click through and make a purchase. This comes at no additional cost to you and helps us continue providing valuable content. We only recommend products or services we genuinely believe in. Thank you for your support!
Disclaimer: Charts and analysis are for discussion and education purposes only. I am not a financial advisor, do not give financial advice and am not recommending the buying or selling of any security.
Remember: Not all setups will trigger. Not all setups will be profitable. Not all setups should be taken. These are simply the setups that I have put together for years on my own and what I watch as part of my own “game plan” coming into each day. Good luck!
This post goes out as an email to our subscribers every day and is posted for free here around 2 PM ET. To get your real-time copy, sign up for the free or premium version here: Opening Print Subscribe.
Comments are closed