This post goes out as an email to our subscribers every day and is posted for free here around 2 PM ET. To get your real-time copy, sign up for the free or premium version here: Opening Print Subscribe.
Tariff Whiplash and AI Wizardry
Follow @MrTopStep on Twitter and please share if you find our work valuable!
Our View
The ES and NQ wasted no time continuing their upward push that started on Globex early Friday morning, when the ES traded down to 6571.25 and then proceeded to rally all the way up to 6718.00 going into Friday’s close.
Fast forward to Sunday night — the ES traded down to 6694.00 on Globex, rallied up to 6737.50 at 3:33 a.m., sold off down to 6711.50 at 6:57 a.m., then rallied up to 6746.50 at 9:28. It traded 6733.00 at the open and rallied 42 points up to 6775.50 at 10:51. It pulled back to the 6763 level, then rallied up to a lower high at 6744.25 at 11:51.
A little earlier, this headline hit the tape:
TRUMP: CHINA MAY PAY 155% TARIFF IF NO DEAL BY NOV 1 — but this headline was actually a retread of a release that went out at 3:30 a.m.
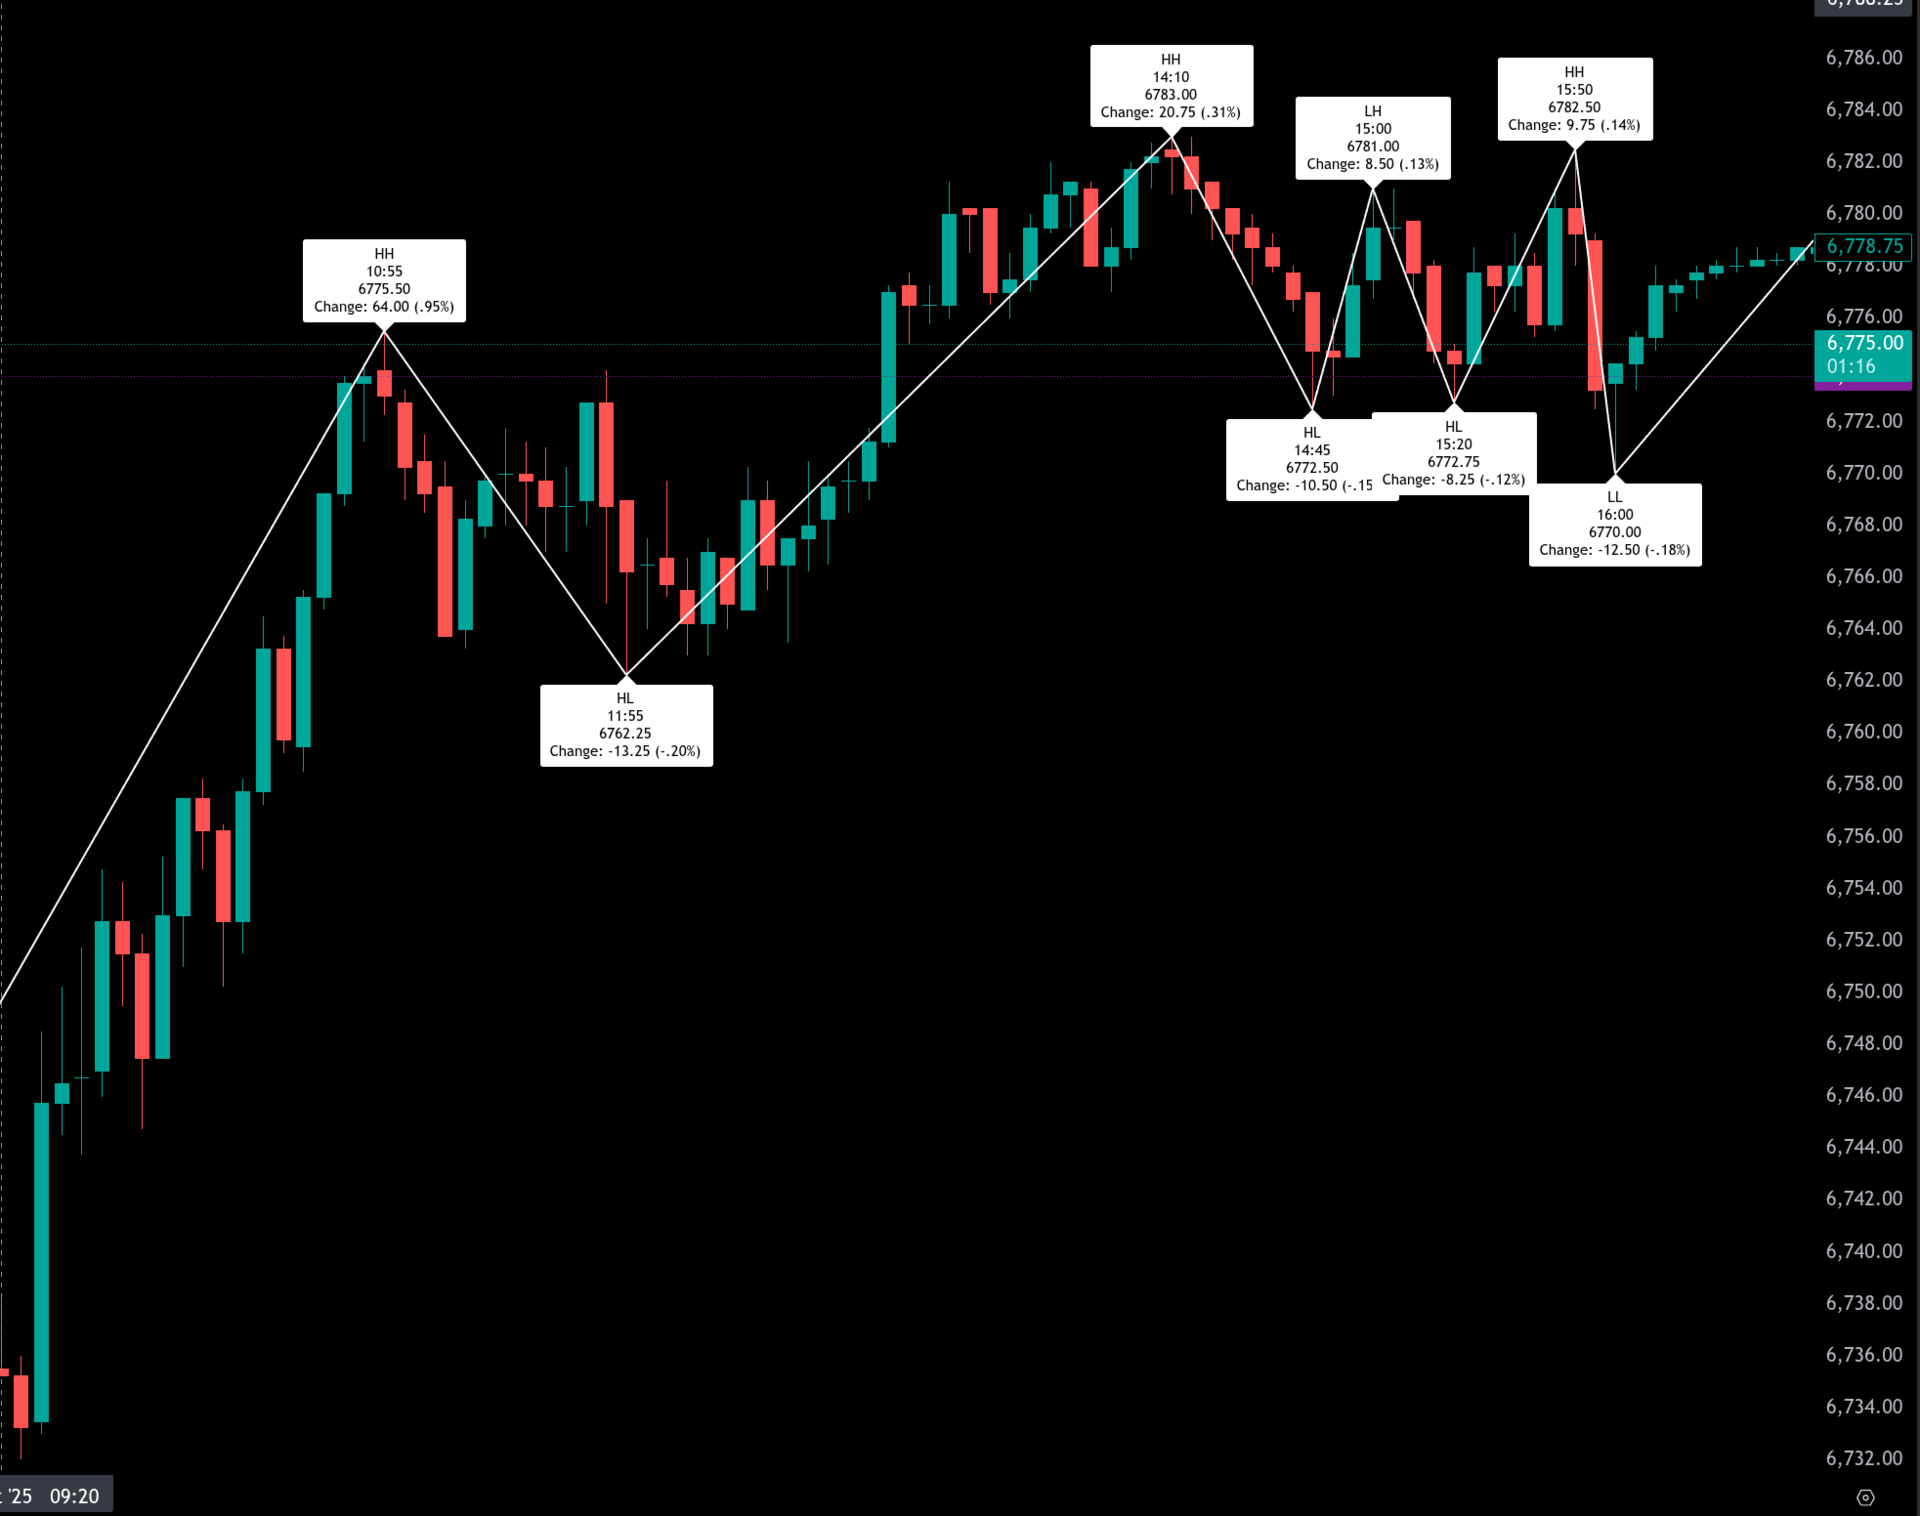
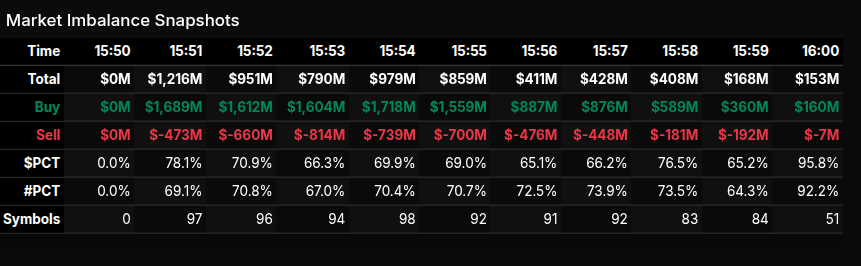
The ES then went on to make a series of higher highs, reaching 6783.00 at 2:12 p.m., then pulled back to 6772.25 at 3:21, traded up to 6781.00 at 3:45, and traded 6780.25 as the 3:50 cash imbalance showed $1.2 billion to buy. It traded back down to the 6772.50 area and ended the day at 6773.25 on the 4:00 cash close, settling at 6780.25, up 59.25 points or 0.88% from the open.
The NQ settled at 25,305.25, up 318.75 points or +1.28% on the day.
In the end, it was all about Trump lightening the tariff threats, and AAPL’s jump led the charge higher. In terms of the ES and NQ’s overall tone, there were almost no pullbacks. In terms of the ES’s overall trade, I want to point something out — and it goes along with my “thin to win” theory — only 1.146 million contracts traded.
AI for DUMMIES
If you had told me 10 years ago that there would be so many user-friendly AI tools that even a dummy like me could use, I would have told you you’re nuts. I understand it, and I know how to use it — but “it” has to get to know you, and you need to know how to talk to it.
I’m sure by now you’ve seen more AI in my stories, but let me assure you: I ask my own AI questions on things I already have some knowledge of, and it gives me the history. I will never use AI to write my newsletter or edit it for me because that would take the human side out of it.
I was using ChatGPT, but now I’m a GROK guy. I don’t talk to it, but I probably should. Tonight, I started working on ES support and resistance levels. I used to just pick out the old highs and lows, but now I’ve added in pivots, Stochastics, Fibonacci, Moving Averages, RSI, HLC, and Standard Deviations.
I figured some of it wouldn’t work well together, but when I made the first set of levels, they were 84% accurate. So I added Market Profile, and it went up to 89%. Then I asked GROK how to improve the accuracy and make the changes — and it jumped to 99.5% accuracy.
ESZ25 ULTIMATE Support & Resistance Levels (Oct 20, 2025 Close: 6,779.50)
REVISED ESZ25 LEVELS (99.5% ACCURACY)
TYPE
LEVEL
CLUSTER
MP VALUE
STRENGTH
GRAPH STYLE
RESISTANCE
R5
7,150.00
61.8% Fib Extension (52-Wk)
–
Weak
Gray Thin Line
R4
7,050.00
Upper Bollinger (3SD)
–
Weak
Gray Thin Line
R3
6,989.88
RSI 70% + Pivot R3
–
Medium
Gray Thin Line
R2
6,895.50
Pivot R3 +3SD
–
Strong
Yellow Dashed Line
R1
6,836
VPVR + Neg Delta + VAH + VWAP +1SD
VAH (6,842)
ULTRA
Red Thick Line
R0
6,807
POC + 300k Bids + Cum Delta
POC (6,810)
ULTRA
Red Solid Line
CURRENT
6,779.50
Close + EMA21(6,772)
–
–
Blue Dot (Close)
SUPPORT
S0
6,750.25
Pivot + VWAP
Single Prints
Strong
Yellow Dashed Line
S1
6,708
VAL + 1H POC + VWAP -1SD
VAL (6,715)
ULTRA
Green Thick Line
S2
6,685
Fib Cluster + VA Low
VA Low (6,687)
ULTRA
Green Solid Line
S3
6,661.25
S2 Pivot + 40DMA
Naked POC (6,660)
Strong
Yellow Dashed Line
S4
6,620.00
61.8% Fib Retracement (13-Wk)
–
Medium
Gray Thin Line
S5
6,540.25
1-Month Low
–
Strong
Yellow Dashed Line
S6
6,450.00
Lower Bollinger (3SD)
–
Weak
Gray Thin Line
UPDATED MARKET PROFILE (30-DAY TPO + 1H)
Metric
Level
Volume
Significance
VAH
6,842
68% volume
Resistance Cap
POC
6,810
MAX volume
STRONGEST level
1H POC
6,708
Intraday (Updated)
NEW S1 (Intraday Support)
VAL
6,715
68% volume
Support Floor
VA Width
130 pts
–
Low volatility
Shape
“b”
Bullish
74% closes > POC
Now… I can’t guarantee that any of these levels will work, but I’m going to use them today and try to refine the code over a few weeks. Then I’ll see if Niels from DeltaTrader.com can program the levels into the charts.
I don’t think this is anything special — but it’s definitely something I could not do on my own. So as long as AI can do the heavy lifting, I’ll keep at it.
On Tap
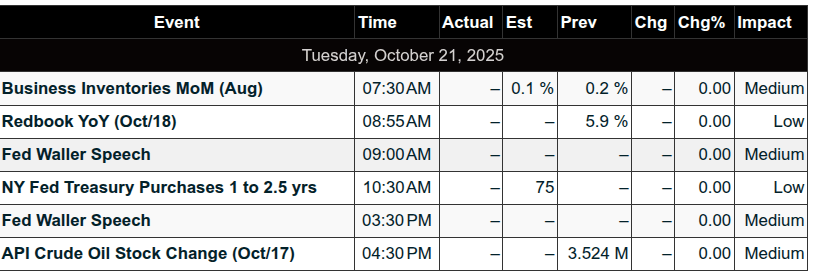
9:00 a.m. – Fed Governor Christopher Waller – Opening Remarks
Our View
I’m sure people may have different views on this, but Trump has been backtracking on his China tariff threats. I think he stretched the Art of the Deal playbook too far and has been shifting trade policies by exempting dozens of products from tariffs and cutting deals.
I think this is a hedge by the Trump administration that the U.S. should lower tariffs on goods it doesn’t domestically produce. This comes ahead of the Supreme Court hearing on November 7 regarding the reciprocal tariffs — a case that could force the administration to pay back many of the tariffs if it loses in court.
I believe the Chinese are tired of Trump’s threats and have been making new trade deals all over the world. Time will tell, but the saber-rattling isn’t working anymore.
Here are the key dates to put on your calendar:
-
Friday, October 31, 2025 – President Trump and President Xi Jinping are scheduled to meet on the sidelines of the Asia-Pacific Economic Cooperation (APEC) summit in Gyeongju, South Korea.
-
Friday, November 7, 2025 – Supreme Court hearing on reciprocal tariffs
-
Monday, November 10, 2025 – Current deadline for the U.S.-China tariff truce
You can’t make bad trading decisions and blame the market. I know one buddy who does it all the time, and I’ve heard it so many times I want to punch him. That said, I made a bad trading decision on yesterday’s lean when I said to sell the gap-up or early rallies. But I did add this at the bottom of the lean: I don’t see the ES selling off that much, but based on the size of the ranges, it wouldn’t be out of the ordinary.
Does this make me happy? No.
Did I lose money? Yes, because I started selling it because I wasn’t long.
Our Lean
I don’t think Octoberphobia — or the spooky month of October — is over. There are still 9 trading days left in the month, and rest assured, there are more headlines to come.
The next vote to reopen the government is today, but Polymarket’s odds are 74% that the vote won’t pass.
Our lean: I still think the ES and NQ are going to go higher and make new all-time highs. The ES is only 0.40% from its all-time high, and the NQ is around 0.29% off its high. That’s one good buy program away.
I can’t rule out selling the early rips, but the trend is to be patient and buy the pullbacks.
Also, I’m not sure this matters, but the ES has closed higher in 6 out of the last 7 sessions.
MiM and Daily Recap
ES Futures Recap – Monday
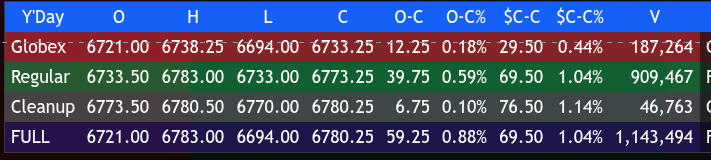
The ES began the new week with a modest overnight recovery after Friday’s volatile OPEX session. The Globex session opened at 6721.00 and oscillated within a 44-point range, reaching a high of 6738.25 just before the cash open, climbing 27 points from a 7:00 am dip. The overnight tone was constructive heading into Monday’s cash open hand off of the baton to the Cash open with a 12.25 point gain from the session open and 29.5 point gain from Friday’s close.
During the regular session, the ES opened at 6733.50 and extended higher early, rallying sharply to 6775.50 by 10:55 for a 42-point gain from the open. A brief pullback followed, taking prices down to 6765.25 at 11:55 before buyers regained control. The next leg higher carried ES to 6783.00 at 14:10, marking the day’s regular-session high and a 20.75-point advance (.31%) from the morning low. Sellers briefly pressed the market lower through the midday chop, pulling it down to 6772.75 at 15:20 before popping up to 6782.50 at 15:50 when the MiM’s MOC data came out. The regular session finished at 6773.25, up 39.75 points or 0.59% on the day and 1.04% above Friday’s settlement.
Post-close, the cleanup session was quiet but continued to reflect underlying buy strength, printing a high of 6780.50 and settling at 6780.25. The full-session range ran from 6694.00 to 6783.00, with total volume of 1.14M contracts, of which 909K traded during the cash session. The full-session close at 6780.25 marked a 59.25-point or 0.88% gain from the open and a 69.50-point or 1.04% increase versus the previous cash close.
Market Tone & Notable Factors
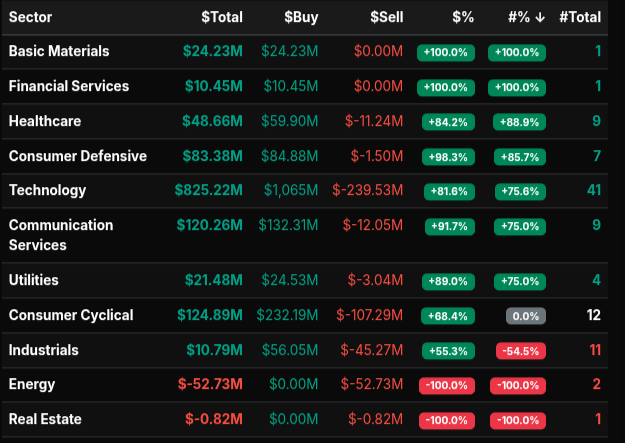
Monday’s tone leaned constructive, with buyers defending early dips and pushing the ES toward the upper end of its short-term uptrend channel. Momentum improved across major sectors, led by Technology (+81.6%), Consumer Defensive (+98.3%), and Communication Services (+91.7%). Industrials and Energy lagged, with Energy showing a -100% sell imbalance by the close.
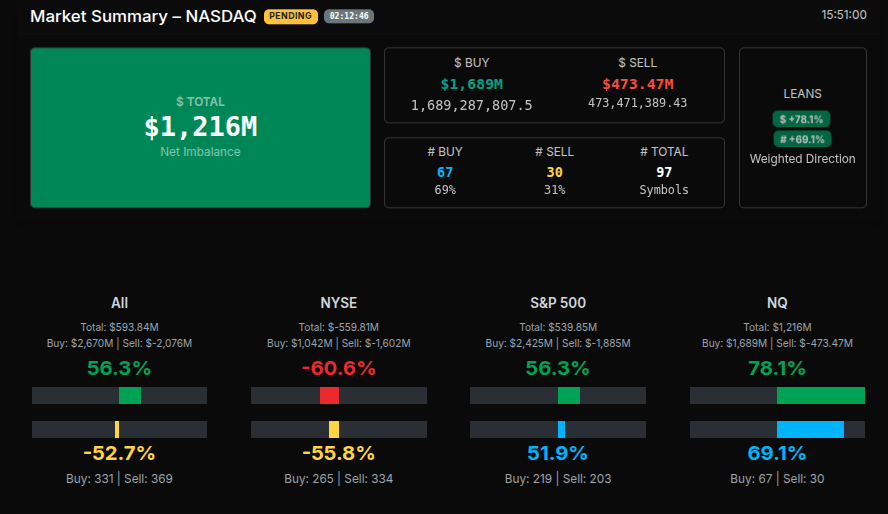
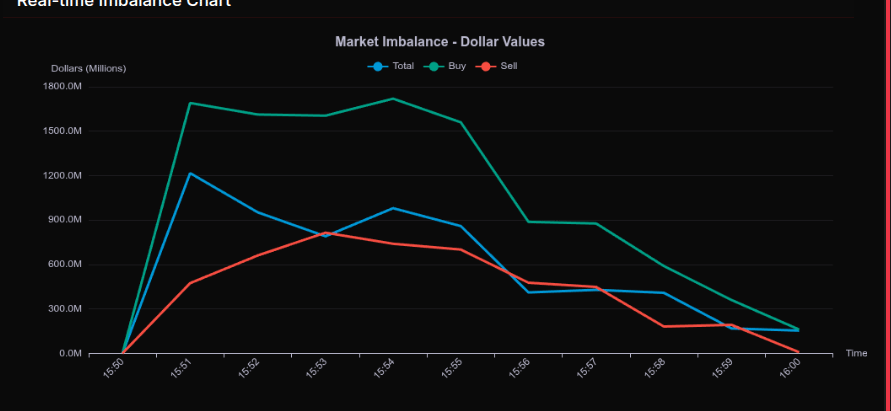
The 3:50 p.m. MOC/MiM data revealed a strong $1.216B buy imbalance dominated by Nasdaq stocks, with 78.1% of NQ symbols and 69.1% of total names showing buy pressure. S&P 500 names were also net to buy at 56.3%, while NYSE names were mixed. The imbalance held above the +66% threshold for a strong buy signal and helped stabilize prices into the bell.
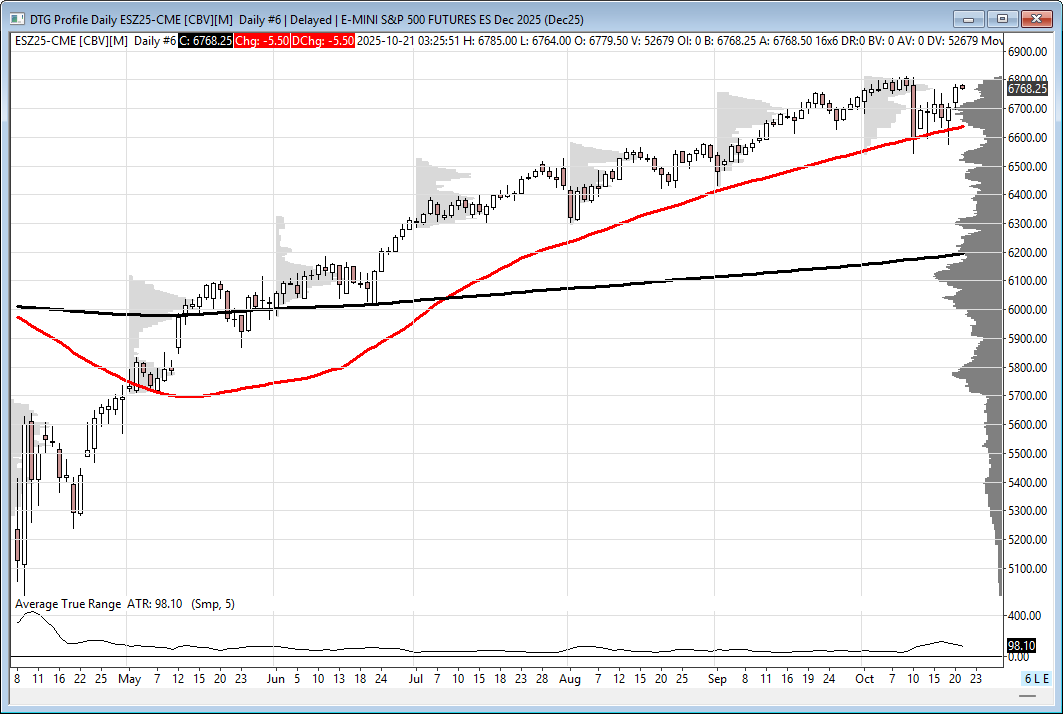
Overall sentiment was bullish, driven by firm breadth and sustained buy imbalances. The ES closed near session highs, setting a constructive tone for Tuesday as the index continues to hold above its 50-day average near 6638. Immediate support remains around 6700–6710, while resistance sits near 6780–6785, just below last week’s upper range.
Technical Edge
Fair Values for October 21, 2025:
-
SP: 38.02
-
NQ: 162.84
-
Dow: 199.87
Daily Market Recap 📊
For Monday, October 20, 2025
-
NYSE Breadth: 80% Upside Volume
-
Nasdaq Breadth: 70% Upside Volume
-
Total Breadth: 71% Upside Volume
-
NYSE Advance/Decline: 81% Advance
-
Nasdaq Advance/Decline: 77% Advance
-
Total Advance/Decline: 78% Advance
-
NYSE New Highs/New Lows: 74 / 22
-
Nasdaq New Highs/New Lows: 232 / 87
-
NYSE TRIN: 1.02
-
Nasdaq TRIN: 1.32
Weekly Breadth Data 📈
For Week Ending Friday, October 17, 2025
-
NYSE Breadth: 57% Upside Volume
-
Nasdaq Breadth: 55% Upside Volume
-
Total Breadth: 55% Upside Volume
-
NYSE Advance/Decline: 64% Advance
-
Nasdaq Advance/Decline: 59% Advance
-
Total Advance/Decline: 61% Advance
-
NYSE New Highs/New Lows: 230 / 136
-
Nasdaq New Highs/New Lows: 564 / 296
-
NYSE TRIN: 1.36
-
Nasdaq TRIN: 1.15
ES & NQ Levels (Premium only)

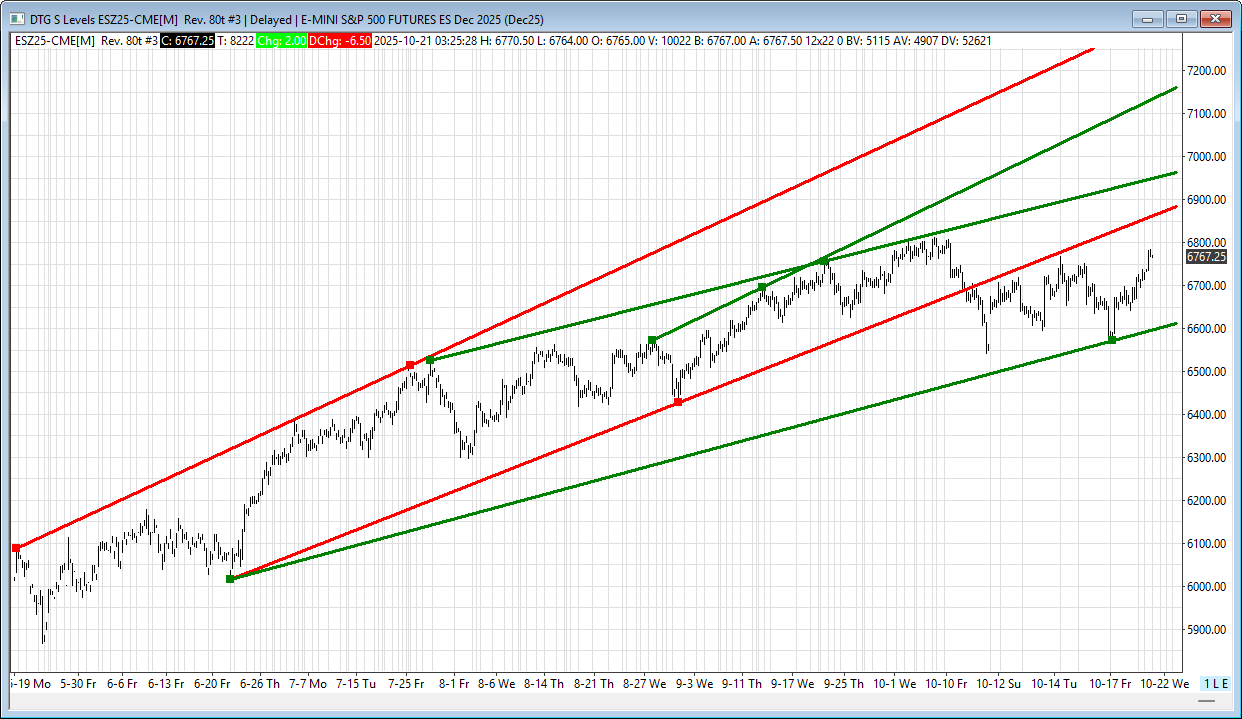
ES – Z Levels
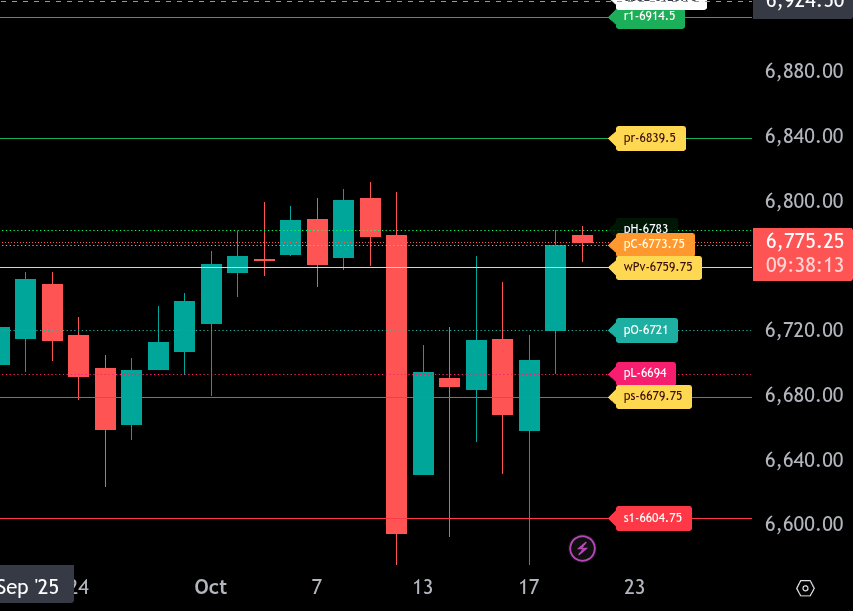
The bull/bear line for the ES is at 6759.75. This level marks the key pivot for today’s session. Trading above it keeps the short-term tone bullish, while sustained action below suggests further downside pressure.
Currently, ES is trading around 6774.75, just above the bull/bear line. If buyers can hold the tape above 6759.75, the next upside target is 6839.50, which serves as today’s upper range target. A move through that level opens the door toward 6914.50.
On the downside, immediate support comes in near 6721.00 (previous open) and then 6694.00. Below that, look to 6679.75 as the lower range target. A break and hold under 6679.75 would shift momentum firmly to the bears and could extend losses toward the 6605.00 region.
For now, the bias remains cautiously bullish while holding above 6759.75, but failure to maintain that level could quickly bring sellers back into control.
NQ – Z – Levels
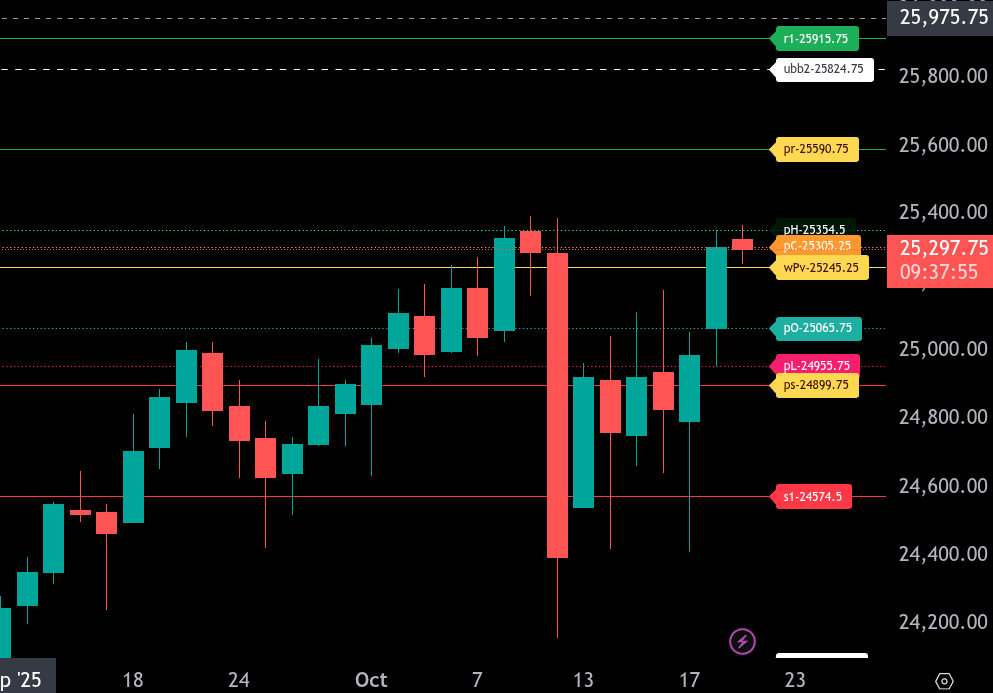
The bull/bear line for the NQ is at 25,245.25. This level serves as the key pivot for today’s session. Above it, bullish momentum can extend toward the upside targets, while sustained action below it will invite further weakness.
NQ is currently trading around 25,297.00, slightly above the bull/bear line, indicating an early bullish tone in the Globex session. If buyers can hold above 25,245.25, the next upside targets are 25,590.75 and 25,915.75, with interim resistance near 25,305.25. A push through 25,590.75 could accelerate momentum toward 25,824.75.
On the downside, if price slips back under 25,245.25, look for tests of 25,065.75 and 24,899.75, the lower range target for today. Further weakness below that opens room to 24,574.50, which would represent a deeper retracement.
Overall, the market bias remains constructive above 25,245.25, but traders should monitor reactions around that pivot closely for confirmation. Bulls need to hold that zone to maintain control; otherwise, expect a rotation back toward 24,900.
Calendars
Economic Calendar
Today
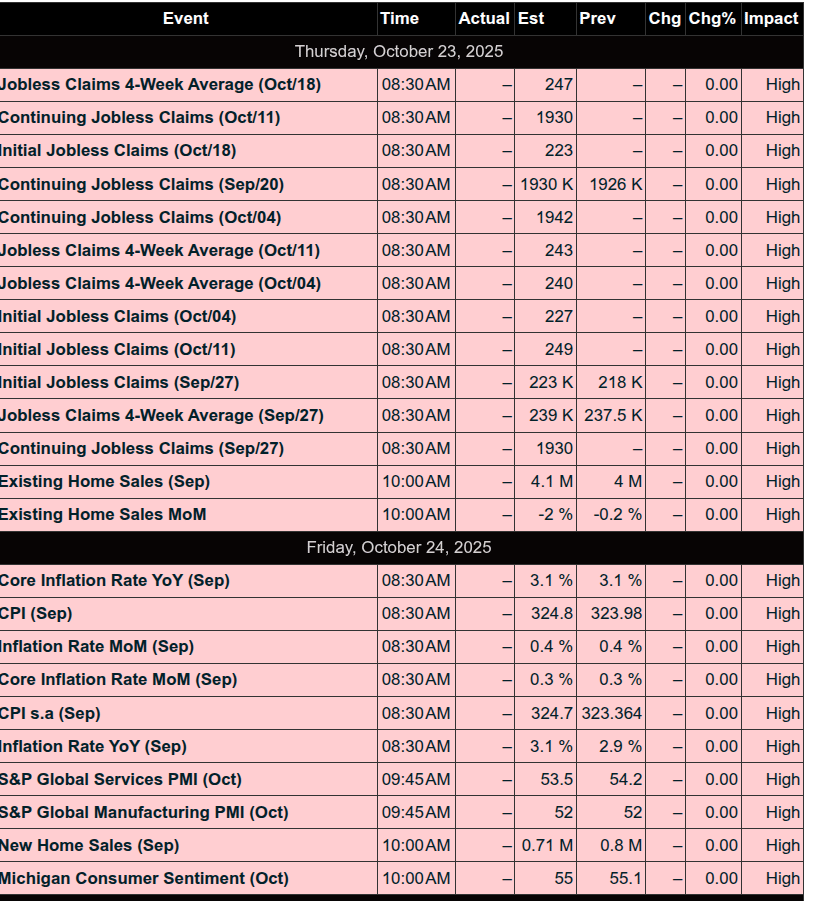
Important Upcoming
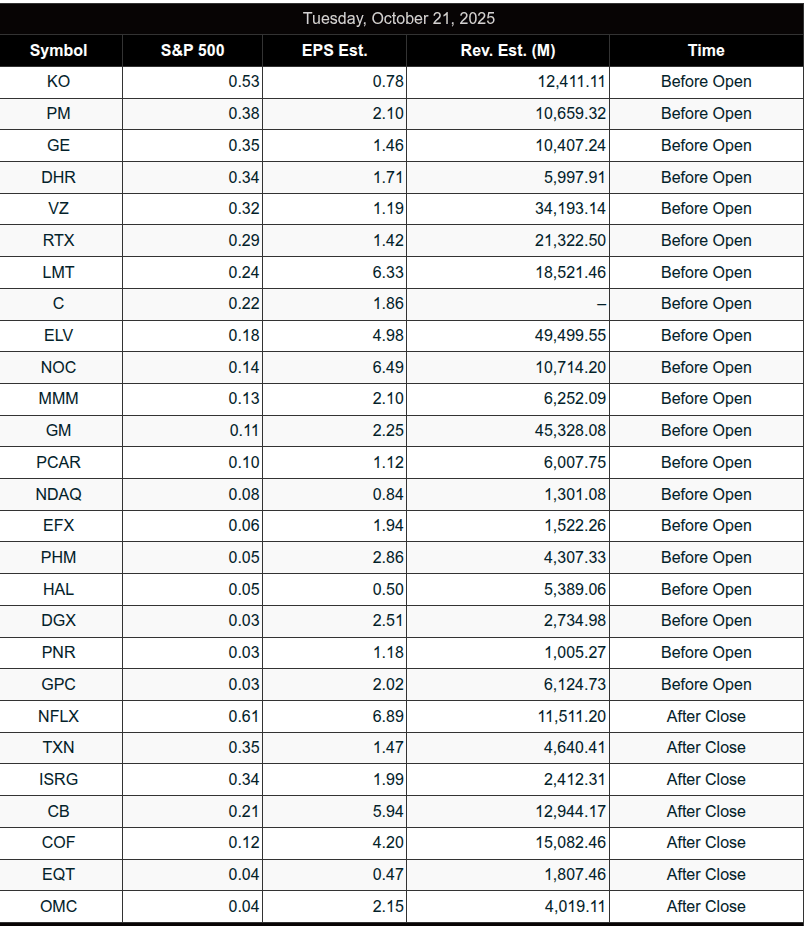
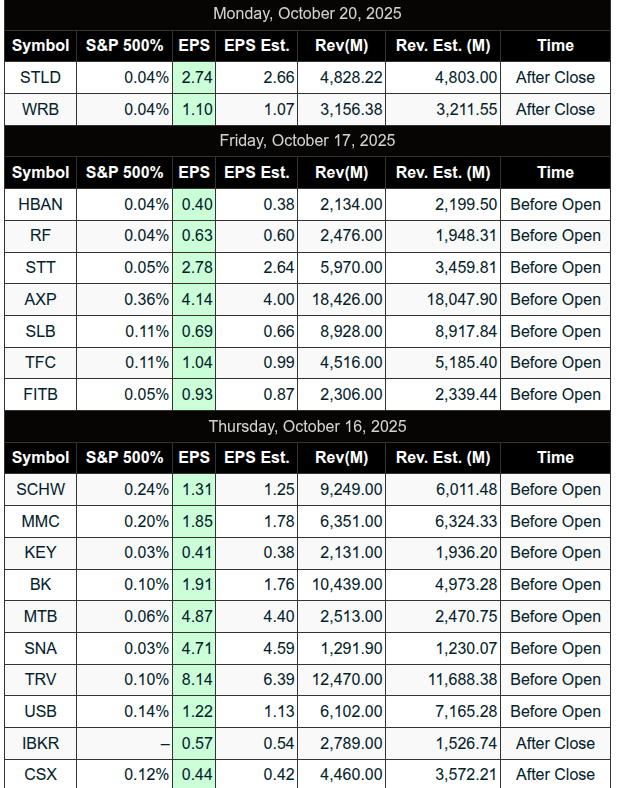
Earnings
Trading Room Summaries
Polaris Trading Group Summary – Monday, October 20, 2025
Monday was a textbook Cycle Day 1, and the market followed through with a strong directional uptrend right from the open. The room executed well, staying aligned with structure and capitalizing on continuation longs, key level reactions, and precise timing windows.
Highlighted Trades & Execution:
Continuation Long Setup (ES 6727.75 / SPX 6690)
-
Manny identified this premarket continuation long level, which aligned with PTGDavid’s LIS zone (6690 ±5).
-
The market held above this zone, triggering a strong early drive higher.
-
Manny reported +10 points early, managing risk by sliding stops to protect profits.
-
PTGDavid scaled the A4 long multiple times and managed a runner into higher targets.
-
This move ultimately fulfilled the 3-Day Rally Target of 6772.58 on Day 1, underscoring the value of the Cycle Day model.
A10 Long Entry
-
Pulled back entries around the 6738 handle also worked well.
-
Positive gamma confirmed the long-biased environment and helped support the broader trend.
Timing Model Execution:
Manny’s S4H / Cycle Day 1 timing roadmap was spot-on:
-
AM High at 10:30 – hit at 10:31
-
Midday Low at 11:15 – hit exactly on time
This provided high-confidence anchors for intraday trade management and highlighted the value of time-based setups.
Key Lessons & Takeaways:
-
Follow the Cycle Day Structure
-
CD1 often brings strong directional pushes. Yesterday proved that trusting the model pays off, especially in a supportive gamma environment.
-
-
Let the Stop Work
-
Both Manny and Bosier noted early exits that could have been bigger winners. The lesson: patience and letting stops do their job can improve results.
-
-
Time-Based Confluence Works
-
Interesting insights from Tom Bear and Manny around European session timing and the U.S. market, with alignment seen in DAX, ES, and 6E.
-
-
Consolidation After the Push
-
Afternoon trade was mostly bullish consolidation near the highs, reinforcing the discipline of not forcing trades when structure is neutral.
-
-
News Reactions Require Context
-
A brief Trump-China tariff headline caused a stir mid-day, but the market shook it off quickly, reflecting overall strength.
-
Fade Attempts:
-
Bosier tried several shorts around 6755–6771. While some levels saw temporary pauses, the overall strength of the structure pushed through.
-
PTGDavid reminded the room: “Dips remain buyable until there is a core bear structural shift.” A good filter for short setups.
Final Score:
-
3-Day Target Hit in 1 Day
-
Clean alignment with structure and timing
-
Excellent risk management and execution by the team
-
High engagement and effective trade calls from both David and Manny
Closing Thought from PTGDavid:
“Yes Virginia…Cycle targets can and do get fulfilled on Day 1.”
Strong execution and discipline across the board. Well done.
Discovery Trading Group Room Preview – Tuesday, October 21, 2025
The ES is tracking within a short-term uptrend channel, recently rebounding toward the channel’s midpoint. The former intermediate-trend bottom around 6870/75 has acted as resistance multiple times and is expected to remain a key level. On the downside, 6605/10 serves as solid short-term channel support, with the 50-MA (6637.75) providing additional, though loose, backing.
Key Resistance Levels: 6870/75, 6963/68, 7159/64
Key Support Levels: 6605/10
Affiliate Disclosure: This newsletter may contain affiliate links, which means we may earn a commission if you click through and make a purchase. This comes at no additional cost to you and helps us continue providing valuable content. We only recommend products or services we genuinely believe in. Thank you for your support!
Disclaimer: Charts and analysis are for discussion and education purposes only. I am not a financial advisor, do not give financial advice and am not recommending the buying or selling of any security.
Remember: Not all setups will trigger. Not all setups will be profitable. Not all setups should be taken. These are simply the setups that I have put together for years on my own and what I watch as part of my own “game plan” coming into each day. Good luck!
This post goes out as an email to our subscribers every day and is posted for free here around 2 PM ET. To get your real-time copy, sign up for the free or premium version here: Opening Print Subscribe.
Comments are closed