This post goes out as an email to our subscribers every day and is posted for free here around 2 PM ET. To get your real-time copy, sign up for the free or premium version here: Opening Print Subscribe.
Tech Euphoria or Bubble 2.0? Market Momentum Faces Reality Check
Follow @MrTopStep on Twitter and please share if you find our work valuable!
Our View
-
HSI -1.09%
-
CAC +0.21%
-
DAX -0.32%
-
FTSE -0.20%
-
VIX -2.99% @14.93
ES
-
Open: 6405.00
-
High: 6431.00
-
Low: 6401.00
-
3:50 Imbalance: -830M
-
4:00 Cash Close: 6425.75
-
5:00 Settlement: 6428.25
-
Total Volume: Record Low 773k
I used to post the foreign market net changes all the time, but I always felt the S&P was the world’s leading index. While it’s still the largest individual country index in the world, year-to-date there has been a record $46 billion rotated out of the U.S. stock market into European equities. UBS estimates that over the next five years, another $1.4 trillion will move from the U.S. to Europe. I’m not saying people don’t look at foreign markets, but times have changed.
The ES pulled back on Globex as the European indices weakened slightly and traded down to 6401.00. It doesn’t really matter what we think — what matters is the current price action, which has been very distinct: small pullbacks followed by higher prices. Like I always say, I’m not here to fight City Hall. If the S&P is going up, I want to go along for the ride. But I’m starting to wonder how much longer the ride lasts before it starts to peter out.
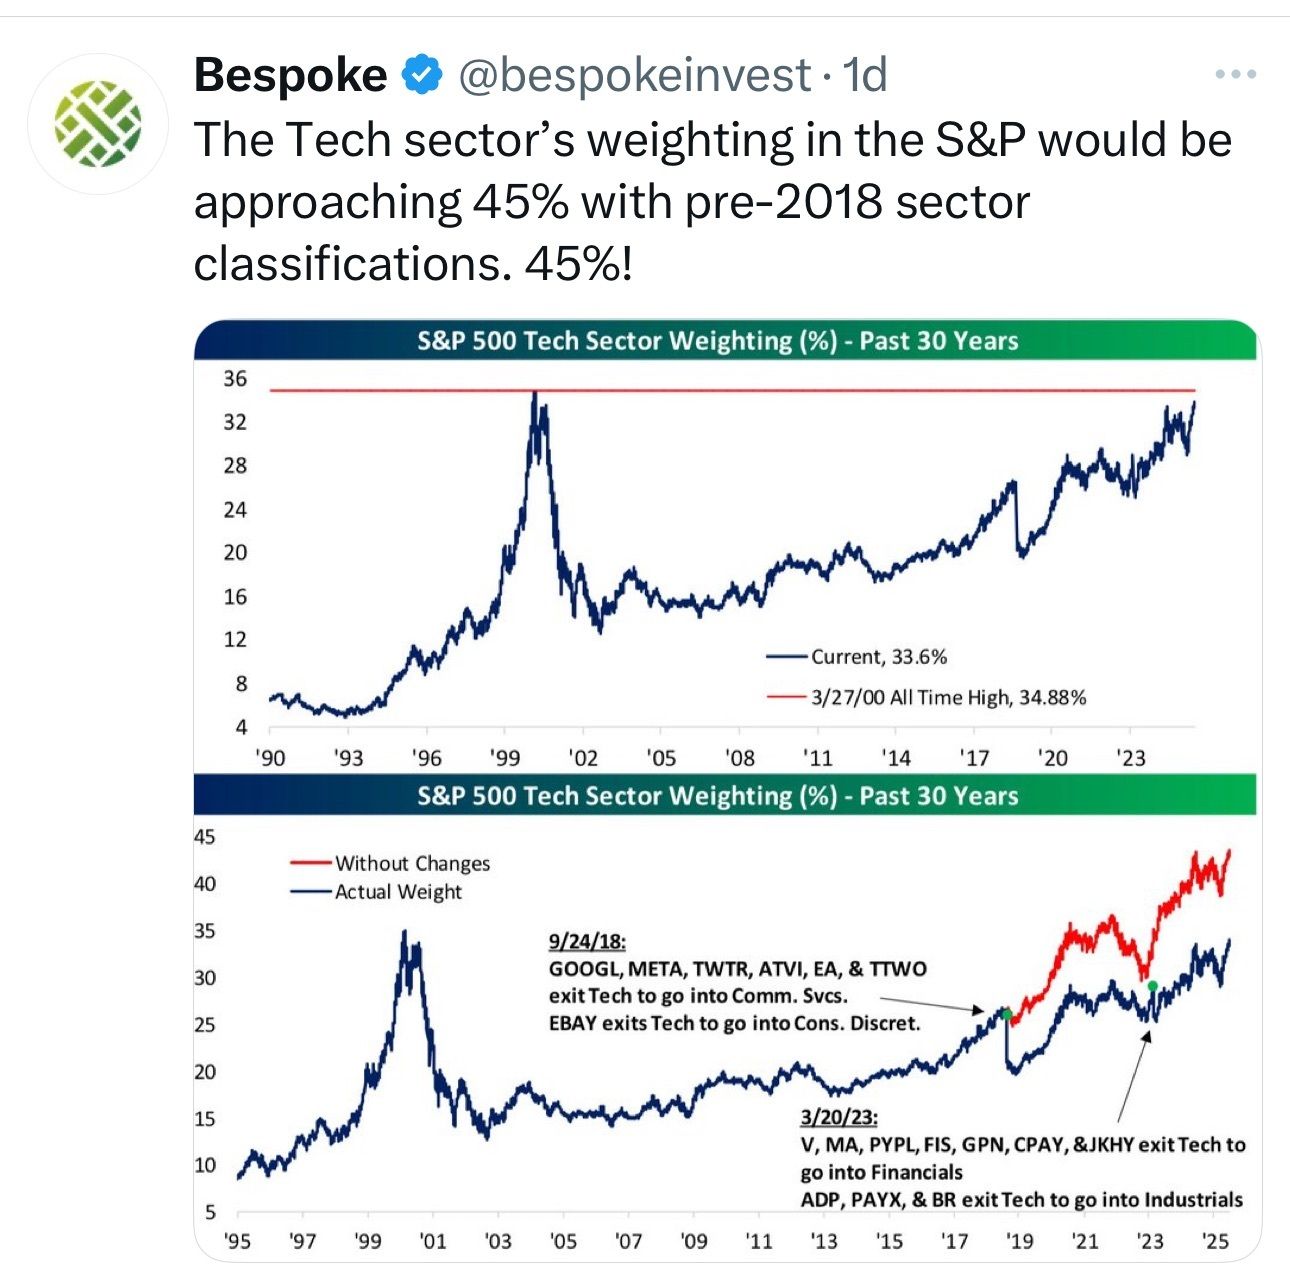
I was probably saying this last year, but this looks like the lead-up to the 2000 Tech Bubble. In fact, by some measures, the concentration of tech and related industries in U.S. equity markets now exceeds the previous record of 33% set in March 2000. Eight of the top ten companies by market capitalization are tech or communications giants. The tech sector is experiencing extremely high valuations, with some analysts noting similarities to valuation levels seen before the 2000 crash. The forward price-to-earnings ratio of the S&P 500 has approached 2000-era levels (around 24x), topping out at about 23x in 2021 and earlier this year.
There’s a clear technology transfer happening. In the 1990s, it was all about the internet. Today, it’s about artificial intelligence growth excitement. But the one big difference is: back then, many companies had no balance sheets, whereas today, these are mega-cap companies with massive balance sheets.
Some experts believe the current tech boom, driven by AI, is more extreme than the late 1990s.
During the Dot-com Bubble, the Nasdaq peaked at 5,048.62 on March 10, 2000, and dropped a whopping 78%, or $5 trillion in market capitalization, bottoming at 1,114 by October 2002. Currently, there are no $5 trillion companies, but NVDA is the closest at $4.24 trillion, Microsoft at $3.78 trillion, and in third place, Apple comes in at around $3.2 trillion.
Tariff Rally
The S&P 500 futures ($ES) three-day drop following President Trump’s “Liberation Day” tariff announcement was one of the worst sell-offs since World War II. But after the S&P made its low on April 7th, the ES has closed higher in 59 of the last 72 sessions — up 59 / down 13. That is an incredible run, and it doesn’t look like it’s over.
Meme Stocks
Meme stocks are the new craze:
-
$OPEN up 170% in 5 days
-
$GPRP up 65% in a week
-
$KSS was up 50% in a week
-
$DNUT rose 325% in a week
Other names bubbling up include Vicor, 1-800-Flowers, Campbell’s, Polaris, Wendy’s, Novavax ($NVAX), Rocket Companies ($RKT), and even larger ones like Tesla ($TSLA) and Shopify ($SHOP) getting meme treatment. It’s all being pushed by social media platforms like Reddit’s WallStreetBets, Stocktwits, and X, fueling explosive rallies in heavily shorted names through hype, options trading, and short squeezes. Volumes have jumped as much as 80% to 1,590% in $DNUT’s case. $OPEN went from an average daily volume of 319 million shares (from July 1 to July 20) to 1.9 billion on July 22. This is where all the action has moved to.
Our Lean
I seriously hope we see a pickup in trade this week. The ES and NQ are coming off record runs going into a busy week of economic reports, corporate earnings, Fed speak, and the July jobs report.
There are 16 economic reports, including ADP, GDP, Pending Home Sales, PCE, PMI, ISM, and Construction Spending. Additionally, 164 companies in the S&P report earnings this week.
-
Tuesday: Boeing reports before the bell, Starbucks after the bell
-
Wednesday: Microsoft and Meta report after the close
-
Thursday: Apple, Amazon, and Coinbase report after the bell
And last but not least, the Fed’s two-day meeting, which will likely keep rates unchanged but will probably signal rate cuts in the fall.
That’s a lot of wood to chop in four days.
Trump inked a deal with the European Union on Sunday, imposing a 15% import tariff on most EU goods, averting a spiraling battle between two allies that account for almost a third of global trade. Chinese negotiators meet in Stockholm on Monday to tackle long-standing economic disputes and extend their current reciprocal tariff truce by another 90 days. Somehow, I don’t think that’s over.
Our lean: I think you should be on guard for some downside — I’m just not sure when. One thing that has definitely not worked in favor of the downside is the EXTREMELY low volumes. Only 773k ES contracts traded on Friday, including Globex, and NYSE volume has dropped 29.41% from a month ago.
That said, today is the only day of the week without economic reports, major earnings, or Fed speak. I still want to buy the pullbacks and would look to fade any big gap up or down on the open.
My levels to watch:
6473, 6460, 6451.32, 6450.48, 6445, 6439.82, 6427.42
Close: 6425.00
6401.08, 6393.52, 6377.64, 6360, 6313
From Jeff Hirsch – Stock Trader’s Almanac

August has been weaker in post-election years
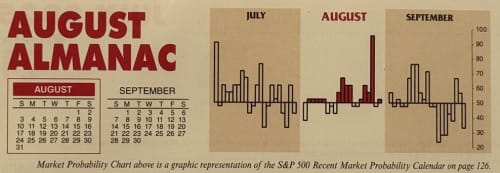
Agriculture and farming made August a great stock market month in the first half of the Twentieth Century. It was the best DJIA month from 1901 to 1951. (See page 42 of the 2025 Almanac comparing the seasonal patterns of DJIA before and after 1950.) Now it is the worst DJIA and Russell 2000 and second worst S&P 500, NASDAQ, and Russell 1000 month over the last 37 years, 1988-2024 with average performance ranging from +0.1% by NASDAQ to a –0.8% loss by DJIA. In 2022, DJIA, S&P 500, NASDAQ, and Russell 1000 all declined over 4% in August and in 2023 they declined 1.8% or more.
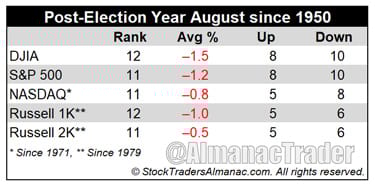
In post-election years, August’s rankings are little changed, but performance has been negative across the board. August is the worst month in post-election years for DJIA and Russell 1000 and the second worst for S&P 500, NASDAQ and Russell 2000. Average declines in post-election year Augusts range from –0.5% by Russell 2000 to –1.5% by DJIA. Each index has also seen more declining post-election year Augusts than positive.
Guest Post – SpotGamma:
Get instant access to our partners’ real-time market data and insights not available anywhere else. Here is last night’s Founder’s note getting you ready for today’s market and explaining the constraints in yesterday’s market. – MrTopStep

Animal Spirits Roar as Market Catalysts Loom
This week delivered a fascinating mix of meme stock chaos, trade deal optimism, and mega tech earnings keeping traders on their toes despite unusually calm waters for the broader market.
The S&P 500 ultimately gained ground, closing at all-time-highs, just below the pivotal SPX 6,400 gamma strike.
Call option volumes exploded this week alongside broader speculative trading activity, with calls accounting for 61% of total options volume over the past month. This marks the highest reading since December 2024.
The elevated call-to-put ratio reflects the market’s overwhelming bullish positioning and helps explain why volatility has been so persistently suppressed. The VIX collapsed below 15, its lowest level since early February, as trade deal optimism and low-volume summer conditions combined to create an environment of extremely subdued volatility.
The ultimate question remains: Can this low-vol, bullish environment persist through peak earnings season, or are we setting up for the kind of reset that catches everyone leaning the same direction?
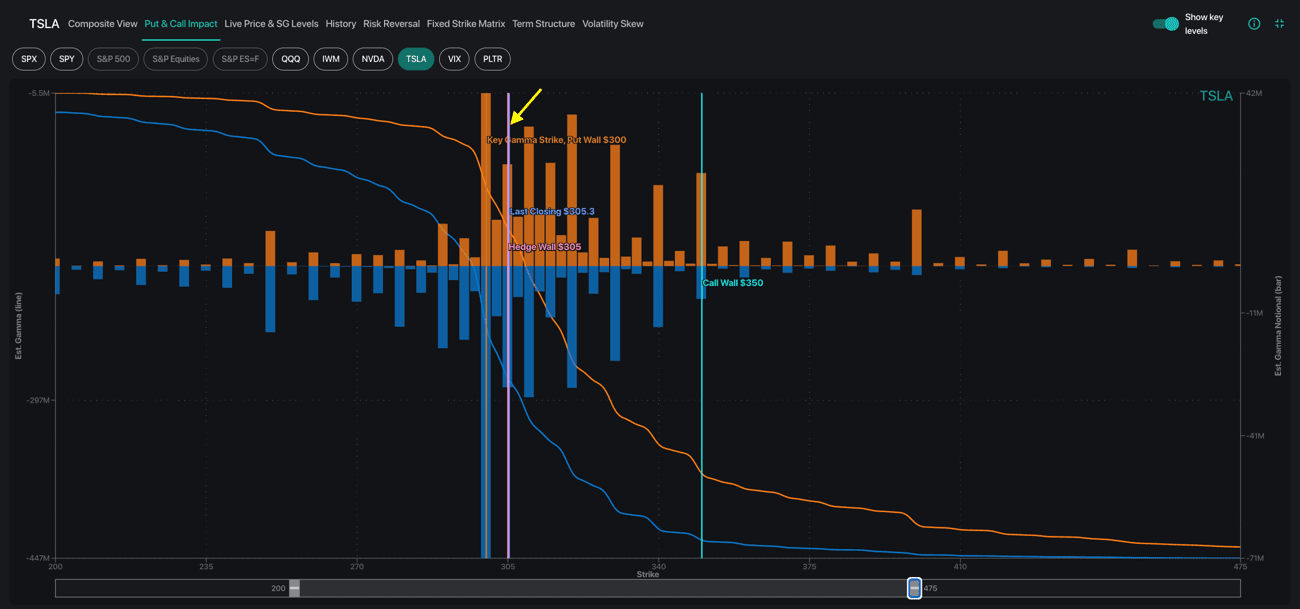
Tesla’s Gamma Fortress: When Earnings Misses Don’t Matter
While Tesla bears scratched their heads wondering why TSLA wouldn’t collapse further on its double earnings miss, the answer lay in the mechanical options-driven forces hidden beneath the surface.
Tesla’s positioning showed $300 as both the Key Gamma Strike and Put Wall where dealers held concentrated long puts, creating automatic buying pressure. When TSLA gapped down 5% the session following earnings, it found immediate support exactly at the $300 level – just as anticipated.
The upside roadmap was equally clear. Above $300, gamma tailwinds supported upside momentum. At $325, diminishing dealer buying pressure provided a natural profit-taking zone. This setup offered both a defined-risk entry and logical exit target, capturing TSLA’s full ~$24 bounce between Thursday and Friday.
MiM and Daily Recap
Intraday Recap: Friday, July 25, 2025
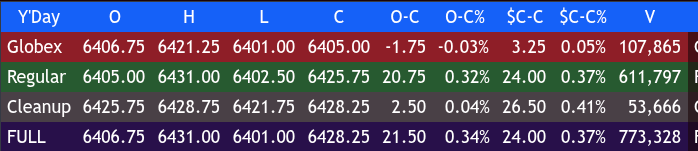
The S&P 500 futures (ESU25) began Friday’s trade with mixed overnight action. The overnight Globex opened at 6406.75 and staged a steady climb, reaching 6421.25 at 23:15. That 22-point rally marked the overnight high before sellers stepped back in. A prolonged decline took hold into the earlyning, dragging ES down to 6401.00 by 04:15, erasing the entire up leg.
A bounce emerged from that pre-market low, lifting ES to 6410.00 at 06:45, but it turned out to be a lower high. Another push lower followed, with a minor rally to 6410.25 at 08:30, but price fell again to 6402.00 at 09:00. The regular session opened shortly after at 6405.00, and the early action held near that area.
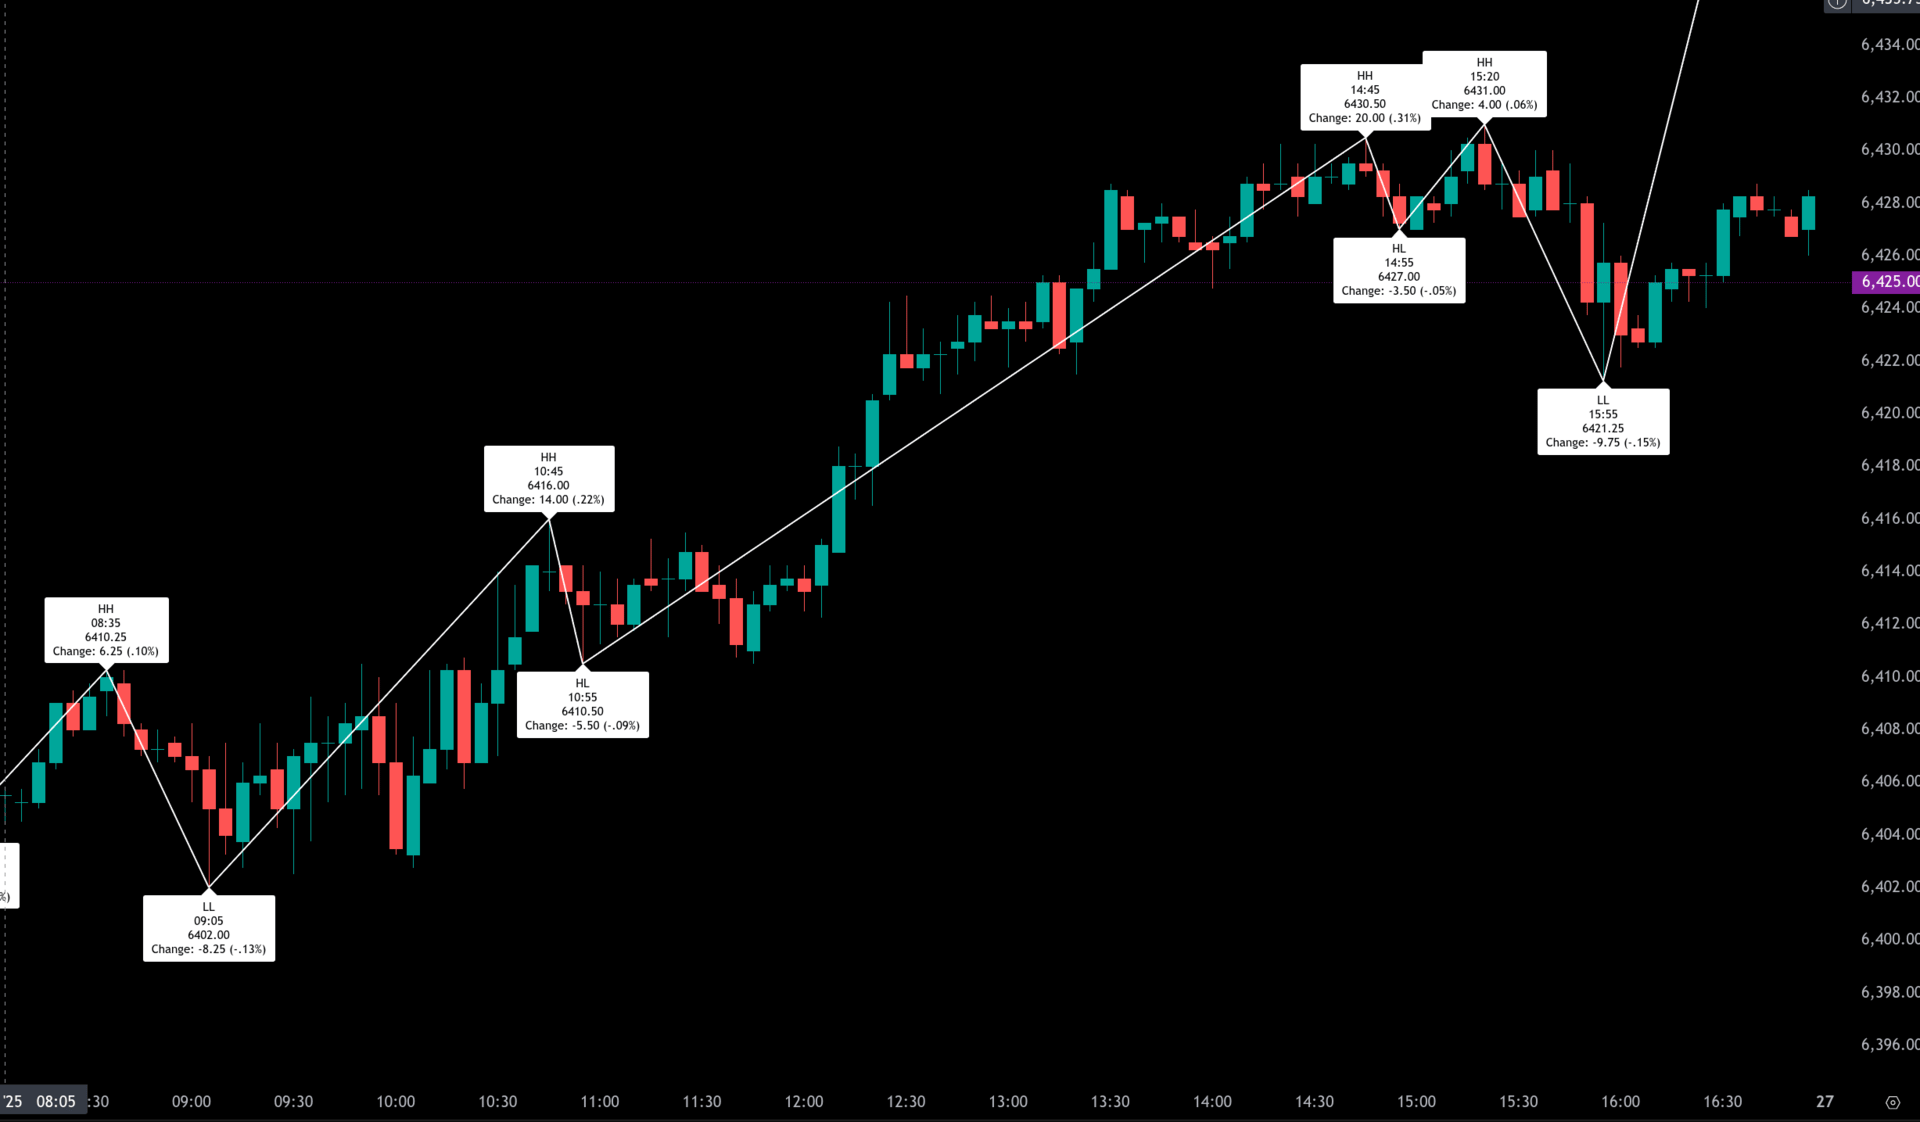
Momentum gradually improved through mid-morning, building from the 09:05 low. A climb to 6410.25 at 08:35 gained traction, extending to 6416.00 by 10:45 before pulling back to 6410.50 at 10:55. That 5.5-point retracement set the stage for a steady trend higher into the afternoon.
By 14:45, ES reached a new high at 6430.50, a 20-point move off the late morning low. A shallow dip to 6427.00 at 14:55 was quickly bought, leading to another push up to 6431.00 at 15:20, the session high. However, a wave of late selling knocked prices down to 6421.25 at 15:55 before the session stabilized.
The cash close at 16:00 came in at 6425.75, up 20.75 points (+0.32%) from the regular session open and up 24.00 points or +0.37% from Thursday’s 6401.75 settlement. The full session volume was light, reaching only 773,328 contracts, with 611,797 traded during regular hours.
Market Tone & Notable Factors
Friday’s tone was moderately bullish, supported by constructive pullbacks and higher lows through the day. Despite the early Globex fade, the regular session established upward momentum after absorbing pre-market weakness. Traders found confidence in the morning stability and sustained upward drive.
Buyers were willing to step in on minor dips, and the afton drift higher suggested steady demand. The late-day high at 15:20 quickly reversed, influenced by imbalances into the close.
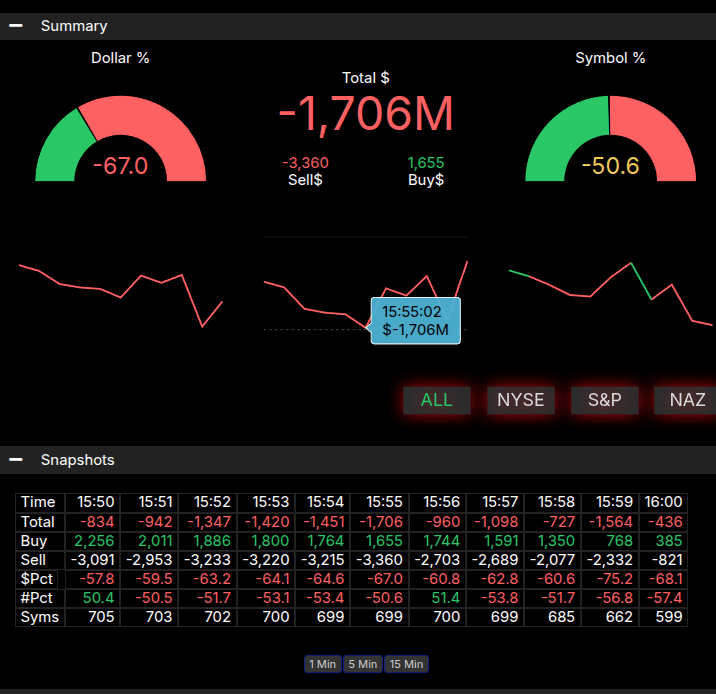
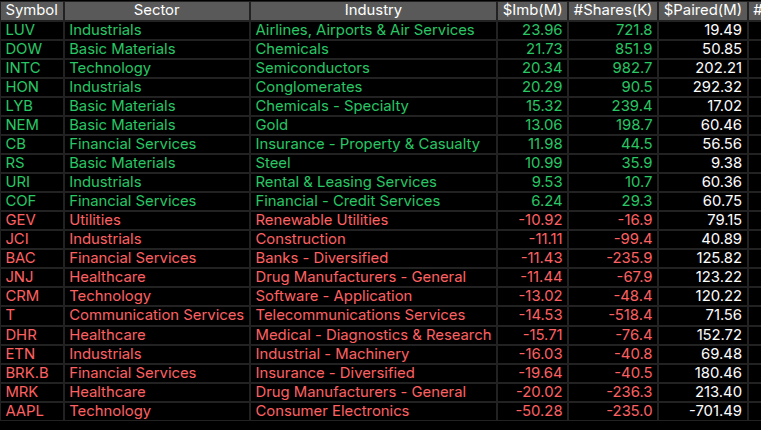
Market-on-Close (MOC) data showed a sharp -$1.706B sell imbalance at 15:55. This was accompanied by a 67% dollar-weighted sell side, meeting the strong sell threshold, though the symbol imbalance at -50.6% did not meet the extreme threshold. The sharp drop from 6431.00 to 6421.25 in the final minutes reflected this MOC pressure.
In summary, the ES held firm ground with a modest gain and closed the week near highs, though the closing imbalance capped the upside. Traders will likely look to Monday for confirmation of strength or signs of exhaustion after this week’s upward bias.
Technical Edge
Fair Values for July 28, 2025:
-
SP: 32.48
-
NQ: 136.68
-
Dow: 168.64
Daily Breadth Data 📊
For Friday, July 25
• NYSE Breadth: 59%ide Volume
• Nasdaq Breadth: 68% Upside Volume
• Total Breadth: 67% Upside Volume
• NYSE Advance/Decline: 61% Advance
• Nasdaq Advance/Decline: 51% Advance
• Total Advance/Decline: 52% Advance
• NYSE New Highs/New Lows: 98 / 15
• Nasdaq New Highs/New Lows: 221 / 73
• NYSE TRIN: 1.03
• Nasdaq TRIN: 0.46
Weekly Breadth Data 📈
For Week Ending July 25
• NYSE Breadth: 58% Upside Volume
• Nasdaq Breadth: 65% Upside Volume
• Total Breadth: 62% Upside Volume
• NYSE Advance/Decline: 66% Advance
• Nasdaq Advance/Decline: 61% Advance
• Total Advance/Decline: 57% Advance
• NYSE New Highs/New Lows: 273 / 62
• Nasdaq New Highs/New Lows: 609 / 157
• NYSE TRIN: 1.40
• Nasdaq TRIN: 0.83
Today’s BTS Levels:
ES
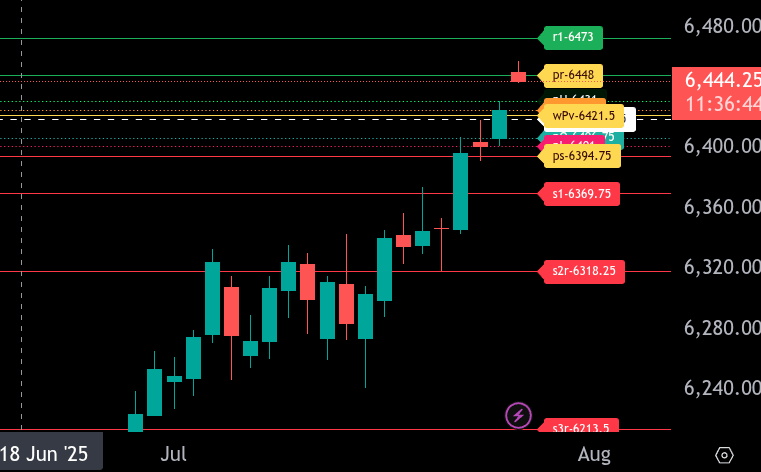
The bull/bear line for the ES is at 6421.50. This level is key to maintaining bullish control in the current uptrend. Price is currently hovering just above this line at 6444.00, suggesting the bulls are still in command. Holding above 6421.50 keeps the door open for continuation toward higher levels.
The immediate upper range target is 6448.00. If buyers can push through that, the next resistance is at 6473.00, followed by the high from Friday’s session at 6484.50. Sustained strength above 6448.00 increases the odds of testing these upper zones.
On the downside, the lower range target is 6394.75. If price falls back below the bull/bear line, we could see a test of 6401.00 and then the key support at 6369.75. A break below this opens the path toward 6348.25.
Overall, as long as ES holds above 6421.50, bulls remain in control. Below that, sellers could regain momentum for a deeper pullback..
NQ
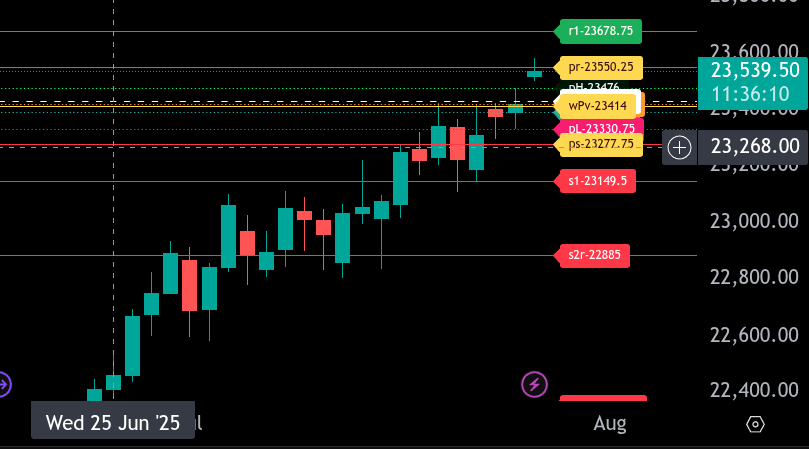
The bull/bear line for the NQ is at 23,414.00. This is the key level for sentiment today. Currently, NQ is trading at 23,539.50, firmly above the bull/bear line, indicating bullish momentum in the pre-market session. If price remains above 23,414.00, we anticipate continued upside pressure.
The upper range target for today is 23,550.25. If this level is broken and held, bulls may extend the move toward the next resistance at 23,678.75. A break and hold above that level would further validate bullish control.
Support on the downside begins at 23,391.50, with additional support levels at 23,330.75 and then the lower range target at 23,277.75. Below that, deeper support rests at 23,149.50. As long as price holds above the bull/bear line, pullbacks to support may offer buying opportunities.
Calendars
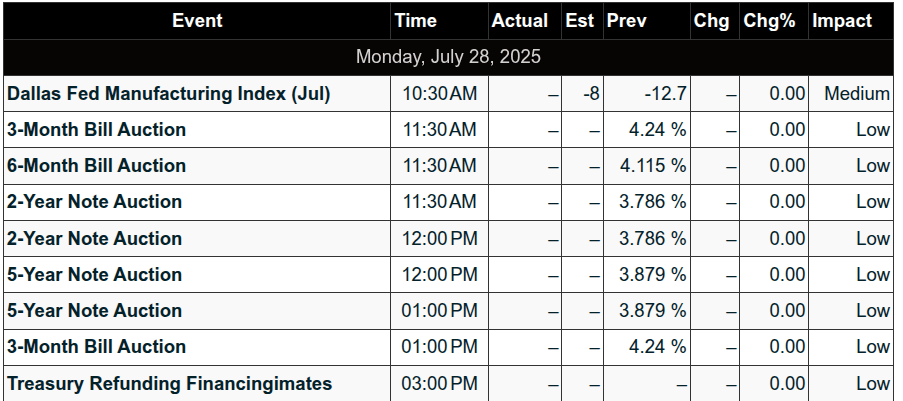
Today’s Economic Calendar
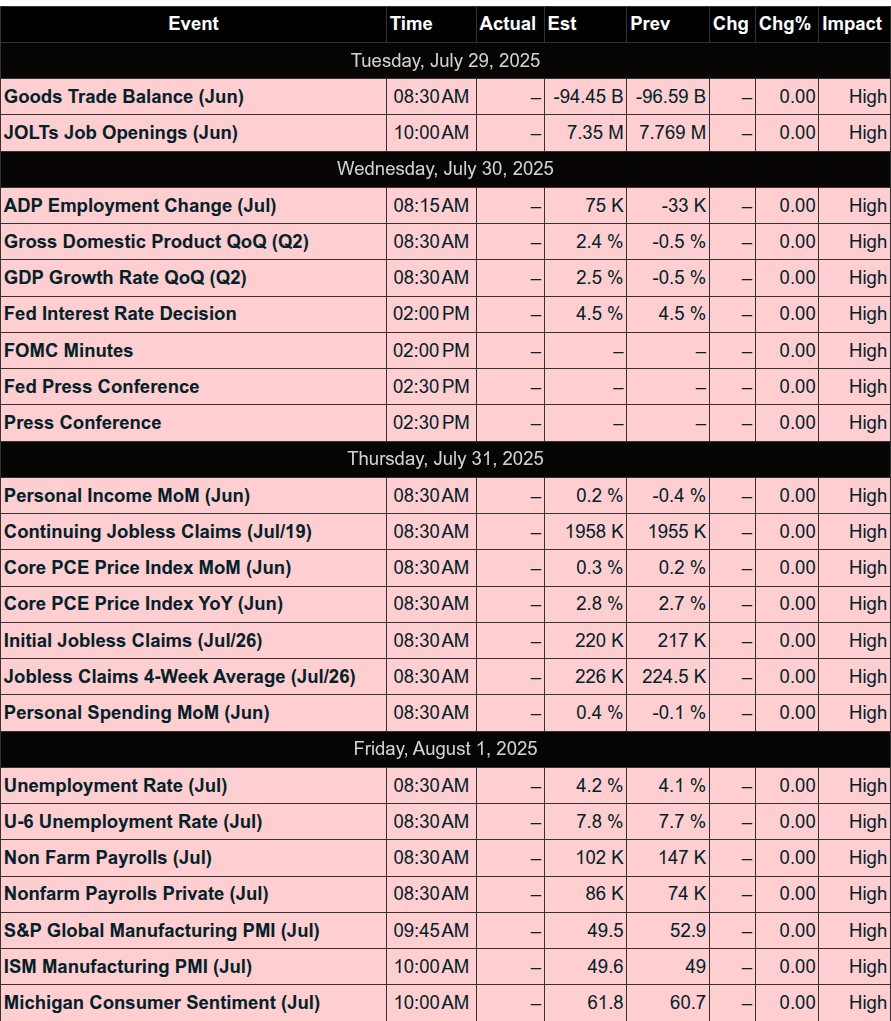
This Week’s Important Economic Events
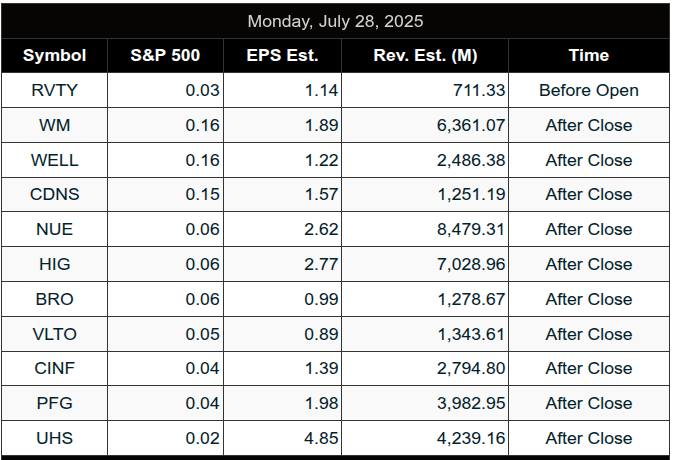
Today’s Earnings
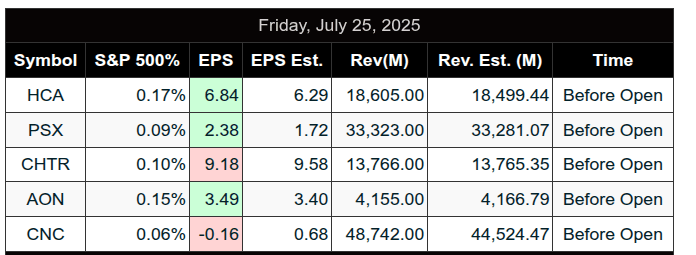
Recent Earnings
Room Summaries:
Polaris Trading Group Summary – Friday, July 25, 2025
Overview:
Friday was marked as Capital Preservation Day, with a strong educational focus and cautious trading in a tight-range environment. Despite low volatility, several valuable setups and lessons emerged.
Key Trades & Market Action
-
Overnight D-level target at 6420 was fulfilled, aligning with the trade plan
-
@CL Open Range Short was the standout:
-
Target 1 hit early in session
-
Target 2 followed with stop moved to breakeven
-
All targets fulfilled by midday
-
-
@NQ Open Range Short was stopped out for -1R
-
@ES Open Range Long was attempted during the tight range but yielded limited action
-
A midday demo long trade reached two scales with stop moved to breakeven
Lessons and Highlights
-
New acronym shared: ITE = If Then Else, guiding structured trade planning
-
Avoid trading in the middle of CCI during ranges – confirmed by David
-
Best range-bound entries discussed:
-
Break and retest of levels
-
Confirmation through stacked MAs, volume ratios, and thrust behavior
-
-
ATR10 and trend filter techniques discussed to refine entry timing
-
Tight ranges often lead to expansion – emphasized need for patience and edge-based setups
Member Contributions and Insights
-
Ram, John B, Roy_, and others actively contributed trade observations and educational prompts
-
John B shared use of the trender filter (13 EMA vs. 34 EMA) to stay out of weak setups
-
Multiple members appreciated the educational depth of the morning session
Market Context and Structure
-
ES was range-bound between 6400–6410 for much of the session
-
Failed to gain traction above 6415
-
Total ES volume was 749,000 contracts, reflecting summer Friday pace
Closing Notes
-
David wrapped the session early afternoon due to storms
-
Members signed off expressing appreciation for the session’s value and clarity
Affiliate Disclosure: This newsletter may contain affiliate links, which means we may earn a commission if you click through and make a purchase. This comes at no additional cost to you and helps us continue providing valuable content. We only recommend products or services we genuinely believe in. Thank you for your support!
Disclaimer: Charts and analysis are for discussion and education purposes only. I am not a financial advisor, do not give financial advice and am not recommending the buying or selling of any security.
Remember: Not all setups will trigger. Not all setups will be profitable. Not all setups should be taken. These are simply the setups that I have put together for years on my own and what I watch as part of my own “game plan” coming into each day. Good luck!
This post goes out as an email to our subscribers every day and is posted for free here around 2 PM ET. To get your real-time copy, sign up for the free or premium version here: Opening Print Subscribe.
Comments are closed