The Band Plays On
S&P 500 up 5 weeks in a row
Every week, MrTopStep invites traders to an “Own the Close’ contest where the closest guesstimate where the SPX will settle on Friday’s 4:00 cash close.
The winners get a free week’s access to the MrTopStep Chat and trading tools. Enter your guess now!
Our View
I remember on the floor — and more specifically, in the S&P 500 futures pit — when the S&P (SPU) broke through a big level, the desk and pit clerks desk would be cheering and throwing trading cards up in the air. 20 feet away, Rick Santelli was on CNBC talking about the milestone.
Sure the markets are roaring higher, but the public doesn’t seem to be cheering. I know sometimes I get overly concerned, but I was there for the crash in 1987, the 2000 tech bubble and every other crash after the markets went too far in one direction.
That said, the band plays on. The S&P has been up 5 weeks in a row and is up 5.4% to start 2024. It not only closed above 5,000 for the first time on Friday, it almost took out 5,050 while it made its 10th record daily high for the year. It’s up 14 of the last 15 weeks and has gained more than 22% in that span. The Nasdaq is trading above 18,000.
I continue to be a bull and look for higher prices, but I also am just amazed at how shallow the pullbacks have been. I think that’s what’s so troubling. The buyers are relentless and even when it does fall it doesn’t go down much and almost always recovers that day or the next.
Thus the question: Is there any real reason to be looking for a high or to be bearish? Simple math says when the markets are rolling like they are, you are supposed to keep rolling with buying the weakness until it doesn’t work.
It’s not just the ES and NQ that are moving…oil was up 3%, Bitcoin traded above $47,000, and Treasuries inched higher.
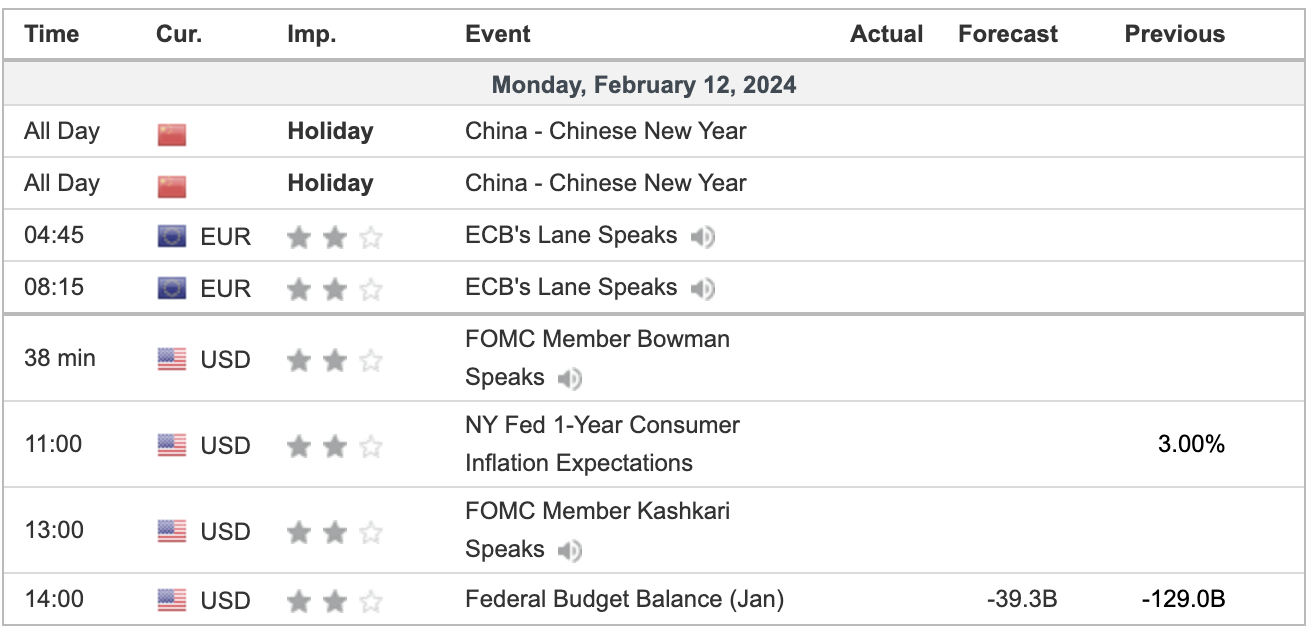
This week we have 13 economic reports and 15% of the S&P reporting earnings. All eyes will be on Tuesday’s CPI report and then the PPI report on Fryday’s monthly options expiration, which has the Nasdaq up 13 out of the last 20 occasions the day before President’s Day weekend, while the S&P is up 10 of the last 13 occasions.
Our Lean
The volume is so low that even when you sell it at a high and the ES drops 20 or 25 points over an hour and a half, 20 to 30 minutes later it rallies right back up to a new high.
Our Lean: I’m fading any 10- to 15-point gaps on the open. If that doesn’t happen then I want to buy the early pullbacks. I think we all agree the markets are well overdue for a pullback, it’s just a question of when.
As for ES levels, HandelStats says:
Upside: trade above 5044 targets 1sd at 5070.10. Trade and hourly close above there targets 5076.21***, hourly close above there targets 2sd at 5097.44. (Daily close above 5076.21 targets much higher.)
Downside: Trade and hourly close below 5041.50 targets 5025.25, hourly close below there targets 5020, then -1sd at 5015.40 and 5014.75. Hourly close below there targets 5006.50, then 4997.85, then 4994.50, then -2sd at 4988.06.
MiM and Daily Recap
ES recap
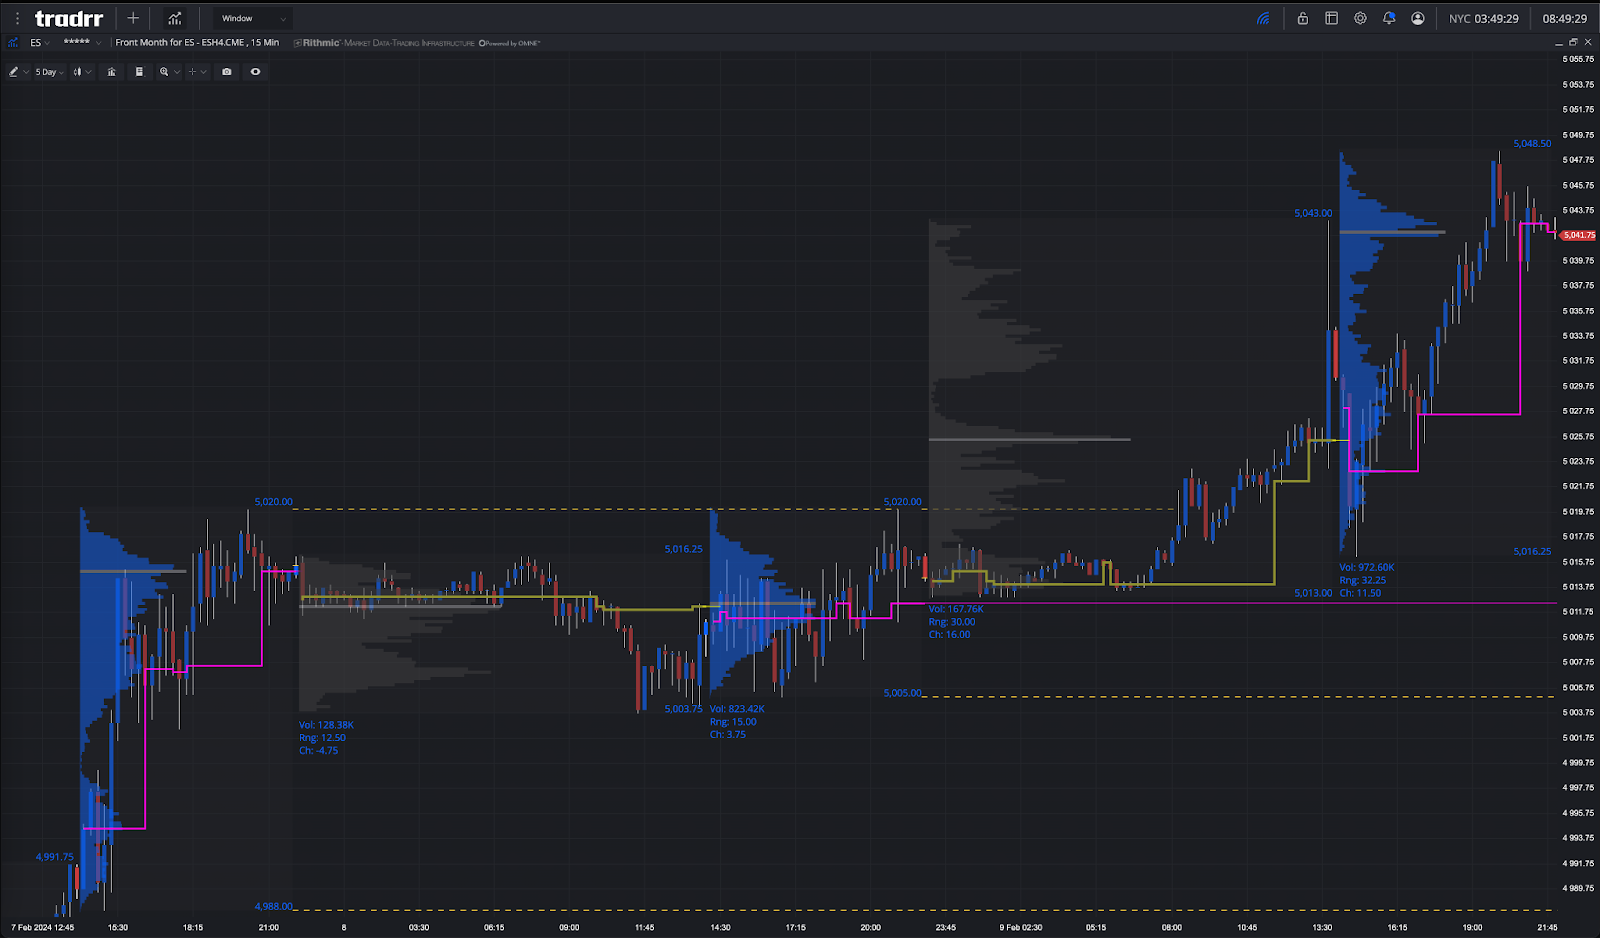
The ES was already moving higher on Globex and then shot up to 5043.00 after the consumer price index showed that the broad basket of goods and services measured increased 0.2% on the month, less than the originally reported 0.3%, and opened Friday’s regular session at 5020.00. After the open, the ES traded up to 5028.25 and sold off down to 5016.25. Again, volumes were lower than the normal FRyday options expiration trade.
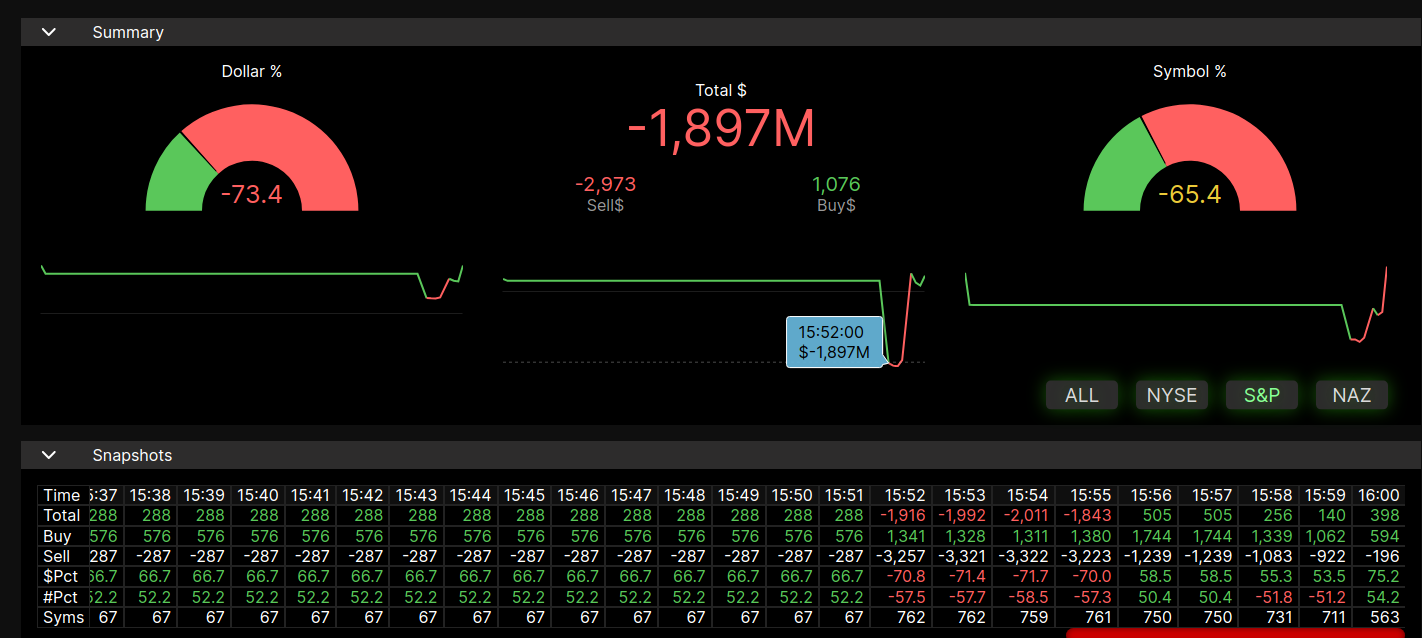
After the low, the ES back-and-filled under the VWAP and then rallied up to 5034.00 at 11:39, sold off down to 5024.75 and then rallied back up to a new daily high at 5048.50 at 1:09, 21 points off the low, and then traded down to 5039.25 at 3:45 as the early imbalance showed $288 million to buy. As the 3:50 cash imbalance showed almost $2 billion to sell, the ES traded up to 5045.75 at 3:52 and traded 5043.00 on the 4:00 cash close. After 4:00, the ES inched lower, trading 5042 at the 5:00 futures close, up 26.25 points or 0.52% on the day.
In the end, the ES was off to the races on Globex and then it ripped once the revised inflation numbers hit the tape. In terms of the ES’s overall tone, the NQ helped push the ES higher. In terms of the ES’s overall volume, I have to say that something is missing. I get that the higher the markets go the lower the volume is, but not like this — less than 1 million traded Thursday and Friday Globex volume. Despite the big move up and down and back up again, only 228k traded on Globex and 887k traded on the day session for a total of 1.115 million contracts traded.
For a day that was all over the place before and after the open and it being a Friday options expiration, it’s hard to believe how low the volume was. Over the last few weeks as the ES and NQ continued to make new highs after new highs, volumes have dropped. Last Thursday was only 980k contracts. Of course, low volume — ie thin markets — ‘tend to drift higher’, also known as MrTopStep’s ‘Thin to Win’ rule.
For more info on accessing the MIM, please visit here.
Technical Edge
-
NYSE Breadth: 52% Upside Volume
-
Nasdaq Breadth: 76% Upside Volume
-
Advance/Decline: 66% Advance
-
VIX: ~13.50
ES
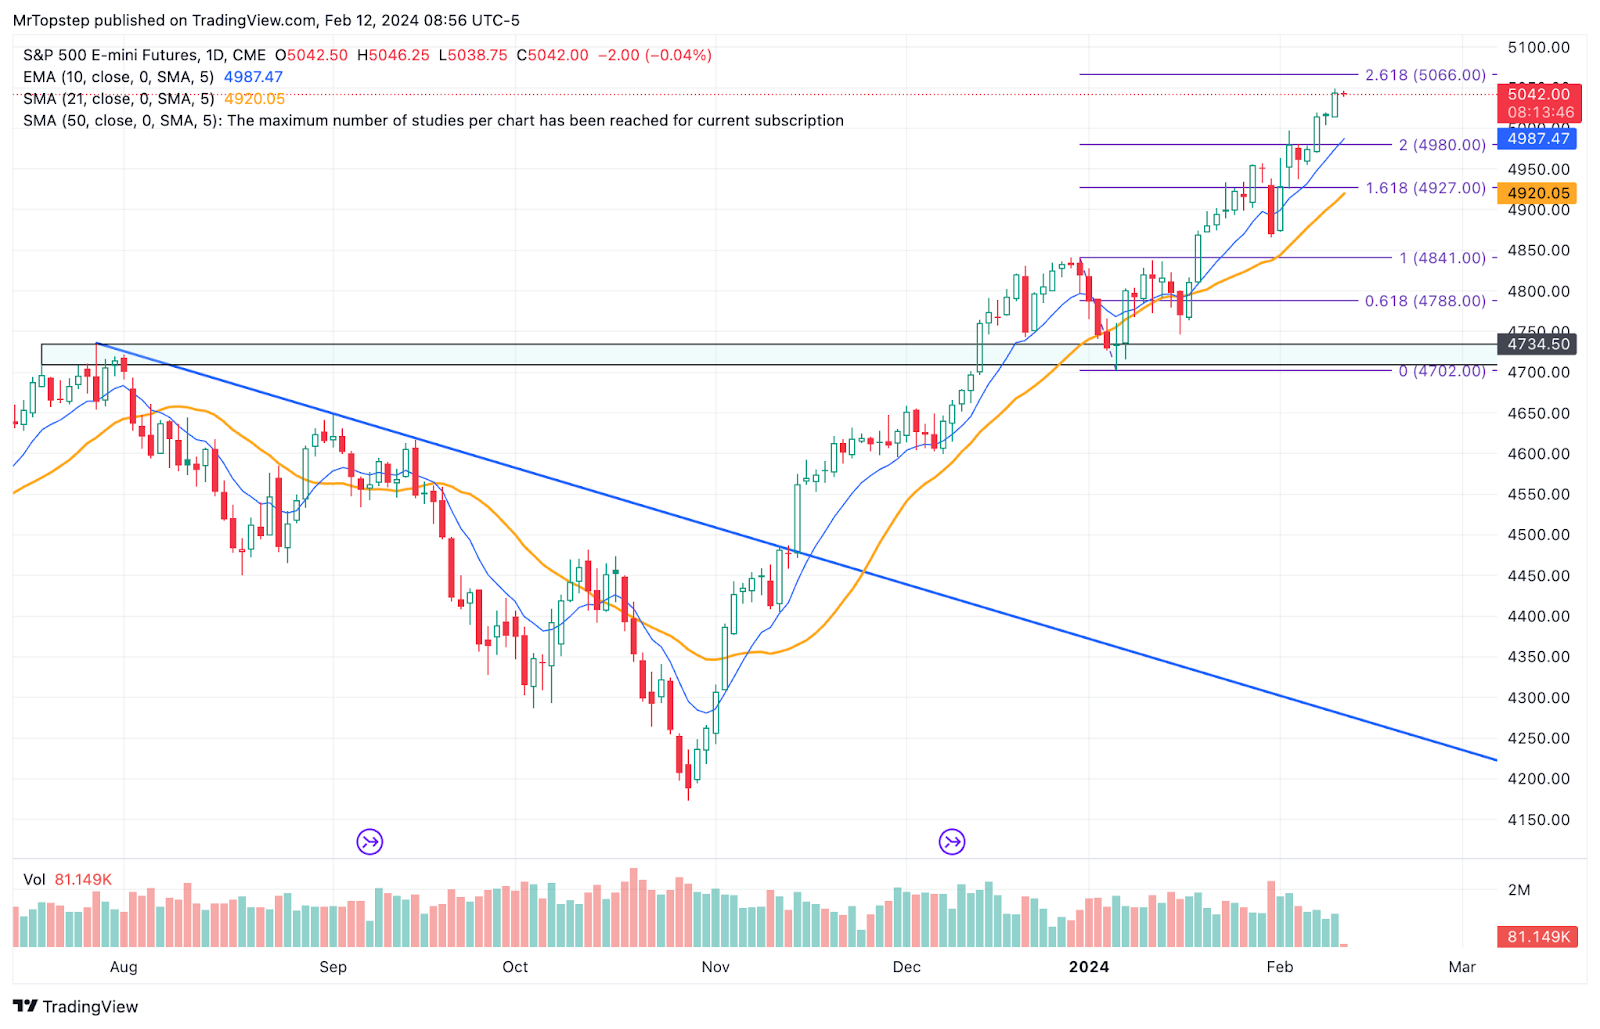
ES daily
(Levels above, in Lean)
Guest Post
From HandelStats.com
On March 24, 2000, the S&P 500 Index achieved a new all-time high close (ATH) of 1527.46, marking the culmination of a four-day streak of record-setting closes. This peak remained unsurpassed until May 30, 2007, when the index closed at a new ATH of 1530.23, again following a four-day streak of new ATHs. Throughout 2007, the S&P 500 set a total of nine new ATHs, with the highest close of the year reaching 1565.15 on October 9, 2007. This record stood until March 28, 2013, when the index closed at 1569.19, setting a new ATH. The year 2013 saw a significant number of record highs, with a total of 45 new ATHs recorded, the last of which occurred on December 31, 2013, with the index closing at 1848.36.
The momentum continued into 2014, with the S&P 500 setting 52 new ATHs, culminating in a year-end close of 2090.57 on December 29, 2014. In 2015, the market witnessed 11 new ATHs, with the last one occurring on May 21, 2015, when the index closed at 2130.82. After more than a year, the next ATH was reached on July 11, 2016, with a close of 2137.16, and a total of 18 ATHs were recorded that year, the last of which was on December 13, 2016, with the index closing at 2271.72.
Economic Calendar
Comments are closed