The ES Continues to Hang In There
When will we get a stop run?
Follow @MrTopStep on Twitter and please share if you find our work valuable!
Every week, MrTopStep invites traders to an “Own the Close” contest where the closest guesstimate where the SPX will settle on Friday’s 4:00 cash close.
The winners get a free week’s access to the MrTopStep Chat and trading tools. Enter your guess now!
Our View
The ES sells off and then the ES rallies, but most points are all in the back-and-fill that’s been going on for the last three weeks.
Yes we had a drop down to 5205, but since then it’s been all about the intraday drops and pops. Coming into yesterday’s session, I was long 2 ES and 1 NQ and when the markets dropped on Globex, I changed the “Our Lean” section. I know that when I do this it’s generally a mistake and yesterday’s clearly was:
Our Lean for 6/4/24 before I changed it…
I can’t rule out another pull back, but I think we will see higher prices today. Our lean is to buy the pull backs with resistance at 5320 and if the ES can get above there, then look for 5335. On the downside, we would look to buy any 25 to 35 point pullbacks or the 5265-70 area.
Down 25 points was the 5275 area and down 30 was basically the low of the day. I had a big profit on both positions and instead of following what I wrote, I got concerned about getting out if they kept going down and it threw me off. I did keep the ES position though.
Our Lean
I always want to do my best when I write the OP and over the last 3 or 4 days, I am not taking any input from anyone. It’s all back to my own opinion with no outside interference. I was already having a hard time and then I switched to new charts at the beginning of last week and that only made it harder.
All I can say is, I really stopped listening to the noise. Like trading…if I am going to do the trading I have to own it — just like my calls. There is a very well known ES trading newsletter that everyone in my room looks at. I have to admit the levels are great, but he never has a losing day and to me that’s impossible.
Today we have several economic reports: initial jobless claims, PMI data and ISM data.
While they did run the ES buy stops above 5306, we have yet to see a good stop run — which I think will happen. Everything hinges on Friday with the jobs report and as Nvidia’s stock split will go into effect on Monday. Friday also marks the week one FRYday options expiration.
I suspect that it’s business as usual — pullback (either after the open or sometime early morning) and then rally back up. My lean is to buy the 25 to 30 point pullbacks and look for 5220 and then 5340.
Lastly, with all the talk about the dollar, I thought this WSJ story was a good read.
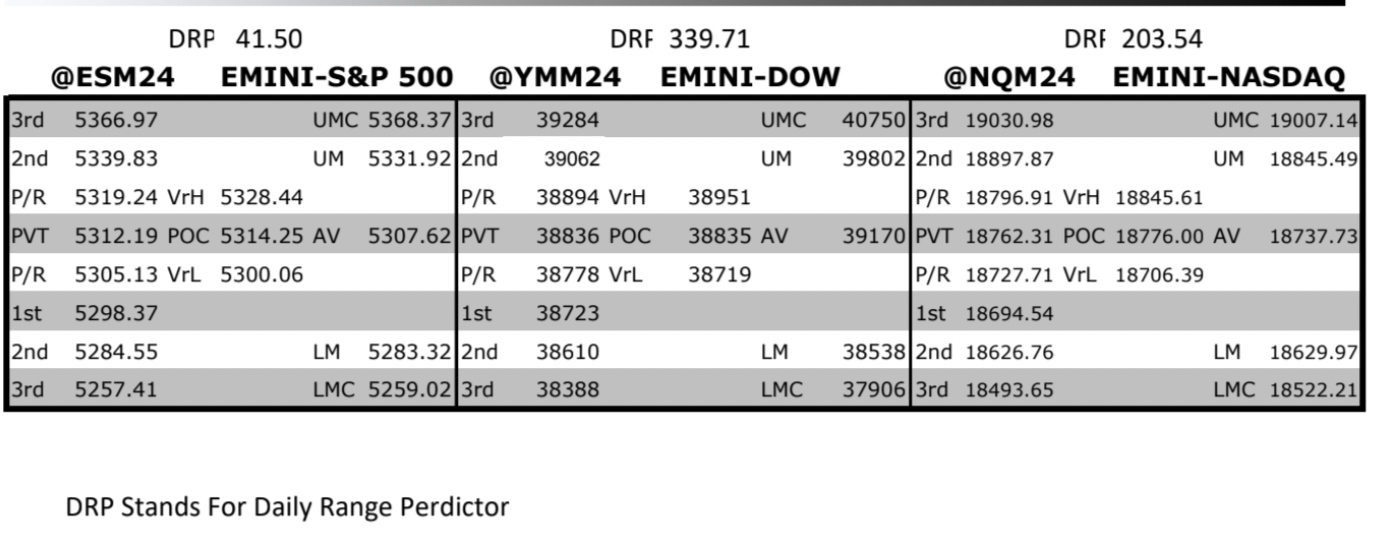
MrTopStep Levels:
MiM and Daily Recap
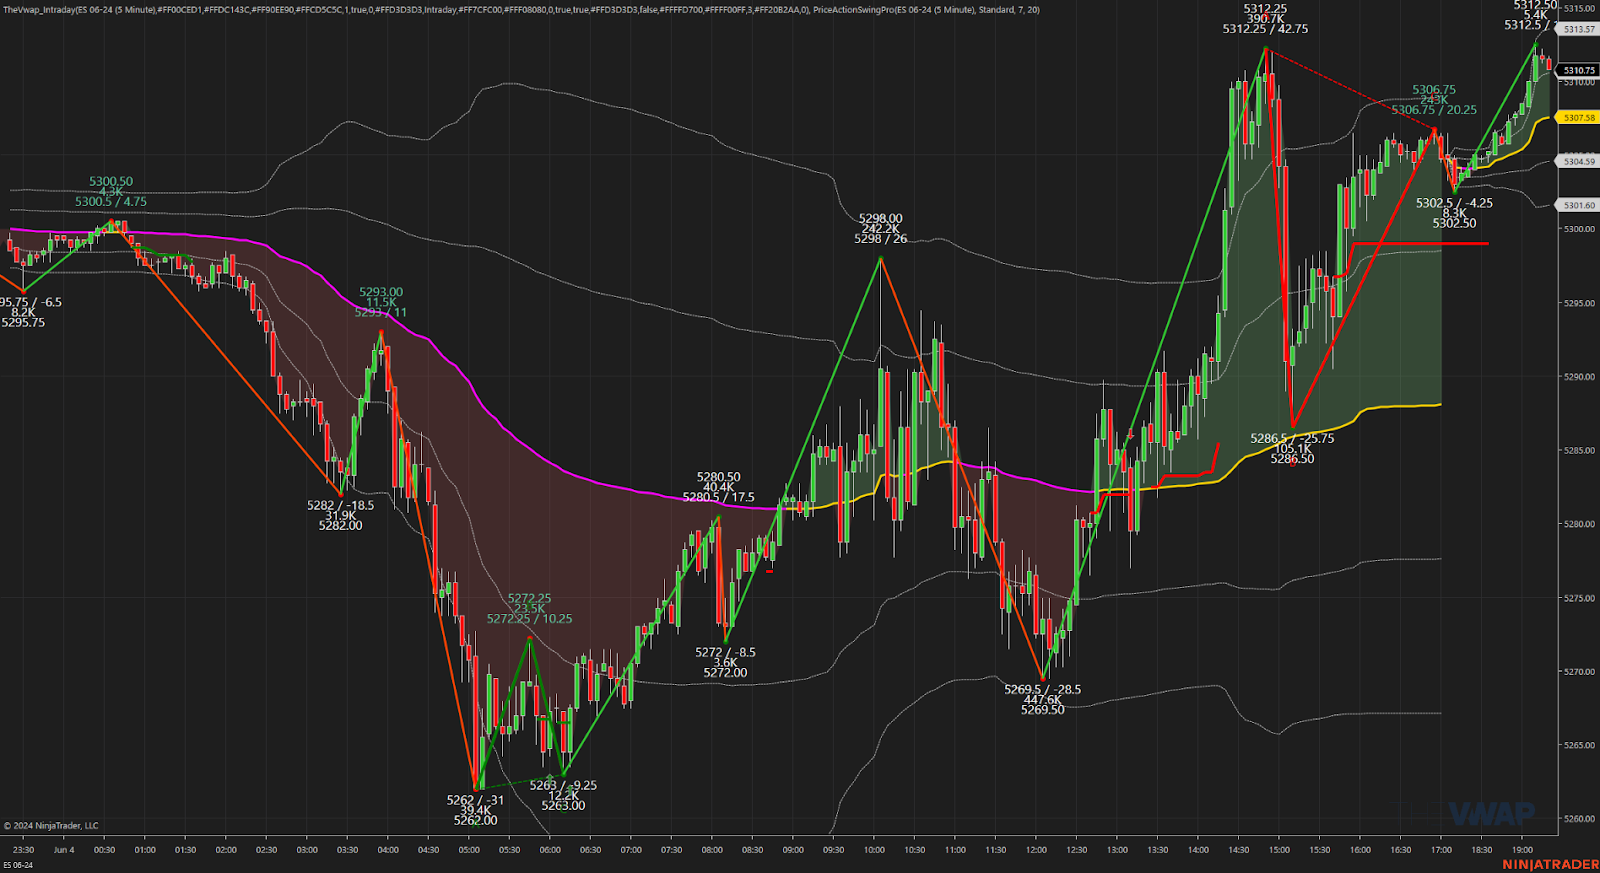
ES recap
After a big bump up on Monday’s close, the ES sold off down to 5262.00 and opened Tuesday’s regular session at 5285.25. After the open, the ES traded up to 5288.00, sold off down to 5277.75 and then rallied up to a new high at 5288.50. From there, it pulled back to 5280.25, shot up to 5298.25 after the JOLTs data for April came in at 8.059M vs estimates of 8.370M, and then sold back down to 5277.75 at 10:15.
From there, the ES rallied back up to to 5290.25, traded 5288.50, rallied back up to 5292.50, sold back down to 5279.75 at 11:00, traded up to 5283.50 and then sold off down to the low of the day at 5269.50 at 12:05. After the low, the ES did a sideways-to-up back-and-fill and then rallied up to 5289.75 at 12:49 and then dropped down to 5277.00 at 1:11 before popping back up to 5310.25 at 2:26. Then it pulled back to the 5504.50 level and rallied up to another new high at 5312.25 and then sold off down to 5286.50 going into 3:06. From there, the ES traded back up to 5303.50 and traded 5300.75 as the 3:50 cash imbalance showed $282 million to buy and then traded up to to 5306.50 at 3:55 and traded 5303.50 on the 4:00 cash close.
After 4:00 the ES traded in a narrow range and settled at 5304.75, up 7.5 points or +0.14%, the NQ setted at 18.706.50, up 60.25 points or +0.32%, Treasury yields fell for a fourth straight day, with the yield on the 10-year note slipping to 4.335%, and crude oil extended its losing streak to its fifth lower close and Bitcoin hit $71,000.
In the end it’s been a rough trade that seems to be improving. In terms of the ES’s overall tone, I think the best thing I can say is it’s holding in there — it was another day of buying the early weakness. In terms of the ES’s overall trade, volume is still on the higher end of the range with a total of 1.641 million contracts traded.
Technical Edge
-
NYSE Breadth: 30% Upside Volume
-
Nasdaq Breadth: 48% Upside Volume
-
Advance/Decline: 38% Advance
-
VIX: ~13
Guest Post — Polaris Trading Group
S&P 500 (ES)
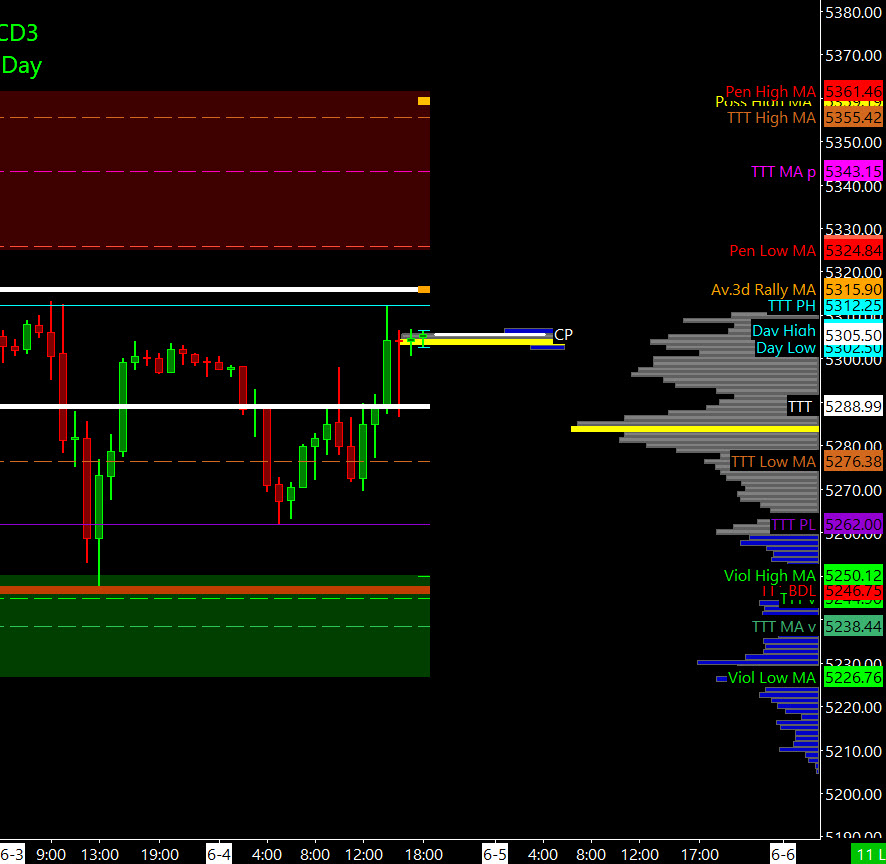
Prior Session was Cycle Day 2: Normal CD2 as price retreated, finding renewed buy response from within 5265 – 6270 zone outlined in prior DTS Briefing 6.4.24. MATD Rhythms were the dominant feature, as /balancing/consolidation kept prices in check. Range was 50 handles on 1.631M contracts exchanged.
…Transition from Cycle Day 2 to Cycle Day 3
This leads us into Cycle Day 3: Price closed in the upper quartile of the range with a firm bid. Three-Day Cycle Target (5315) is within the potential of being fulfilled for today’s session, as bulls remain dominant. We’ll mark today as a “wild-card” given the consolidation theme with price above Cycle Day 1 Low (5246.75) which satisfies Positive 3 Day Cycle Statistic (91.67%).
As such, scenarios to consider for today’s trading.
Bull Scenario: Price sustains a bid above 5290, initially targets 5315 – 5320 zone.
Bear Scenario: Price sustains an offer below 5290, initially targets 5275 – 5270 zone.
PVA High Edge = 5297 PVA Low Edge = 5275 Prior POC = 5285
Thanks for Reading,
PTGDavid
Economic Calendar
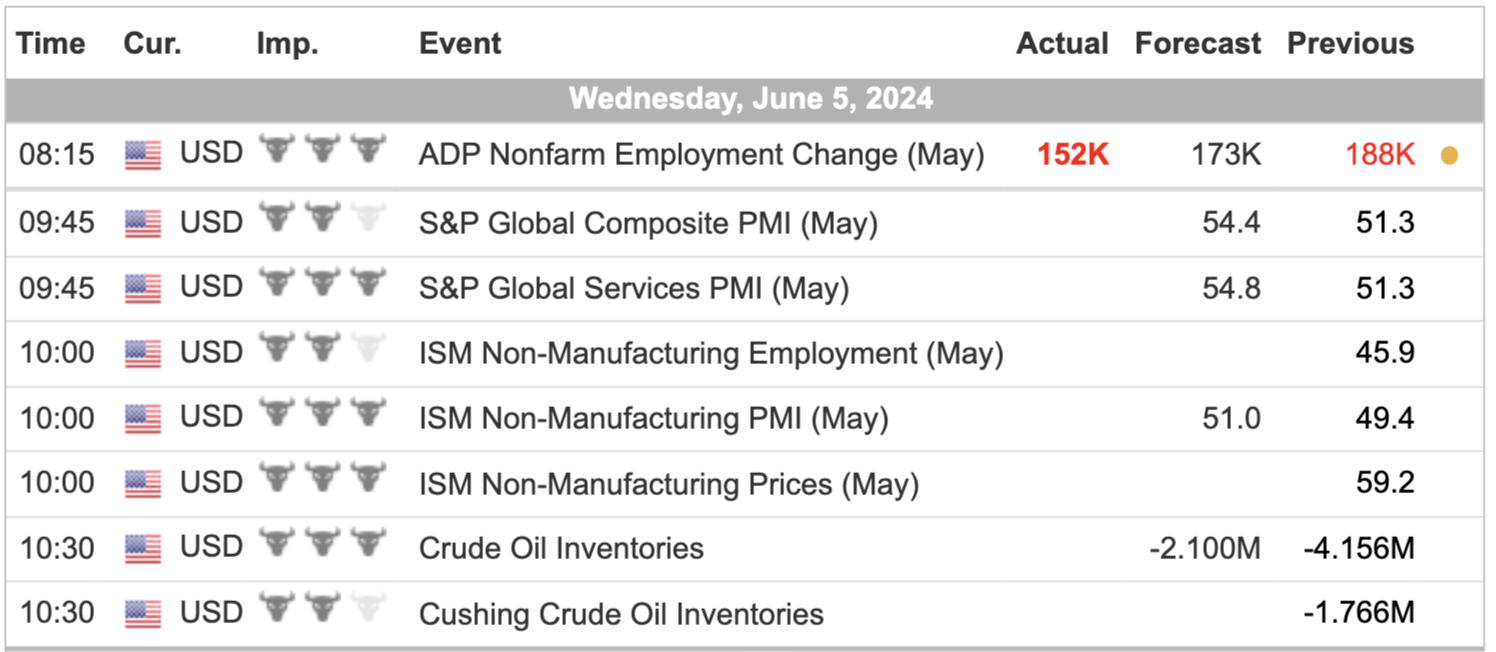
For a more complete Economic Calendar see: https://mrtopstep.com/economic-calendar/
Comments are closed