Our View
The banks have not painted a pretty picture for earnings. Many of them missed on earnings and revenue estimates — JPM, MS, WFC, BAC — while others, like GS beat but reported big slowdowns in revenue (down 22% YoY). Citigroup is about the only bank with a decent report this quarter.
The banks may be the beginning of lower expectations and earnings.
Some people may think I always talk negatively, but in reality that’s not true. I am now and always have been a bull market guy and I get up every day saying it’s a new day and look for the positives. Trust me, I’d sure as hell rather buy the dip and watch all of our 401Ks creep higher than watch today’s current events play out.
But let’s face it folks. There is a tidal wave of bad news and shitty stuff going on. Yesterday, the ES gapped higher by 32.50 points, rallied 40 points to its early high, then reversed 85 points off the high.
Our Lean was to sell the early rallies and if you did, you sold the highs, which came in the first 15 to 30 minutes of the day. The selling came after the headlines hit that Apple is looking to slow its hiring. That’s alongside previous reports that Meta and Alphabet are tightening up too.
That immediately triggered the sell programs and you could see the “change in tune” in the S&P’s intraday action yesterday.
No one knows for sure when the S&P is going to make a bottom. Some very smart people think we are just at the beginning of what could be a very long drawn-out period of high interest rates, lower growth, high inflation and low stock market returns. It would be hard for even the smartest people to connect all the dots and say specifically when the S&P is going to bottom.
I just don’t think that’s possible, but I do still favor a fourth-quarter rally. I know that’s not what people want to hear, but the odds favor a year-end rip.
Our Lean
I think the ES will bounce, but I think the rally will fail. We can’t rule out buying a drop or two, but as things are shaping up over Globex, our “oversold” bounce may be playing out in the overnight and pre-market sessions.
Our lean is for lower prices and to watch the 3865 to 3875 area on the ES (see the technicals below for the “why”).
Daily Recap
The ES traded up to 3909.50 on Globex and opened Tuesday’s regular session at 3897. After the open, the ES traded up to 3905.25 at 9:55 then sold off down to 3886.50 at 10:13. The ES fell into another round of chop, trading in an 8 to 10 point range for the next 2 hours and 30 minutes before the Apple headlines hit the tape.
13:31 [AAPL] Reportedly plans to decelerate hiring and spending for certain teams in 2023; Will not backfill positions or add new staff in some divisions.
The ES then traded down to 3853.25 at 2:31, 52 points off the high of the day. There were a few small bounces along the way, but it was one new low after another. After a bounce up to the 3865 level, the ES sold off down to another new low at 3843.75 at 2:57.
A big sell program hit at 3:00, pushing the ES all the way down to 3832 at 3:36 and then down to 3821.50 at 3:49. The ES traded 3824 as the 3:50 cash imbalance showed $1.15 billion to sell. The ES traded 3838.75 on the 4:00 cash close, and settled at 3838.25 on the 5:00 futures close, down ~31 points or 0.81% on the day.
In the end, all the buying power was used up on Globex and in the first hour of the day session. It was lights out for the S&P after the knockout hit from the Apple headlines. In terms of the ES’s overall tone, the jury is not out but it looks like another dead-cat bounce. In terms of the ES’s overall trade, volume came in at just 1.44 million contracts.
- Daily Range: 89.25 points
- H: 3909.50
- L: 3820.25
Technical Edge
- NYSE Breadth: 68% Upside Volume
- NASDAQ Breadth: 64% Upside Volume
- VIX: ~$24.75
Game Plan: S&P 500, Nasdaq, Semis, AAPL
We had decent upside breadth by the end of the day (68%), but considering we were clocking in at 90% upside volume into the early afternoon, yesterday’s action was discouraging.
It’s clear they switched from buy programs to sell programs after the Apple headline regarding its slowed hiring.
Regarding Apple specifically, shares reversed sharply on the day as a result of the headline. We were fortunate to come into the session cautious across the board on tech (QQQ), Semis (SMH) and ironically, AAPL!
*Anyone who took short setups in these names, it’s now imperative that you do not let these positions go green to red (from profitable to a loss!)*
S&P 500 — ES

The ES held the 10/21-day combo on Monday’s reversal, with a decent 25 handle bounce this morning.
Short-term traders → For the bounce to have any meaning, the ES has to clear the 3865 to 3875 zone (the 50% to 61.8% retracements).
If it does, we could make a push higher into the 3900 to 3910 zone. Above that puts 3920 to 3925 in play (last week’s high and the 50-day moving average).
On the downside, yesterday’s low at 3821 is key. Losing that and failing to reclaim it opens the door back up to the 3700s.
S&P 500 — SPY
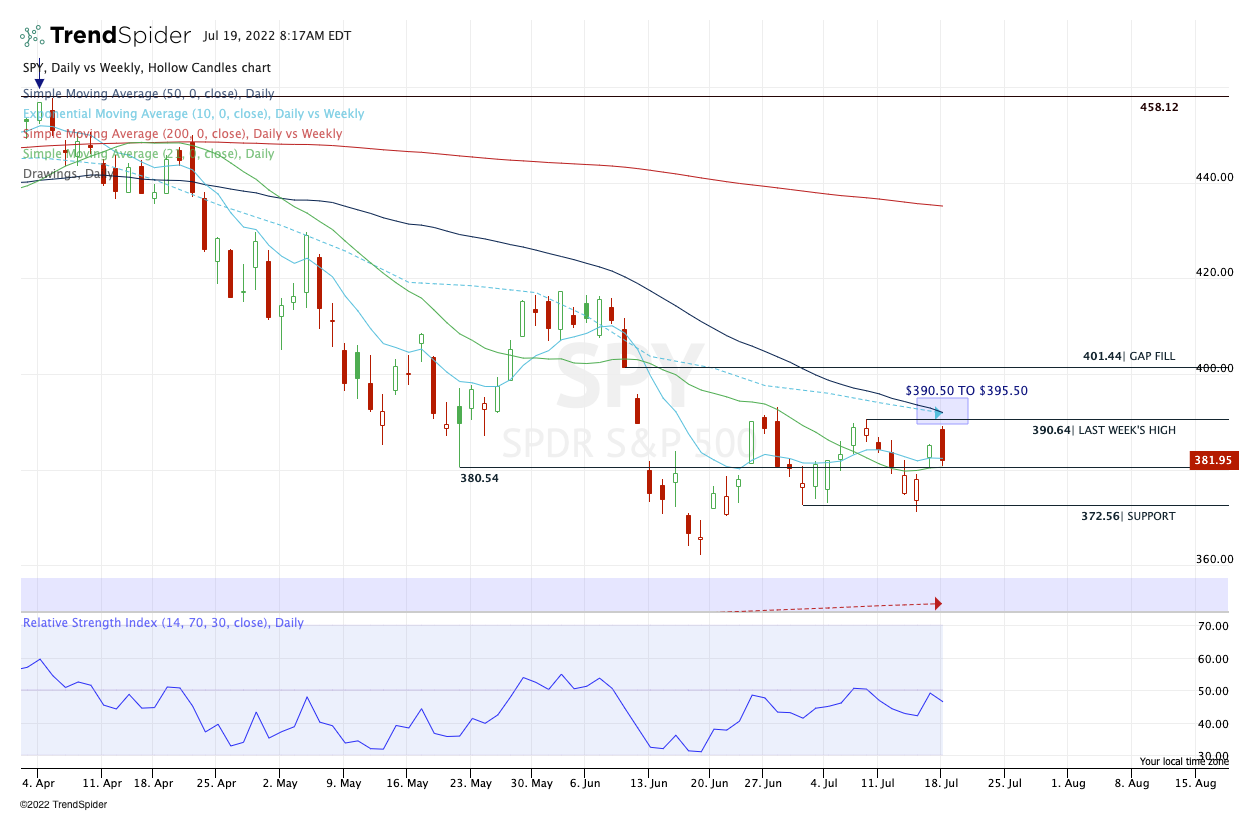
The SPY was rejected by the recent supply zone over the recent weeks near $390. Now $380.50 is again being called back into action, as it roughly marks Friday’s low and Monday’s low.
Keep it simple: Does the SPY reject a breakdown below $380.50 and stay above it? Or does it break this level and start to accept below it, putting $372 to $374 back in play? That’s all we really want to know.
Above $380.50 keeps $390 on the table. Below $380 puts more downside in play.
Nasdaq — QQQ

Beautiful sale off the resistance zone in the QQQ, as the 10-week and 50-day moving averages combined with the multi-week high near $296.50 to reject it.
Now $288 is key. Breaking that level and failure to reclaim puts uptrend support in play and could open the door to last week’s low near $280.
On the upside, I want to see if the QQQ can clear $293. That’s the 61.8% retrace of yesterday’s range and the 50-day moving average. Above it could put $296.50 back in play.
AAPL

We knew why Apple was in a precarious position yesterday, but it ended up being the market leader on Monday. That makes it a key one to watch today.
Shares are trading down into the 10-week and 10-day moving averages. This would be a keen area to hold as support. If it fails, the $143 to $143.50 area could be on the table but more importantly, it will likely weigh on the market as a whole.
On the upside, watch $148.50, then $150 to $152.
SMH

I keep the semi stocks on close watch, because I believe they are a good economic barometer.
In any case, yesterday was a high risk/reward short with the SMH trading up into prior support near $219 and the declining 10-week moving average. The initial reaction was a “sale” but will there be follow-through?
The level to watch is last week’s high at $214.86 — let’s call it $215.
Above that keeps this week’s high and the $219 area in play. Below it suggests a little more caution. A break of yesterday’s low at $212 could put $200 in play.
Go-To Watchlist — Individual Stocks
*Feel free to build your own trades off these relative strength leaders*
- Numbered are the ones I’m watching most closely.
- Bold are the trades with recent updates.
- Italics show means the trade is closed.
Trade Sheets: Down to 2 individual holdings against B/E or profitable stops. Good position to be in.
- MCK — We have hit two trim zones so far on MCK. Feel free to cash the last ⅓ of the position as you see fit. $335 to $340 is a potential upside target if it continues higher. Moving stop-loss up to $315
- $335 hit on Monday, up to you on how to manage from here. I’m holding the last ⅓ against a profitable stop-loss.
- MRK — Target No. 3 Hit on Friday’s push, now down to ¼ of a position and looking for $100 and riding against a $92 stop (profitable vs. our basis).
- Last ¼ stopped at $92 yesterday.
- DLTR — Hit our second target of “$169.50 to $170+”
- Down to ⅓ position and looking for $175 to $177 as our final target. Riding against a stop-loss at $162.50. More conservative traders who want to guarantee a profit can ride against a $165 stop.
Relative strength leaders (List is cleaned up and shorter!) →
- DLTR
- MRK
- COST
- PEP
- ABBV
- UNH
- JNJ
- XLE
- VRTX
- DG
- IBM — Gapping down to the 200-day on earnings this a.m.
- MCK
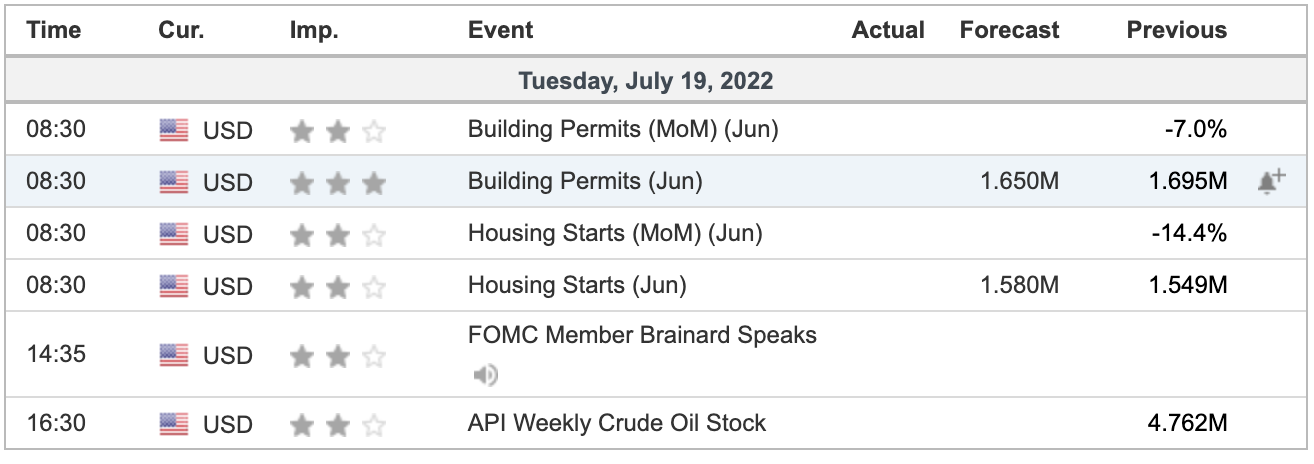
Economic Calendar
As we all know, there’s no crystal ball when it comes to trading stocks, options, or futures. But the Market Imbalance Meter may be as close as it comes. Knowing how the “Big Money” is placing its bets can give our trading room a big wave to ride — or a warning sign to stay out of the water. Come check it out now, risk-free for 30 days.
Disclaimer: Charts and analysis are for discussion and education purposes only. I am not a financial advisor, do not give financial advice and am not recommending the buying or selling of any security.
Remember: Not all setups will trigger. Not all setups will be profitable. Not all setups should be taken. These are simply the setups that I have put together for years on my own and what I watch as part of my own “game plan” coming into each day. Good luck!
- NYSE Breadth: 88% Upside Volume (!)
- NASDAQ Breadth: 75% Upside Volume
- VIX: ~$24.50
Game Plan: S&P 500, Nasdaq, Semis, ARKK, AAPL
I was talking with a trading friend recently and he was asking questions about the market; Supply zones, trends, etc.
I told him that it boiled down to a really simple concept: Acceptance or rejection. I tweeted about it the day after we spoke:
That’s really what it comes down to… is price being accepted at a new level or is it being rejected?
We can see it unfolding in the S&P.
Notice how price was rejected (on the downside) at 3740 as bulls continued to defend that level. No amount of complicated technical analysis is needed to make that observation.
After struggling with 3800 to 3810 in the prior two sessions, there was price acceptance above this level on Friday.
S&P 500 — ES

Now we come into a very key area: 3900 to 3950 — will it accept or reject the ES?
The last three weeks’ worth of highs are as follows: 3900.75, 3922 and 3950. The 50-day moving average — which hasn’t been touched since April — is at 3928, while the 10-week moving average is 3942 and most recently acted as stout resistance in early June.
If the ES can clear 3950 and stay above it, it could open the door to the 3985 to 4000 area.
On the downside, keep an eye on 3865 to 3870. That encompasses Friday’s high and the Globex low. If we lose these levels, the 10-day is in play near 3850.
S&P 500 — SPY
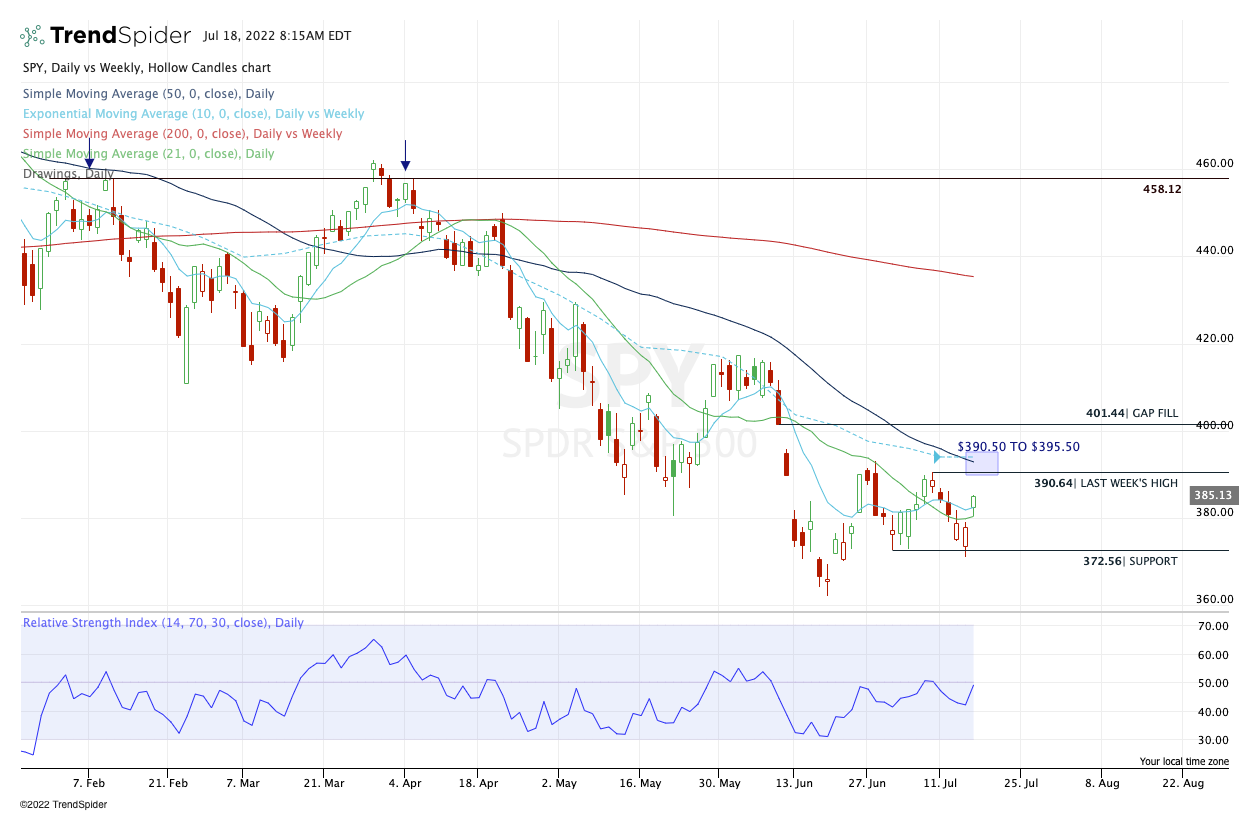
On Friday, we outlined the “simple” course for the SPY: “$380.50 to $382 is the area to clear on the upside…Above that zone and $390 to $393 is in play.”
Set to gap into the $389-ish area this morning, I am curious to see if we get price acceptance or rejection in the $390.50 to $395.50 zone.
On the downsie, I want to see the SPY stay above $380. Below puts $372 to $374 back in play.
Nasdaq — NQ

I know we’re coming into Monday hot and bulls are feeling good, but this 12,150 to 12,250 zone has been a cement wall for a month now. If it breaks it, 12,500 to 12,550 is in play.
If it’s resistance though, bulls need to see support at 12K. Back below 12K and the 11,750 to 11,825 zone is key.
Nasdaq — QQQ

$296.50 is now the 3x weekly-up level to watch. Also near that zone is the 50-day and 10-week moving averages, with the latter serving as active resistance.
Above this zone puts $303 in play, then $310+
$296.50 could be a tough area. It is reasonable for sellers to keep trying to work this area until it fails.
SMH

Semis are a key driver in tech, but keep an eye on the $220 level as SMH gaps up this morning.
This was a prior support area turned into resistance. It’s also where the 10-week moving average is.
Like the QQQ, this would be a reasonable “sell spot” — at least upon the initial test. And it comes at a reasonable R/R zone, because if it breaks out, shorts know right away that they are wrong.
ARKK

Above is a weekly chart of the infamous ARKK. $46 has been stiff resistance, but ARKK is riding uptrend support and has a double bottom near $35.
Keep an eye on $46. Over it could open the door to $48, then $52.
$46 may continue acting as resistance, but that’s a lot of grinding against this level now.
AAPL

Set to gap up over Friday’s high, be careful with Apple.
Like the others, it’s possible we see a gap-and-go to the upside, but it’s also possible that we see a “sale” off the open.
It’s also in a good R/R spot for shorts, as they’ll know quickly if they’re wrong, and as the AAPL sits on a key area on the chart (June high, Q1 low, etc.).
If Apple gaps above Friday’s high of $150.86 and quickly trades back below it, it could be a good cash-flow short against the high of day.
Go-To Watchlist — Individual Stocks
*Feel free to build your own trades off these relative strength leaders*
- Numbered are the ones I’m watching most closely.
- Bold are the trades with recent updates.
- Italics show means the trade is closed.
Trade Sheets: DLTR traded well yesterday.
- MCK — We have hit two trim zones so far on MCK. Feel free to cash the last ⅓ of the position as you see fit. $335 to $340 is a potential upside target if it continues higher. Moving stop-loss up to $315
- $335 hit on Monday, up to you on how to manage from here. I’m holding the last ⅓ against a profitable stop-loss.
- DG — Maybe this is the wrong move, but with DLTR also in our pocket, I am going to cash the remaining ⅓ position in DG at the open. ||| This was not the wrong move after DG’s painful reversal on Friday. Position closed!
- MRK — Target No. 3 Hit on Friday’s push, now down to ¼ of a position and looking for $100 and riding against a $92 stop (profitable vs. our basis).
- DLTR — Hit our second target of “$169.50 to $170+”
- Down to ⅓ position and looking for $175 to $177 as our final target. Riding against a stop-loss at $162.50. More conservative traders who want to guarantee a profit can ride against a $165 stop.
Relative strength leaders (List is cleaned up and shorter!) →
- DLTR
- MRK
- COST
- PEP
- ABBV
- UNH
- JNJ
- XLE
- VRTX
- DG
- IBM
- MCK
Economic Calendar

As we all know, there’s no crystal ball when it comes to trading stocks, options, or futures. But the Market Imbalance Meter may be as close as it comes. Knowing how the “Big Money” is placing its bets can give our trading room a big wave to ride — or a warning sign to stay out of the water. Come check it out now, risk-free for 30 days.
Comments are closed