This post goes out as an email to our subscribers every day and is posted for free here around 2 PM ET. To get your real-time copy, sign up for the free or premium version here: Opening Print Subscribe.
Follow @MrTopStep on Twitter and please share if you find our work valuable!
Our View
It doesn’t matter what I think or what anyone else thinks. When the ball starts rolling, it’s hard to stop, even when you don’t think it makes sense.
Trump has a long history of trying to save the markets, and with record hedging and selling on the way down, the reversal was a total pain game for the shorts. They say more than 15 U.S. warships are going to support the closing of the Strait of Hormuz, with Trump threatening drug-style strikes on Iranian ships approaching the blockade.
I am not going to cast doubt on the outcome and will focus more on what the overall price action has been saying, which is higher prices. Let’s face it, the ES is only down 2.42% YTD. It’s hard to argue with that.
I do not think I am the only one who has paid more attention to the news than the overall price action on the indices. I have always tried to avoid watching the TV and what CNBC, Bloomberg, and FOX Business have to say; it’s all sensationalism.
Like I said yesterday, I did see the ES backing and filling two weeks ago and noted that there was a record level of hedging. The semiconductors have gone berserk; using the VanEck Semiconductor ETF (SMH) as a benchmark, the sector has climbed roughly 10.33% in the last 5 trading days. The PHLX Semiconductor Index ($SOX) mirrors this move, gaining 12.30%. Broadcom is up 18%, and NVIDIA is up 6.2%. These numbers are very hard to argue with!
Our Lean
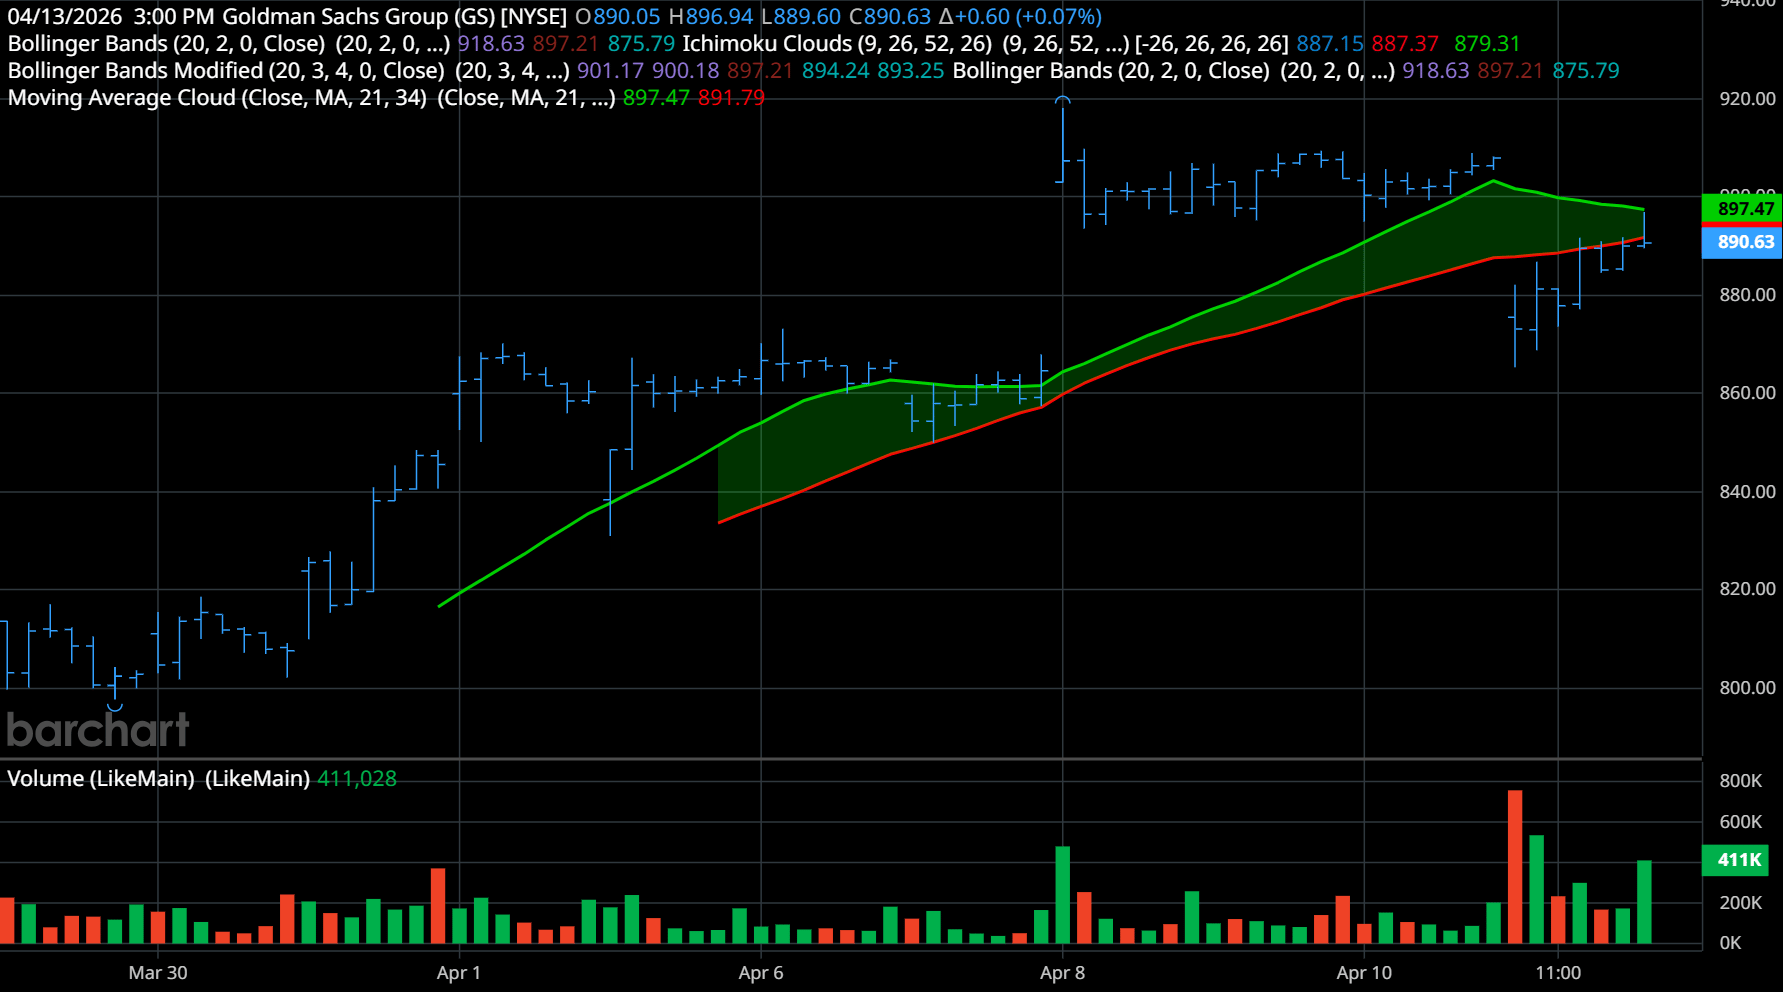
You may disagree, but there was another tip-off that I knew about last week, and it was Goldman Sachs (GS). Starting from 3/30/26, they have been up 7 of the last 8 sessions (not including yesterday’s drop), and yesterday they reported record profits of 19%, or $5.63 billion. From March 30 to last Friday, GS has gained 12.41%. Today, JPMorgan Chase (JPM) reports at 7:00 ET and both Citigroup (C) and Wells Fargo (WFC) report pre-open, which I suspect will also be strong earnings.
I guess there are a few questions that still need answering: 1) Will Iran acquiesce? and 2) How far will the S&P go up without another drop? I know I have provided some hints to the markets going up, but the fact that I didn’t read it more strongly “pisses me off.” I should know when the S&P drops +10% it’s a threshold, but as I said, I got too caught up in the headline BS.
Our lean: I can’t rule out the ES and NQ still going up, but if you look at how much they have gone up over the last 10 sessions (up 8, down 1, and 1 unchanged), or up 534 points, or 8.35% for the NQ, I think you have to be cautious. Additionally, after the 158-point rally from Sunday night’s Globex low, I’m not sure the ES will go up as much or as fast today.
I don’t have any doubt the ES will take out its 2/10/26 high of 7059.50, but I don’t want to say that will be today unless Iran flinches. I can’t rule out selling an early rip, but the trend is your friend, and right now that’s buying the pullbacks.
I want to point out something: my Claude AI levels had Sunday night’s Globex low and yesterday’s high. I have stripped out a lot of the indicators and moved strictly to the market profile.
Claude AI ES Levels
Level
Price
Source
Notes
Strength
Resistance
R5
7,082.25
Dataset high
02/03 absolute high — structural ceiling for entire period
●●●
R4
7,065.25
Swing high
02/11 high — rejected hard, −1.58% next session
●●●
VAH
7,035.00
Value area high
02/25 swing high; upper bound of 70% composite value area
●●●
R3
6,968.00
Swing high cluster
02/27 high (6,968) — sold off −0.45%; confluent with 02/26 range
●●○
R2
6,953.50
Swing high
03/05 high — sold off three consecutive sessions after
●●○
POC
6,924.00
Composite POC
Most time spent across all 50 sessions — strongest single magnet
●●●
R1
6,928.25
Session high / nPOC
04/13 session high; immediate overhead ceiling, unretested
●●○
Current price
NOW
6,855.25
Last close
04/10 close · inside value area · below POC · above VAL
—
Support
S1
6,846.25
Session low
04/10 low — immediate floor; break opens gap to S2
●○○
S2
6,813.00
Low cluster
03/10 low (6,813) + 03/11 low (6,800) — two-session base
●●○
nPOC
6,792.50
Naked POC
04/09 session midpoint — unvisited downside magnet
●●○
S3
6,766.25
Low cluster
03/06 low (6,766) + 03/03 low (6,769) — two-touch base
●●○
S4
6,721.75
Low cluster
03/12 low (6,721) + 03/17 low (6,715) — tested twice, held
●●○
S5
6,656.00
Low cluster + vol
03/16 low (6,656) + 04/08 low (6,652) — 2.2M & 2.0M vol sessions
●●●
VAL
6,651.00
Value area low
04/06 low confluent; lower bound of 70% composite VA — key acceptance test
●●●
S6
6,631.50
Swing low + vol
03/09 swing low; high-volume session anchor (1.6M+ range)
●●●
nPOC
6,623.00
Naked POC
04/07 session midpoint — unvisited; confluent with S6 zone
●●○
S7
6,573.50
Low cluster + vol
03/24 (6,573) + 04/07 (6,572) + 04/06 (6,567) — 3 touches, high vol
●●●
S8
6,523.75
Low cluster + vol
03/20 low (6,523); 2.01M vol session — institutional range anchor
●●●
S9
6,483.50
Swing low + vol
03/23 swing low; 2.18M vol — largest buying range in dataset
●●●
nPOC
6,468.25
Naked POC
03/31 session midpoint — deep unvisited magnet below value
●●○
S10
6,389.00
Vol anchor low
03/27 low; 1.92M vol session — base of major selloff leg
●●●
S11
6,353.25
Dataset low
03/31 absolute low — highest-volume session (2.36M);
structural floor
●●●
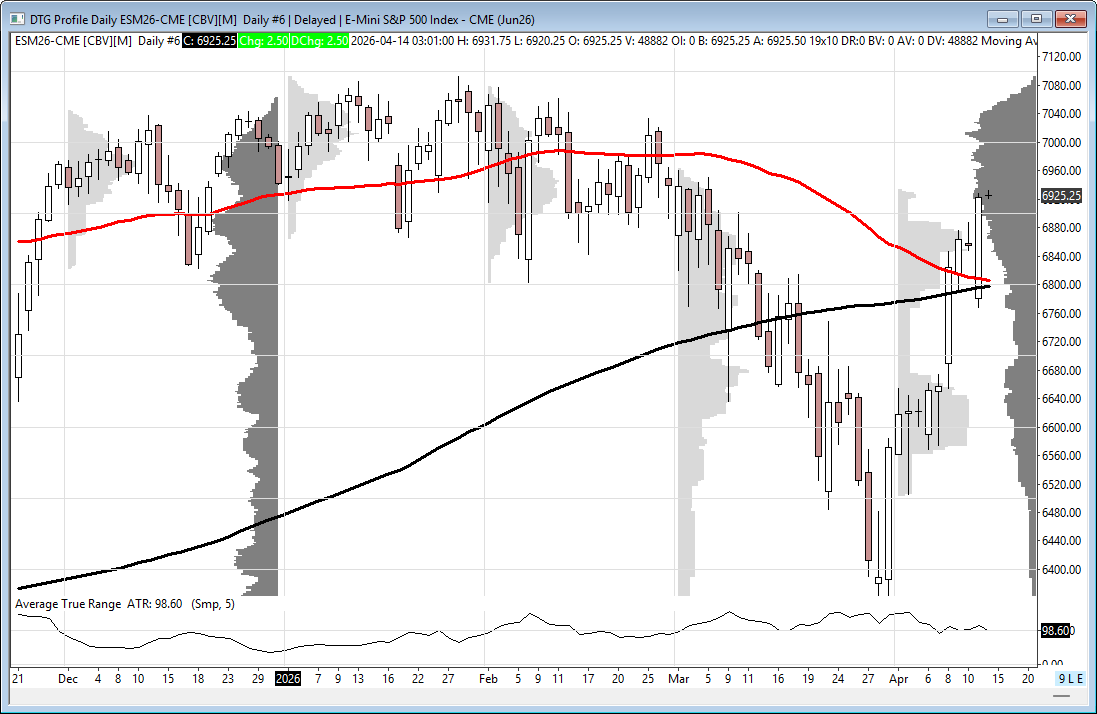
ES Market Profile Commentary — April 14 2026
Price is parked directly underneath the composite POC at 6924, which is the single most significant level in this entire dataset — 19 sessions worth of time-at-price overhead. The 04/13 session closed at 6922.75, printing just two and a quarter handles below it. That’s not coincidence; that’s acceptance probing the lid.
The structure is constructive. The last four sessions have built a staircase of higher lows off the 03/31 absolute low at 6353.25 — the highest-volume session in the dataset at 2.36M contracts — which is the kind of capitulation flush that tends to mark a meaningful low. Price has since reclaimed VAL at 6651 the S5/VAL confluence zone that two multi-million-contract sessions tried and failed to break and is now pressing the underside of POC. That sequence — flush reclaim value press POC — is textbook accumulation behavior.
The immediate case for extension is clean. A daily close above 6928 — taking out both POC and the 04/13 session high simultaneously — opens the door to R2 at 6953 and R3 at 6968 in relatively short order. There’s no meaningful resistance between 6928 and 6953; that’s a 25-handle air pocket. The naked POC at 6974 from 02/26 sits just above R3 and acts as a secondary magnet in that same push. If buyers absorb at POC and continuation holds the measured target becomes VAH at 7035 which also happens to be the 02/25 swing high — a clean structural objective roughly 113 handles above current price.
The nPOC at 6847.50 from 04/13 is the first downside reference that matters. Price tagged that level on the session open before rallying to close near the highs leaving it as an unfilled midpoint just below. If POC rejects and price pulls back intraday that 6847 zone is the first place buyers should show up. A failure there opens the 6813 two-session base at S2 which is still well within the value area and wouldn’t damage the bullish thesis — it would just extend the base-building process.
The thesis breaks if price loses VAL at 6651 on a closing basis. That level has two high-volume sessions defending it and aligns with the composite value area lower boundary. A close below it shifts the read from accumulation to distribution and the next meaningful support doesn’t arrive until S7 at 6573 — a three-touch cluster that held during the March washout. That’s the line in the sand.
As long as price holds above 6651 the path of least resistance is into the 7000–7035 range. The POC flip is the trigger. Watch 6928 on the open.

Guest Posts:
Tom Incorvia – Blue Tree Strategies
Sherman-William (SHW)
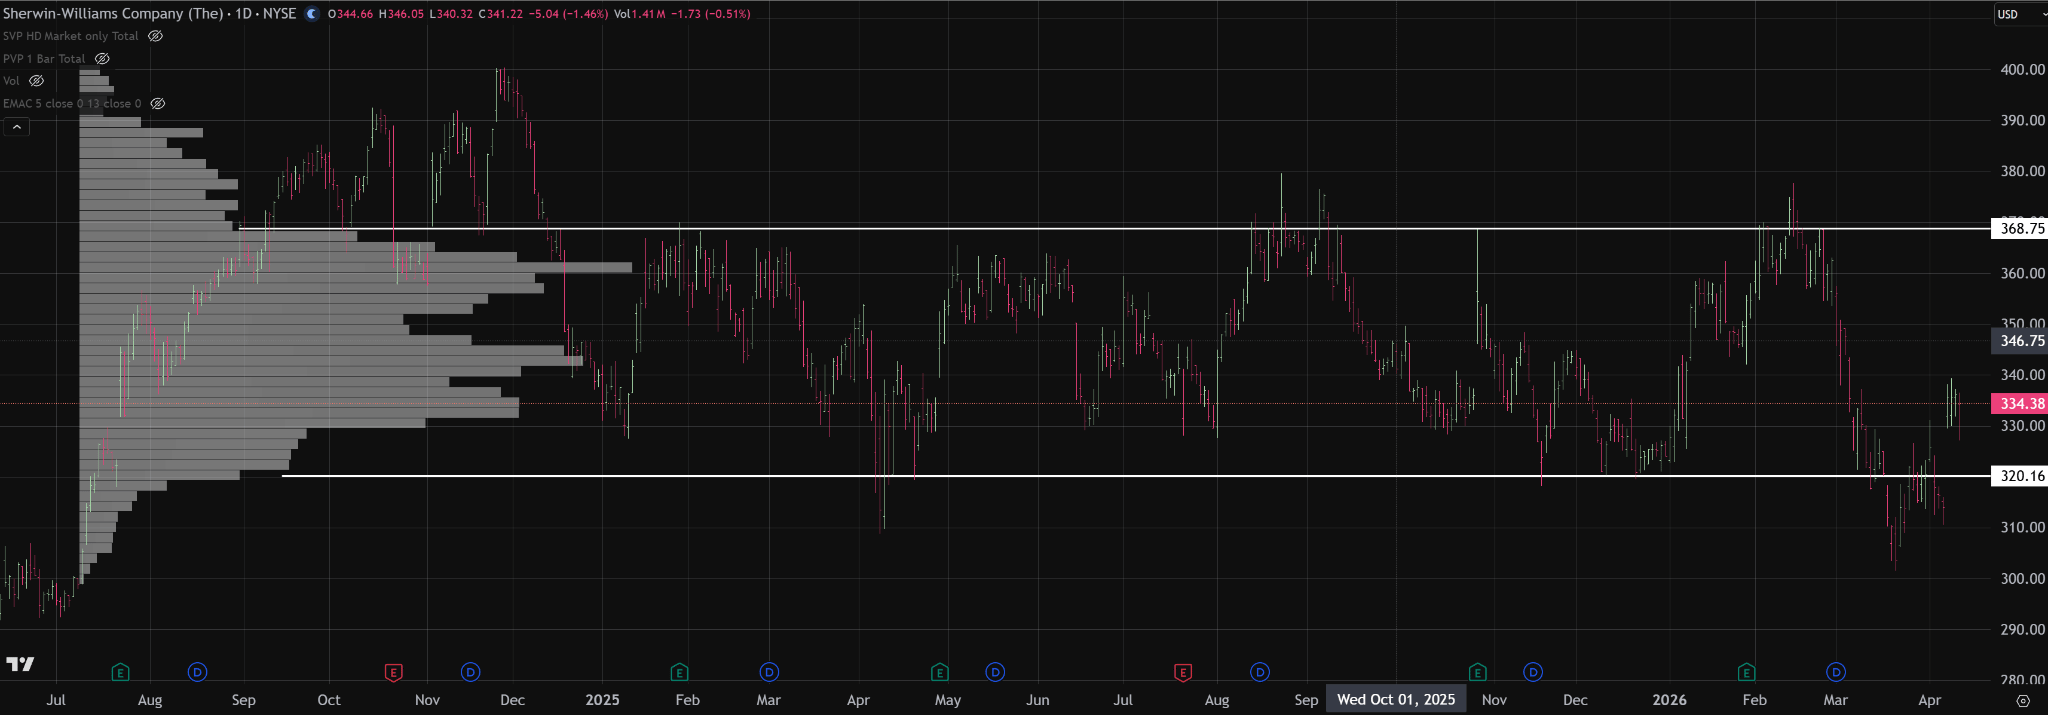
Sherwin-Williams (SHW) has been auctioning in a well-defined balance area since July 2024, with the market largely accepting value between roughly 320 and 368. The recent break below 320 appears to have been rejected, which is important because failed downside auctions often signal that price probed for new value lower and found no acceptance. From a market technician’s point of view, re-entry back into the established balance area shifts the focus away from downside continuation and back toward rotation within value, with the opposite extreme near 368 becoming the natural upside objective if buyers can continue to hold acceptance back inside the range.
You can purchase Tom’s Course on Volume Profile here
Market Recap
Well, it was another “headline knockdown and rally.”
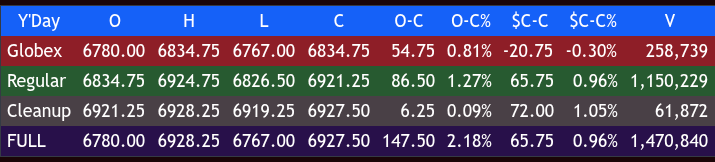
After trading down to 6767.00 on Globex, the ES traded up to a new high of 6834.75 at 9:27 AM. It opened Monday’s regular session at 6,834.75, down 20.75 points, or -0.30%. After the open, the ES traded up to 6840.00, pulled back to 6826.50, and rallied up to 6855.50 at 9:51 AM. It then pulled back to 6845.00 at 10:20 AM and “stutter-stepped” up to 6868.25 at 10:55 AM.
The ES sold off 17.00 points down to 6851.25 at 12:00 PM, rallied up to a lower high at 6865.50, and pulled back to 6857.75 at 12:10 PM. It then traded up to a new high of 6890.00 at 12:50 PM, pulled back to 6879.75, double-topped at 6890.00 at 1:15 PM, traded in a sideways-to-down “back and fill,” and traded 6880.25 at 1:50 PM.
After another sideways-to-up move, the ES traded up to 6897.75 at 3:00 PM, dipped to 6892.00 at 3:10 PM, and rallied to 6907.25 at 3:35 PM. It sold off to 6899.25 and traded 6902.25 as the 3:50 PM cash imbalance showed $3 billion to buy, and then ripped up to 6924.75 at 3:55 PM and traded 6921.75 on the 4:00 PM cash close.
After 4:00 PM, the ES traded 6918.75, moved up to 6928.75, and settled at 6921.75 (up 66.25 points, or +0.97%; +154.75 from the Globex low). This led the broader market, as the NQ settled at 21,345 (+256 points, or +1.21%; +412 from the Globex low), the YM finished at 43,210 (+315 points, or +0.73%; +580 from the Globex low), and the RTY closed at 2345 (+22 points, or +0.95%; +65 from the Globex low).
In the end, it was all upside, and the higher it went, the harder it got to buy. I did put out a post on Twitter saying there was a big line of buy stops from 6880 to 6930, and the ES traded 6928.75, but I have to admit I really could not believe it could go up so much in 20 hours.
In terms of the ES and NQs’ overall tone, they were from Sunday night’s low all the way up to yesterday’s highs. In terms of the ES’s overall trade, volume was on the low side at 1.472 million contracts traded.
On Tap Today
JPMorgan Chase (JPM) 7:00 ET, Citigroup (C) pre-open, Wells Fargo (WFC) pre-open
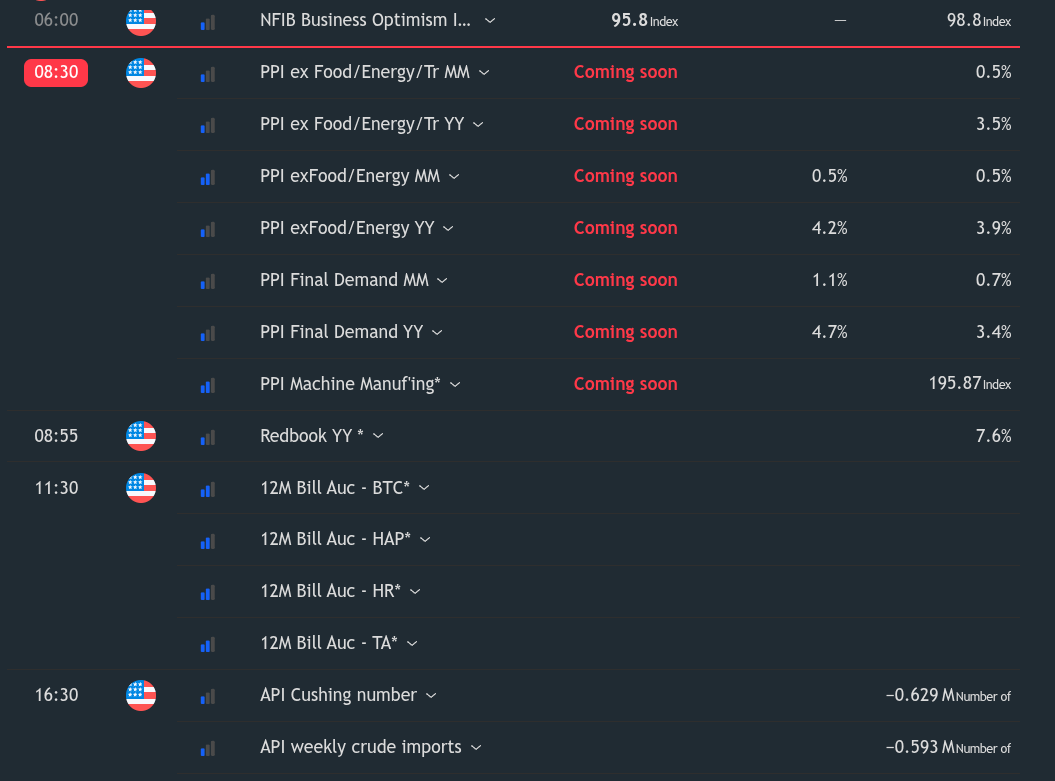
8:30 ET: Import Price Index; Empire State Manufacturing; Michael Barr speaks
10:00 ET: Home Builder Confidence
1:45 ET: Michelle Bowman speaks
2:00 ET: Fed Beige Book
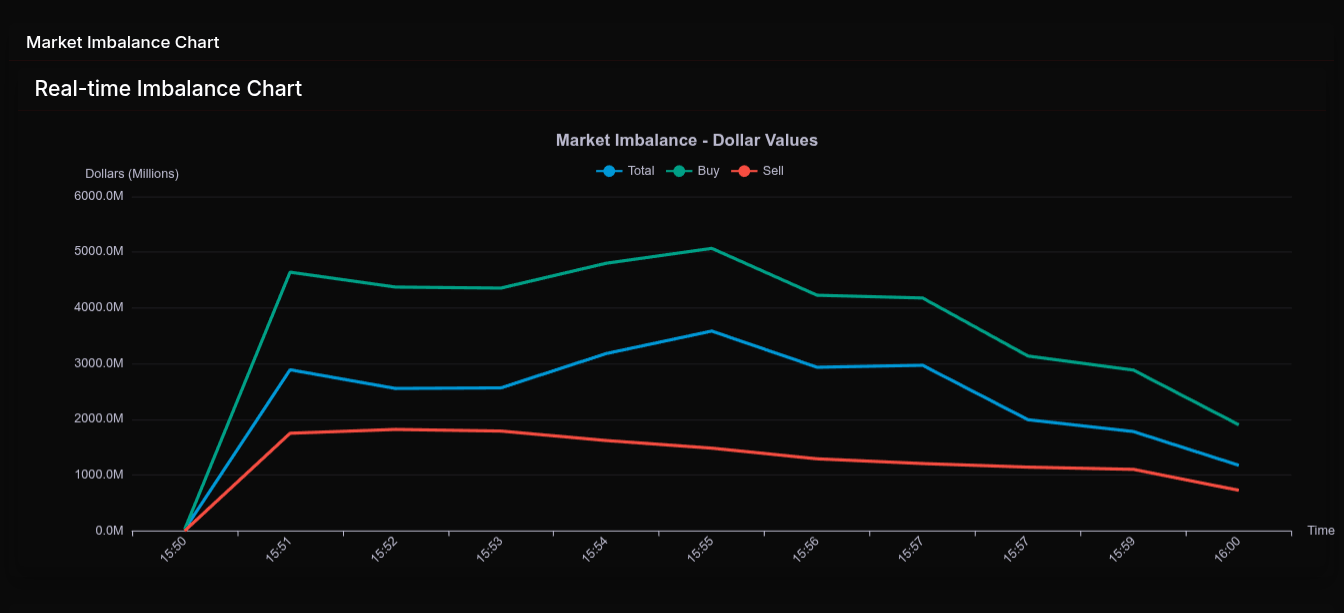
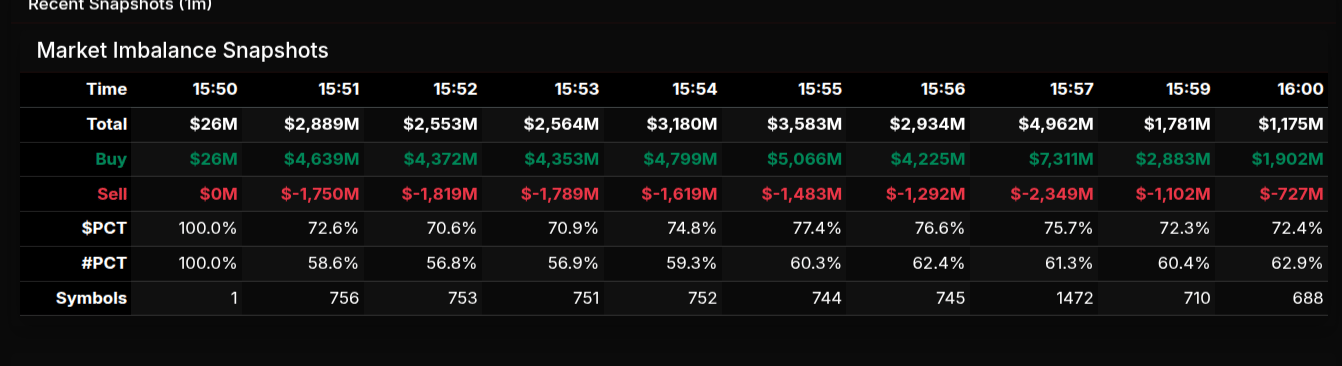
MiM
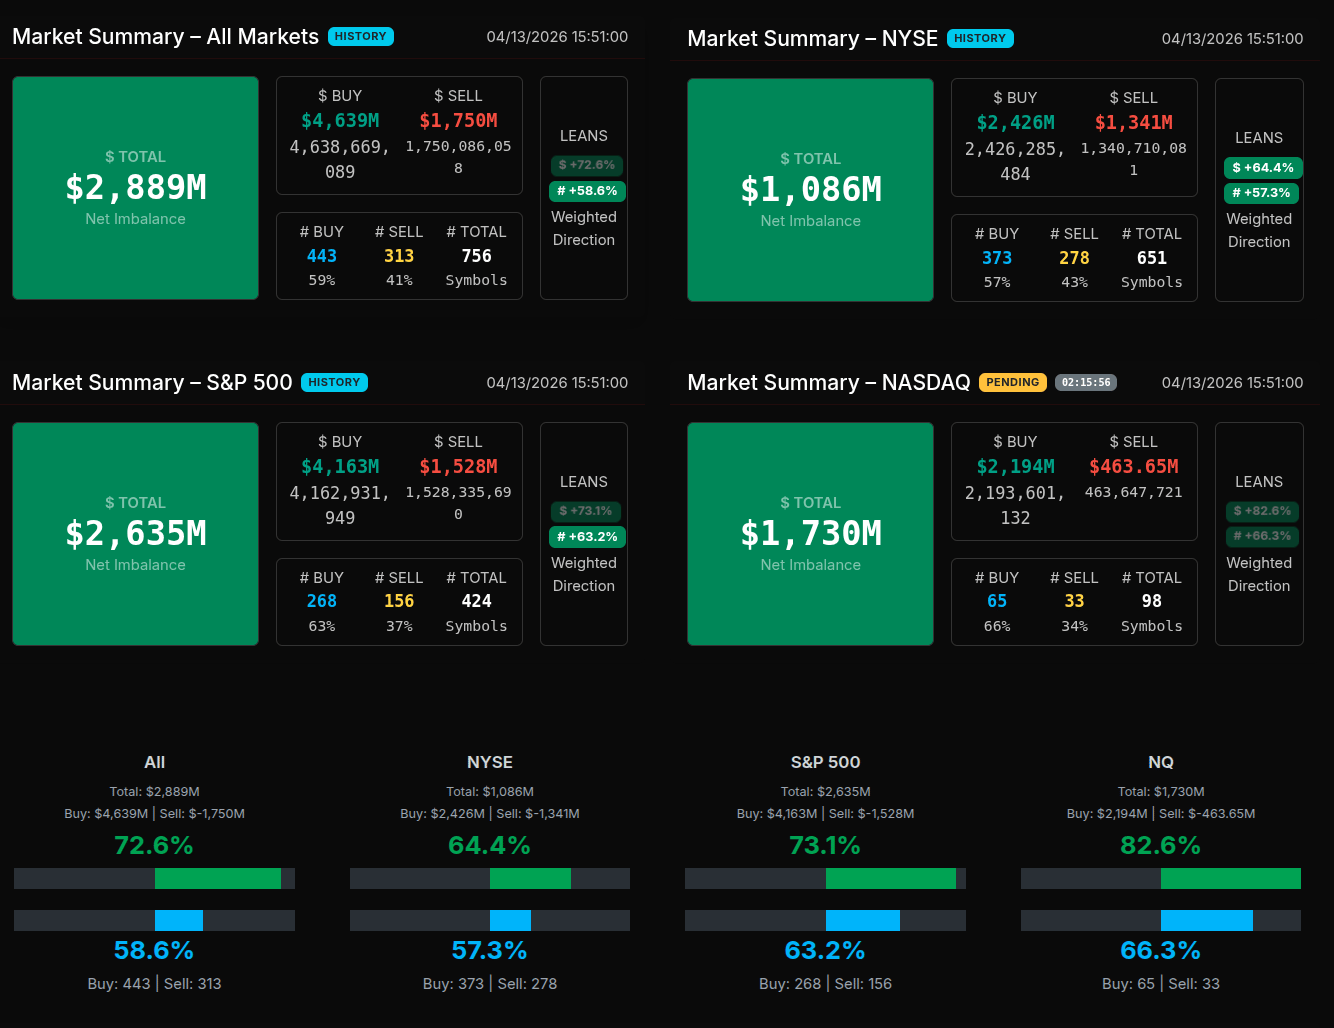
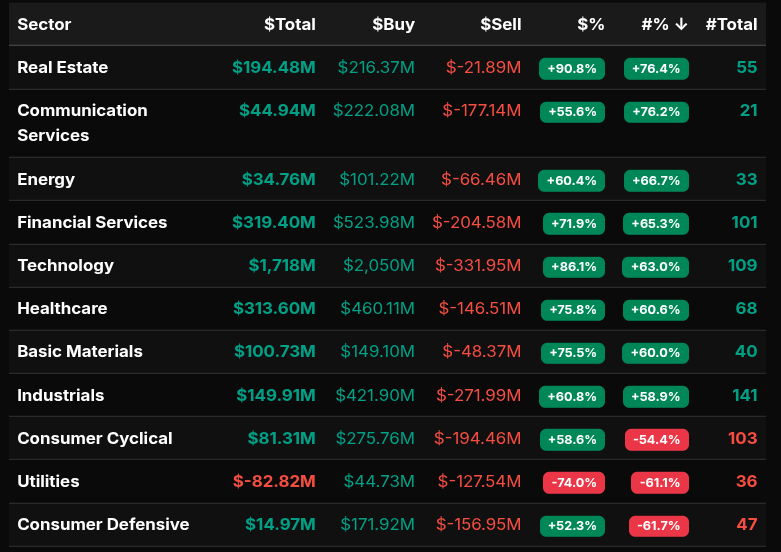
Market-on-Close Recap – MiM
The MOC session opened with a sharp imbalance shift from an initial -$4M reading at 15:50 into an aggressive buy-driven tape by 15:51, where net imbalance surged to +$1.58B. Buy programs immediately dominated, printing over $3.3B versus $1.8B for sale, establishing a clear institutional bid early in the auction window. From 15:51 through roughly 15:55, the tape remained consistently buy-heavy, with $PCT readings holding in the 61–68% range—firmly directional rather than rotational.
As the session progressed, however, the imbalance began to decay. Buy notional steadily declined from peak levels (~$3.5B) down toward ~$2.1B into 15:58, while sell pressure stabilized rather than expanded. This created a compression phase, reflected in $PCT drifting toward the mid-50s by 15:59, signaling a transition from strong directional flow into a more rotational environment. By the close (16:01), the imbalance flipped negative (-$137M), indicating late sell-side dominance and a meaningful reversal in auction pressure.
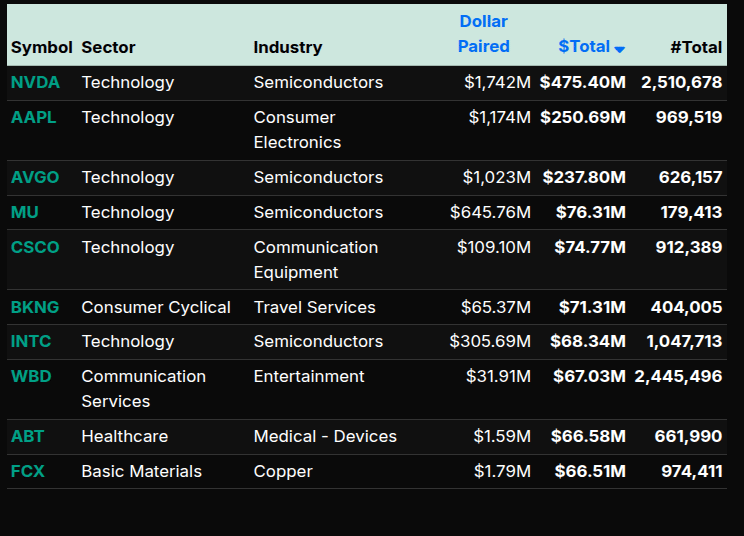
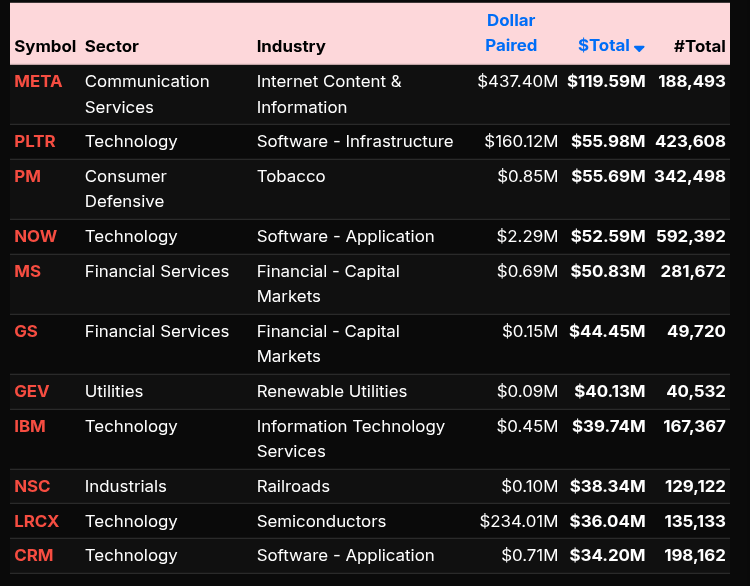
Sector flows were broadly constructive early, with Technology (+79.1%), Financials (+82.3%), and Consumer Cyclical (+81.1%) showing strong buy-side conviction—well beyond the >66% threshold that indicates wholesale accumulation. Energy (+71.5%) also qualified as a strong buy sector. In contrast, Utilities (-74.6%) and Consumer Defensive (-71.1%) exhibited clear institutional selling, both exceeding the -66% threshold, suggesting defensive rotation out of safety.
Single-name flows reinforced this bifurcation. On the buy side, NVDA (+$331M), TSLA (+$150M), and V (+$143M) led, alongside semiconductor strength (MU, AMD, AVGO), confirming growth and beta demand. On the sell side, META (+$127M sell imbalance), IBM, and AAPL showed distribution, indicating selective profit-taking within large-cap tech despite broader sector strength.
Overall, the MOC evolved from a strong institutional buy program into a late-stage unwind. Early directional conviction gave way to rotation and eventual sell pressure, highlighting a market that began with aggressive risk-on flows but closed with signs of rebalancing and supply absorption.
Technical Edge
Fair Values for April 14, 2026:
-
SP: 37.57
-
NQ: 161.51
-
Dow: 196.61
Daily Market Recap 📊
For Monday, April 13, 2026
• NYSE Breadth: 74% Upside Volume
• Nasdaq Breadth: 83% Upside Volume
• Total Breadth: 80% Upside Volume
• NYSE Advance/Decline: 71% Advance
• Nasdaq Advance/Decline: 72% Advance
• Total Advance/Decline: 72% Advance
• NYSE New Highs/New Lows: 86 / 36
• Nasdaq New Highs/New Lows: 196 / 118
• NYSE TRIN: 0.84
• Nasdaq TRIN: 0.50
Weekly Breadth Data 📈
For Week Ending Friday, April 10, 2026
• NYSE Breadth: 54% Upside Volume
• Nasdaq Breadth: 67% Upside Volume
• Total Breadth: 62% Upside Volume
• NYSE Advance/Decline: 68% Advance
• Nasdaq Advance/Decline: 40% Advance
• Total Advance/Decline: 51% Advance
• NYSE New Highs/New Lows: 220 / 122
• Nasdaq New Highs/New Lows: 410 / 419
• NYSE TRIN: 1.77
• Nasdaq TRIN: 0.33
ES & NQ Levels (Premium only)

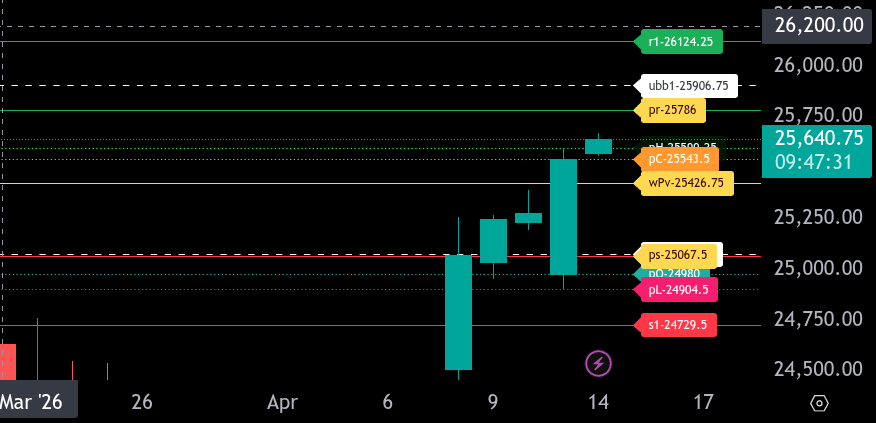
ES – M26 Levels
The bull/bear line for ES is 6892.75. That remains the key pivot for today. As long as price holds above that level, the short-term tone stays constructive and buyers can continue to lean on pullbacks into support.
ES is trading around 6931.75 in the current Globex session, which keeps price above the bull/bear line and slightly above the nearby 6928.25 and 6922.75 reference levels. Those two marks are the first support zone this morning. If ES holds that area, the market can continue pressing higher toward 6974.50, which is the upper intraday range target. Just above that, 6981.00 is the next resistance zone, and a clean push through there opens the door to 7051.50.
If price slips back below 6922.75, watch for a retest of 6892.75. That is the most important support on the board. Losing that level would shift the tone back bearish and put 6810.75, the lower intraday range target, into focus. Below that, additional support comes in at 6793.50, 6780.00, 6767.00, and then 6733.75.
On the upside, the path remains constructive while ES holds above 6892.75. Bulls want acceptance above 6974.50 to target 6981.00 and then 7051.50. Bears need to force price back under 6892.75 to regain control and open the move toward 6810.75.
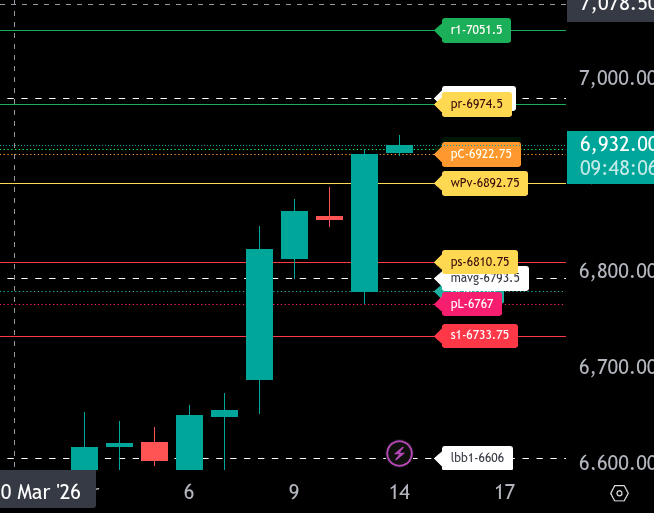
NQ – M26 – Levels
The bull/bear line for the NQ is at 25426.75. This remains the key pivot for today’s session. Holding above this level keeps the market in a bullish posture, while losing it would signal a shift back to weakness.
Currently, NQ is trading around 25638.75 after a strong overnight push, clearly above the bull/bear line. This confirms bullish momentum in the near term. As long as price holds above 25426.75, dips are likely to be bought.
On the upside, the first resistance comes in near 25786.00, which is the upper intraday range target. A break and hold above this level opens the door for continuation toward 25906.75 and then 26124.25. Momentum through these levels would signal strong trend continuation.
On the downside, initial support sits at 25599.25, followed by 25543.50. If price begins to rotate lower, these are the first areas to watch for responsive buying. A break below these levels would target 25067.50, the lower range target. Loss of that level would shift control back to sellers.
Overall, the market is firmly bullish above 25426.75, with strong upside momentum coming out of Globex. Watch for continuation if 25786.00 is reclaimed and held, while any failure back below 25543.50 would be the first sign of exhaustion.
Calendars
Economic Calendar
Trading Room Summaries
Polaris Trading Group Summary – Monday, April 13, 2026
Monday was a strong, well-structured bullish session in the PTG room, with David’s premarket framework lining up exceptionally well with how the day unfolded.
Premarket Outlook
-
David set a confident tone early, noting that the overnight price action had “played out beautifully” from the Daily Trade Strategy briefing.
-
The room came in with a clear Cycle Day 1 bullish plan: hold acceptance above 6785 ±5 and target 6800, 6815, and 6825.
-
That bullish scenario worked early, with David confirming the upside targets were fulfilled.
-
The classic Globex gap-lower recovery further reinforced that buyers were in control from the start.
Morning Session
-
As the regular session opened, members stayed focused on structure, support, and key reference levels.
-
There was useful discussion around the dynamic money box, open range levels, bull line support, and gap structure.
-
DanV contributed a standout setup with the D-level reclaim pyramid call, which the room recognized as a quality trade.
-
David later confirmed the gap fill was official.
-
Bruce also pointed out a nice bounce off the RTH VWAP, adding to the picture of steady buyer support.
Educational Takeaways During the Session
-
Ram asked about how gaps are calculated, leading to helpful clarification around defining the gap range.
-
That exchange added educational value to the day and reinforced the importance of understanding exact price references.
-
The room continued to emphasize process over noise, using live market structure to teach practical execution.
Afternoon Trade Development
-
In the afternoon, David noted that bulls were holding a firm bid and testing the prior high at 6888.
-
He laid out a fresh upside roadmap: if price could clear and convert that area into support, the next targets were 6893, 6899, and 6904.
-
The market followed that roadmap with precision, hitting 6893 first, then 6899, and finally 6904.
-
This was one of the clearest examples of the day’s discipline: patient, level-to-level execution instead of chasing price.
Strength of the Session
-
David noted that the market had moved 140.25 handles on the day so far.
-
That exceeded the 10-day average of 114.25, showing this was an unusually strong expansion session.
-
He also commented that the “shock absorber effect” worked very well, suggesting one of the room’s core ideas performed exactly as expected.
Options and Market Structure Lessons
-
Late in the day, David tied price action to Gamma Guys levels and options-related magnet zones.
-
He noted how price appeared to gravitate toward those levels, reinforcing the idea that options positioning can matter greatly.
-
His reminder was clear: traders who are not watching options flows may be missing an important layer of market context.
Closing Tone
-
The day finished with a very positive tone as David called it a super strong Cycle Day 1.
-
He also highlighted a $2.6 billion MOC buy imbalance into the close.
-
His closing reaction, “Waaay To Go!”, captured the room’s sense of a day well traded and well read.
Positive Trades and Wins
-
David’s premarket bullish framework aligned very closely with the actual session.
-
The overnight thesis and early recovery worked as expected.
-
DanV’s D-level reclaim setup stood out as a strong intraday call.
-
The afternoon roadmap to 6893, 6899, and 6904 was one of the best-executed sequences of the day.
-
The room stayed aligned with momentum rather than fighting the trend.
Lessons Learned
-
A strong premarket plan gives traders confidence and direction.
-
Cycle Day context continues to be a valuable framework for bias and trade planning.
-
Gap fills, VWAP, and prior highs remain important decision points.
-
Strong trend days reward patience, confirmation, and trust in the roadmap.
-
Options and gamma levels can act like magnets and deserve attention.
Overall Summary
-
This was a highly productive PTG session with strong leadership from David, clean bullish continuation, multiple target fulfillments, and solid educational value throughout.
Discovery Trading Group Room Preview – Tuesday, April 14, 2026
-
Macro focus: Markets remain centered on the US/Iran conflict and the start of major earnings.
-
Risk tone: Despite failed weekend talks and renewed Strait of Hormuz threats, the S&P 500 rallied back to pre-war levels Monday, signaling that equities are still leaning toward an eventual diplomatic outcome.
-
Ceasefire watch: Reports suggest discussions are ongoing around a longer-term ceasefire ahead of the current two-week pause expiring.
-
Oil: Crude remains the key macro risk. Futures are hovering near $100, but physical market pricing is reportedly much tighter, pointing to continued supply strain and inflation risk.
-
Fed/rates: Treasury Secretary Bessent said the Fed is right to stay in wait-and-see mode as it monitors how the Iran conflict affects the economy.
-
Today’s data: NFIB Small Business Index at 6:00 a.m. ET, ADP Employment Change at 8:15 a.m. ET, and PPI at 8:30 a.m. ET.
-
Fed speakers: Goolsbee and Barr at 12:15 p.m. ET, followed by a panel with Barkin, Collins, and Paulson at 1:00 p.m. ET.
-
Earnings this morning: BLK, C, JNJ, JPM, WFC.
-
Wednesday earnings: ASML, BA, MTB, MS, PNC, PGR.
-
Volatility: Monday’s rebound came with a sharp pickup in volatility. Upside vol likely cools if ES holds above 6900.
-
Positioning: Whale bias is leaning bearish into the 8:30 a.m. ET PPI print on light overnight large-trader volume.
-
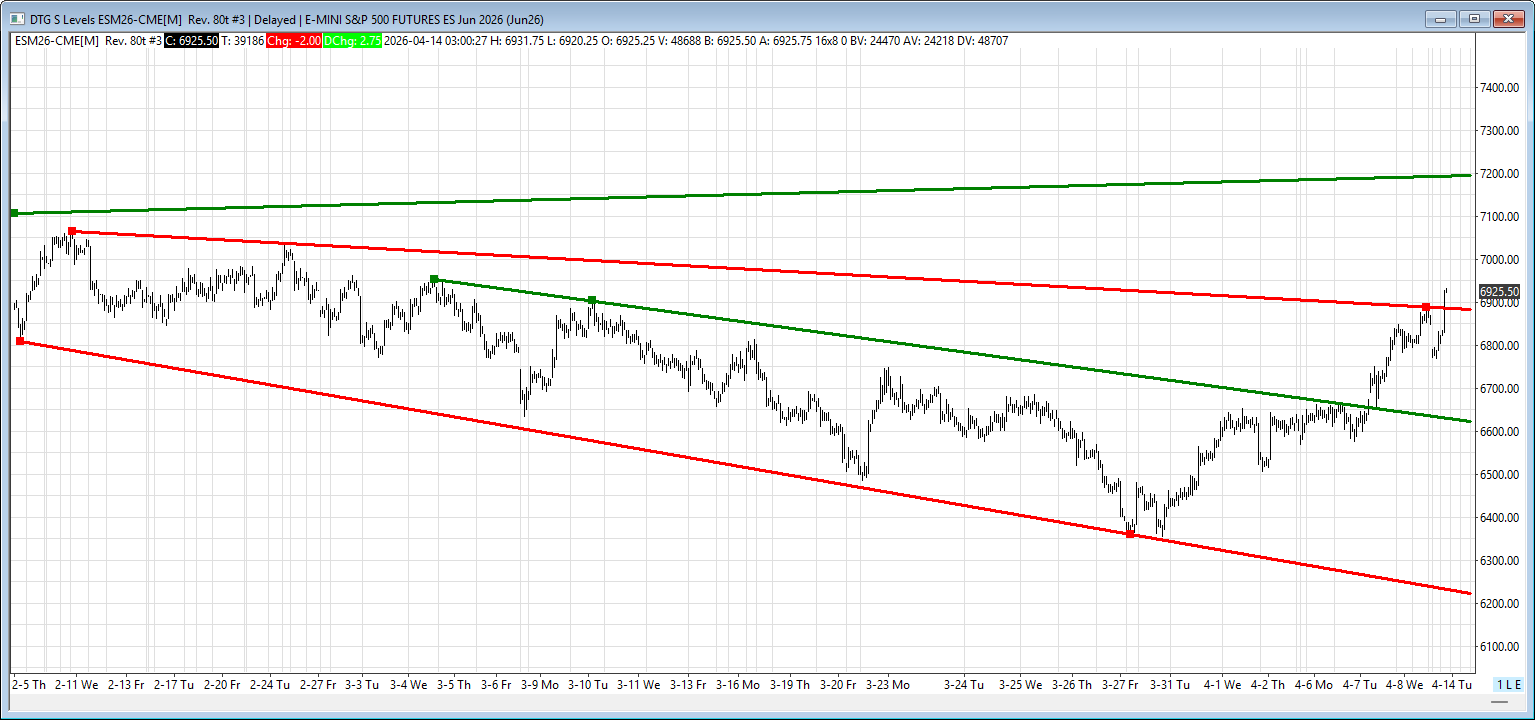
Technical tone: ES reclaimed the intermediate-term downtrend channel and moved back above both the 50-day MA (6806.25) and 200-day MA (6798), shifting near-term structure back to bullish.
-
Key ES resistance: 7195/7200.
-
Key ES support: 6885/6882, then 6622/6617, and 6220/6215.
Affiliate Disclosure: This newsletter may contain affiliate links, which means we may earn a commission if you click through and make a purchase. This comes at no additional cost to you and helps us continue providing valuable content. We only recommend products or services we genuinely believe in. Thank you for your support!
Disclaimer: Charts and analysis are for discussion and education purposes only. I am not a financial advisor, do not give financial advice and am not recommending the buying or selling of any security.
Remember: Not all setups will trigger. Not all setups will be profitable. Not all setups should be taken. These are simply the setups that I have put together for years on my own and what I watch as part of my own “game plan” coming into each day. Good luck!
This post goes out as an email to our subscribers every day and is posted for free here around 2 PM ET. To get your real-time copy, sign up for the free or premium version here: Opening Print Subscribe.
Comments are closed