This post goes out as an email to our subscribers every day and is posted for free here around 2 PM ET. To get your real-time copy, sign up for the free or premium version here: Opening Print Subscribe.
The Silent Celebration: When All-Time Highs Echo in an Empty Room
Follow @MrTopStep on Twitter and please share if you find our work valuable!
Our View
Well… after all the back and fill and all the Trump headlines, the ES and NQ edged higher on Globex, trading up to 6296.75 at 9:29:30 and opening Wednesday’s 9:30 regular session at 6295.25. They traded down to 6239.75 and rallied up to 6315.25 at 9:50, then back down to the 6276.00 area around 11:20. From there, the ES rallied up to the 6302 area and then up to the 6310 area as the imbalance came out $1.4 billion to buy.
If you don’t think the late rallies have something to do with the imbalance buys, you should go back and look at the charts after 2:00.
I have a lot of in-depth discussions about the state of the markets. The main takeaway is something I have been saying for years: the markets are constantly evolving, and the patterns we recognize only last as long as it takes the coders to change the program.
At my desk in the S&P, I knew that the retail orders traded with other paper orders or locals in the pit. But now, most of the “bid/offer” is made up of various programs—from algorithmic trading to auto buy and sell bots that reverse from long to short all day using buy and sell stops. One of the brokers I used in the NASDAQ pit opened up a firm called RCM Alternative Investment. They offer funds, capital, and track over 1,000 live trading systems https://automated.isystems.com/Systems/TopStrategies.
Anyways, this is a small company compared to Jump Trading (the CME’s largest customer), Citadel, or any of the other big prop trading firms that run hundreds of programs 24 hours a day. These programs distort the price action—it’s readable but filled with a lot of false starts. The patterns I see are an initial move up, a pullback, and then long periods of volumeless trade, usually followed by retracements.
The hour of power has become a big two-way mess and harder to trade if you don’t get out fast. The larger 3:50 buy imbalances usually show their hand with the ES getting bid up late, but a big buy usually sees another pop that doesn’t last. In the end, the ES and NQ are up so much that the “little” drops or pullbacks add shorts that feed the indices higher when the cash buyers step back in. In terms of the ES’s and NQ’s overall tone, they were firm all day, even when they pulled back.
In terms of the ES’s overall trade, volume was in line with the last few days at 1.090 million contracts traded.
Our Lean
Thursday is happy hour in the restaurants and bars in Delray Beach, but it’s not happy hour in the markets despite the S&P and Nasdaq hitting new all-time contract highs. There is no cheering or confetti to celebrate the new highs, no phones ringing, no clerks taking your orders, no yelling and screaming—it’s just the hum of the computer.
I think we can agree on one thing: it is hard sitting all day when the markets are this slow. We went from an extremely volatile selloff with ES volume of +3.5 million to a big rally and declining volume. As they say…the higher it goes, the thinner it gets.
It’s been a very quiet week on the economic front. Today we have the Initial Jobless Claims at 8:30, St. Louis Fed President Alberto Musalem’s speech at 10:00 am, and San Francisco Fed President Mary Daly’s speech at 2:30 pm. The dog days of summer start on July 3 and go to August 11 each year, and I think you can feel it. IT’S DEAD!!!!
The downside support levels are easy: 6246–6250, 6276–6280. I know they are tight, but unless something big hits, one of these levels should hold.
Sentiment did a big U-turn when the markets rallied, but willingness to buy into market dips and a growing expectation that the Federal Reserve may soon start cutting interest rates have been helping fuel the markets higher.
Yes, I sold the gap-up open yesterday and initially took a loss, but then sold three ES and made 20 points on the short and got long into the dip.
Our lean is to buy on a lower open or sit on my hands and wait to buy the pullbacks.
MiM and Daily Recap


Intraday Recap
The overnight Globex session opened at 6272.00 and spent the early hours in a choppy, two-way trade. After an initial decline to 6260.00 at 21:30 ET, marking the first notable low, the market staged a rebound to 6270.75 by 22:00 before slipping again. Another push lower at 02:00 tested 6260.50, establishing the overnight session’s final low. From that point, buyers gradually stepped in, creating a sustained rally that extended into the premarket hours. By 05:40, ES reached 6283.75, reflecting a 23.25-point recovery (+0.37%) from the session’s open. The climb continued steadily, culminating in a high of 6296.75 just before the cash open at 9:30 AM ET.
During Globex, the session closed at 6295.25, a net gain of 23.25 points or 0.37%. Notably, the Globex range spanned 36.75 handles, and the rally into the open helped set a positive tone ahead of the cash session. Volume for Globex reached 111,510 contracts.
The regular cash session opened at 6295.25 and quickly extended the overnight advance. A brisk surge took ES to an early high of 6315.25 by 9:50 AM, marking a 38.25-point advance from the first Globex low and reflecting bullish enthusiasm off the open. However, momentum faded by late morning, leading to a sharp decline toward 6276.00 at 11:15 AM, a 39.25-point retracement from the morning’s peak. After this selloff, the market attempted a modest rebound to 6292.75 around 11:45 but failed to recapture earlier highs.
Midday trade remained choppy. The index drifted lower to 6282.50 at 12:10 before stabilizing into the afternoon. A steady climb followed, lifting ES to a late-day high of 6310.00 by 16:10. A brief dip to 6302.75 at 16:20 preceded a final push into the close. The regular session settled at 6307.00, representing an 11.75-point gain (+0.19%) from the day’s open and a 36.50-point advance (+0.58%) from the prior cash close.
The Cleanup session saw minimal volatility. ES ticked marginally lower to close at 6306.25, only 0.75 points below the regular settlement, keeping the day’s gains intact.
Overall, the full session logged a 34.25-point rise (+0.55%) relative to the prior settlement, with total volume surpassing 1,091,000 contracts.
The overall tone was moderately bullish, with persistent buying interest evident in both Globex and cash hours. The strong early Globex rally provided a tailwind that carried through most of the day despite midday weakness. Liquidity remained healthy, with moderate volume, particularly during the cash session.
The Market-on-Close imbalance data showed a significant buy skew, with the dollar imbalance peaking at $2.467 billion, 74.5% on the buy side. Although the symbol percentage at 57.3% did not exceed the ±66% threshold for an extreme imbalance, the heavy dollar figure likely contributed to the late afternoon resilience and the final push back toward the session highs.
In summary, the ES maintained its upward trajectory, closing near the upper end of the range. The combination of early Globex strength, sustained afternoon bids, and a robust MOC imbalance suggests continued bullish sentiment, though the failure to clear the early morning high of 6315.25 leaves an overhead reference point that may be revisited in the next session.
Guest Posts:
Dan @ GTC Traders
Before Robustness: The Solitary Quant Mirage with the 45° Return Series
I’ve been perusing the internet as of late. Substack threads … X / Twitter feeds and Trading communities. And I keep stumbling on the same pitch:
“I’m a quant. I’ll code you a trading program”

… followed by a glossy equity curve that rises at an almost perfect 45‑degree angle, month after month, with no drawdowns month over month. It’s seductive, especially to new and aspiring traders craving simplicity and “guaranteed” performance.
But here’s the unvarnished truth of the matter: that archetype of any such program is screaming “curve‑fit” and “overfitted” louder than any siren song to anyone with institutional experience.
What Is Curve‑Fitting?
Such programs are worthless. My short-hand phraseology is that they have ‘solved for performance’, rather what it should be … solving for robustness. A curve-fit, non-robust program means that someone has tuned every parameter to such a degree … that the backtest purrs on exactly the historical data it’s shown. Using scores of very precise parameter combinations such that it looks flawless. Perfect. In hindsight.

But here’s the rub: once you change even one parameter, say a 13‑period exponential moving average to a 15? The entire thing collapses. That Jenga‑tower effect is the hallmark of a non‑robust system. You should be able to change almost every parameter the program uses, and it still have at least some positive expectancy.
An All-In One Strategy Architect-Developer-Coder? What?
At a genuine desk or hedge fund, you won’t find one lone “Quant” designing and coding a system in isolation. Instead, you have:
-
Strategy Architects: Experts in market structure, with some gaming mathematical background, and hypothesis generation. The true professional ‘gamblers’ as discretionary traders
-
Quantitative Developers: Individuals who have access to the clean data (an entire discussion in and of itself) and can code and implement the architect’s designs. At times? It is preferable that they not know how to trade in a discretionary manner. They ‘code’ and ‘code well’.
-
Risk Service Teams: A second and third set of eyes who run in‑sample, out‑of‑sample, and stress‑scenario tests.
This triad of checks and balances exists precisely to counter cognitive biases that any one individual is subject to … overfitting chief among them. Someone who promises both strategy design and coding alone has bypassed these crucial safeguards, trading rigor for convenience … all in an attempt to ‘solve for performance’.
Beyond Historical Data: Stress‑Testing for Robustness
A robust program isn’t just one that backtests well and ‘looks good’. It’s one that:
-
Survives out‑of‑sample testing on entirely different time periods.
-
Endures synthetic stress events.
-
Maintains positive expectancy when you slightly tweak core parameters … entry criteria, risk thresholds or position‑sizing rules.
If you can swap a 13‑period MA for a 15, or adjust a volatility cap by ±5 percent, and the program still demonstrates a consistent edge, you have something robust. If not? You have a fragile system that looks good on paper but will likely blow up under real‑world uncertainty.
Why New Traders Must Understand This
New and aspiring traders deserve better than the false promise of a perfect backtest. Learning to distinguish between overfit curves and genuine robustness is critical. It’s not about eliminating research; it’s about disciplined, iterative research with rigorous validation. It’s about separating the thrill of discovery from the slog of due diligence.
What to Look for Instead:
-
Multi‑Regime Validation: What does the out-of-sample data produce? Out-of-sample need not ongoing live data as the future unfolds. But what does the program look like in periods for which it was not tested? Great. You tested it from 2016 to 2025. What does it look like if run from 1983 to 1994?
-
Parameter Sensitivity Analysis: Does it survive small changes to its core rules?
-
Transparent Team Structure: Are design and code reviewed independently?
These are not sexy buzzwords. They are the structural bones of a program that won’t collapse under the next data surprise.
A Final Word
If you see a solitary equity curve climbing at an unvarying 45 degrees, ask yourself: “Who vetted this? What happens if I tweak one dial?” The real work of quantitative trading isn’t in chasing the perfect backtest. It’s in building and validating a program that can adapt and survive … when markets inevitably surprise us.
Be skeptical. Stay curious. Trade well.
Technical Edge
Fair Values for July 10, 2025
-
S&P: 45.01
-
NQ: 189.07
-
Dow: 258
Daily Breadth Data 📊
For Wednesday, July 9, 2025
• NYSE Breadth: 52.77% Upside Volume
• Nasdaq Breadth: 74.23% Upside Volume
• Total Breadth: 72.13% Upside Volume
• NYSE Advance/Decline: 63.99% Advance
• Nasdaq Advance/Decline: 64.95% Advance
• Total Advance/Decline: 64.59% Advance
• NYSE New Highs/New Lows: 83 / 11
• Nasdaq New Highs/New Lows: 181 / 54
• NYSE TRIN: 1.55
• Nasdaq TRIN: 0.63
Weekly Breadth Data 📈
For the Week Ending Thursday, July 3, 2025
• NYSE Breadth: 68.94% Upside Volume
• Nasdaq Breadth: 64.74% Upside Volume
• Total Breadth: 66.43% Upside Volume
• NYSE Advance/Decline: 79.87% Advance
• Nasdaq Advance/Decline: 71.23% Advance
• Total Advance/Decline: 65.90% Advance
• NYSE New Highs/New Lows: 267 / 44
• Nasdaq New Highs/New Lows: 503 / 188
• NYSE TRIN: 1.70
• Nasdaq TRIN: 1.31
S&P 500/NQ 100 BTS Trading Levels (Premium Only)
BTS Levels:
ESU2025

The bull/bear line for the ES is at 6299.50. This is the key level that must be reclaimed for bullish momentum to resume. Currently, ES is trading around 6296.25, indicating price action slightly below the bull/bear line. If the price remains under this level, expect further downside pressure, targeting 6261.75 as the lower range target for today. A break below this area could extend declines toward deeper support near 6228.50.
On the upside, resistance comes in first at 6307.25, then at 6337.00, with the upper range target set at 6377.00. If ES reclaims 6299.50 and holds above, a move toward these resistance levels is likely. Sustained strength above 6377.00 would confirm a more decisive bullish tone.
NQU2025

The bull/bear line for the NQ is at 23,022.70. This is the critical level to monitor for directional bias. Staying above this line suggests bullish momentum, while trading below it increases the likelihood of further downside.
Currently, NQ is trading around 23,021.50, hovering just below the bull/bear line. This suggests the market is at a decision point, and sustained rejection under this level could lead to selling pressure.
The intraday upper range target is 23,185.50. A move and hold above the bull/bear line opens the path to test this target, with further resistance near 23,338.50.
On the downside, the lower range target is 22,860.00. Below this, further weakness could bring 22,843.50 and then 22,707.00 into play as the next areas of support. If sellers maintain pressure under 22,860.00, be prepared for deeper retracements.
Additional support is noted at 22,906.50, which could act as a first defense zone on any immediate dips. Resistance above remains near 23,112.00, which aligns with prior session highs and could provide a stall point for any rallies.
Trading Room News:
Polaris Trading Group Summary: Wednesday, July 9, 2025
How the Day Proceeded
-
The session started as Cycle Day 3, which David described as a Positive 3-Day Cycle.
-
Clear directional scenarios were laid out pre-market:
-
Bull case: Hold above 6270, targeting 6290–6295.
-
Bear case: Sustain below 6270, targeting 6255–6245.
-
-
Early action followed the bullish roadmap, as the price bid above 6270 and achieved the Initial Target Zone of 6290–6295.
-
David called out the Open Range Trifecta, with successful long targets hitting in ES, NQ, and Crude Oil (CL Open Range Short also reached Target 2).
Market Action and Positive Trades
-
The morning featured decisive follow-through to the upside, hitting the first target zones and providing multiple trade opportunities early.
-
After the initial surge, price action shifted into two-way trade and a reversal drift, eventually consolidating into a lunchtime range.
-
Afternoon Fed minutes and light volume (under 900k contracts midday) contributed to choppy consolidation until late buying.
-
Into the close, a $1.4 billion MOC buy imbalance helped push prices back higher.
Lessons and Themes
-
David emphasized preparation, quoting Bruce Lee: “Knowing is not enough, We must APPLY. Willing is not enough, We must DO.”
-
The day showcased the value of planning scenarios in advance and executing decisively when conditions confirmed the plan.
-
Later in the session, patience was again critical as initial directional momentum faded into sideways chop, requiring traders to avoid overtrading.
-
Several members discussed the humility trading demands, reinforcing the importance of discipline and adaptability.
Highlights Recap
-
Early bullish targets achieved promptly, validating pre-market planning.
-
Open Range setups in multiple instruments (ES, NQ, CL) hit their first objectives.
-
Afternoon price action required restraint as the market reversed and consolidated.
-
The day ended with renewed buying pressure supported by the MOC imbalance.
DTG Room Preview – Thursday, July 10, 2025
-
Tariffs & Geopolitics: Markets are focused on tariff threats from President Trump, who announced a 50% tariff on Brazil and warned of an additional 10% tariff on BRICS nations. India is distancing itself from BRICS efforts to challenge the US dollar as it works on a trade deal with the US.
-
Nvidia & TSMC: Nvidia (NVDA) hit a record high, briefly surpassing a $4 trillion valuation, driven by TSMC’s strong Q2 revenue ($31.9B, +38.6% YoY).
-
Elon Musk’s xAI: xAI launched Grok 4, an advanced AI model integrated with X. Musk claimed Grok 4 outperforms PhD-level knowledge, though it “may lack common sense.” Subscriptions are priced at $300/month.
-
Economic Calendar & Earnings: Weekly Unemployment Claims at 8:30am ET are in focus. Fed speakers today: Musalem (9:00am), Waller (1:15pm), Daly (2:30pm). Delta Air Lines reports Q2 earnings premarket.
-
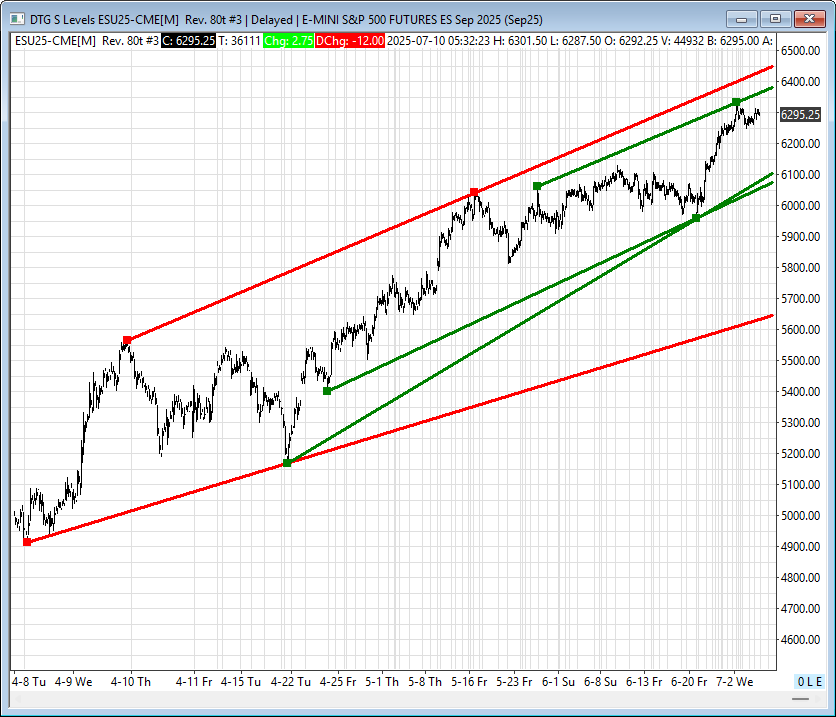
Market Levels & Sentiment: ES remains near all-time highs. Trendline resistance: 6389/92, 6437/40. Support: 6095/98, 6065/70, 5643/48. Volatility steady with a 5-day ADR of 55 points. Whale bias slightly bullish into the Claims report on light overnight volume.
Calendars
Economic Calendar Today

This Week’s High Importance

Earnings:

Released

Affiliate Disclosure: This newsletter may contain affiliate links, which means we may earn a commission if you click through and make a purchase. This comes at no additional cost to you and helps us continue providing valuable content. We only recommend products or services we genuinely believe in. Thank you for your support!
Disclaimer: Charts and analysis are for discussion and education purposes only. I am not a financial advisor, do not give financial advice and am not recommending the buying or selling of any security.
Remember: Not all setups will trigger. Not all setups will be profitable. Not all setups should be taken. These are simply the setups that I have put together for years on my own and what I watch as part of my own “game plan” coming into each day. Good luck!
This post goes out as an email to our subscribers every day and is posted for free here around 2 PM ET. To get your real-time copy, sign up for the free or premium version here: Opening Print Subscribe.
Comments are closed