This post goes out as an email to our subscribers every day and is posted for free here around 2 PM ET. To get your real-time copy, sign up for the free or premium version here: Opening Print Subscribe.
The S&P And Trump’s New China Tariff Threats
Follow @MrTopStep on Twitter and please share if you find our work valuable!
Our View
The ES traded all the way up to 6008.00 on Globex and then sold off down to 5945, traded 5956.25, went straight down to 5911.50 at 10:13, bounced and then sold off down to 5884.00—124 points off its high. Like I said, this is going to be this way for the next 1,329 days. Can you imagine what this is going to look like?
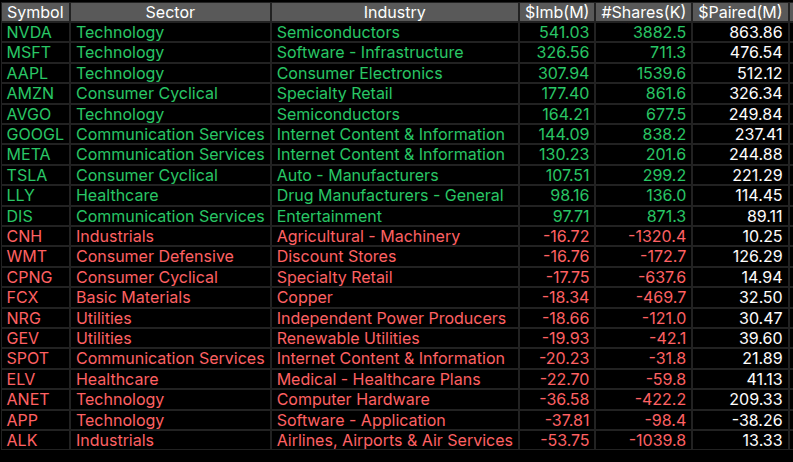
To be honest, while Trump’s headlines are a disrupter and all part of shock-and-awe headlines, the pension funds were working a $20+ billion rebalancing—buying bonds and selling stocks.
After a few pops, the ES traded back down to the 5900 area, rallied, and a headline hit at 3:07 PM saying: US Appeals Court reinstates Trump tariffs during appeal, and the ES sold off a little. You can sell the rebalancing, but it feels like everyone is short and just traded down to the 5906 level. It’s been a long time since I have seen such narrow chop.
The MiM came out at $4.7 billion to buy, the ES popped up to the 5930 level and settled at 5917.25, up 14.50 points or +0.25%. The NQ settled at 21,385.00, up 5.25 points or +0.02%. Like nothing ever happened. Companies in the S&P 500 have reported roughly 13% first-quarter profit growth so far this earnings season, according to FactSet.
I disagree with Trump going after China again. He is threatening to revoke the visas of 280,000 Chinese students and suspend sales of some critical U.S. technologies, including those related to jet engines, semiconductors, and certain chemicals and machinery.
I think he should stick to his May 12, 2025 deal—the U.S.-China agreement to reduce tariffs on each other’s goods for 90 days. This agreement lowered tariffs on Chinese goods from 145% to 30%, while China reduced its tariffs on U.S. goods from 125% to 10%. The 90-day pause is intended to allow for further negotiations between the two countries, but Trump can’t keep his mouth shut, and this is why things will remain volatile.
As I was writing this, a headline hit saying U.S. Treasury Secretary Scott Bessent said on Thursday night that trade talks with China are “a bit stalled,” and getting a deal over the finish line will likely need the direct involvement of President Donald Trump and Chinese President Xi Jinping.
This is what I call “CNW”—crazy, nuts, and wild!
Our Lean
Jeez, you know how I always say everything is moving? Well, it really is—and it feels like a giant spinning top that’s about to explode. NFLX was down almost $25.00, UBER fell 3.96, NVDA closed up $4.38 at $139.19, just under the $140 support level. Gold closed up $30.00, Bitcoin jumped 1.99%, oil fell 1.5%, and the yield on the 10-year note has fallen for four of the past five sessions, closing at 4.423%.
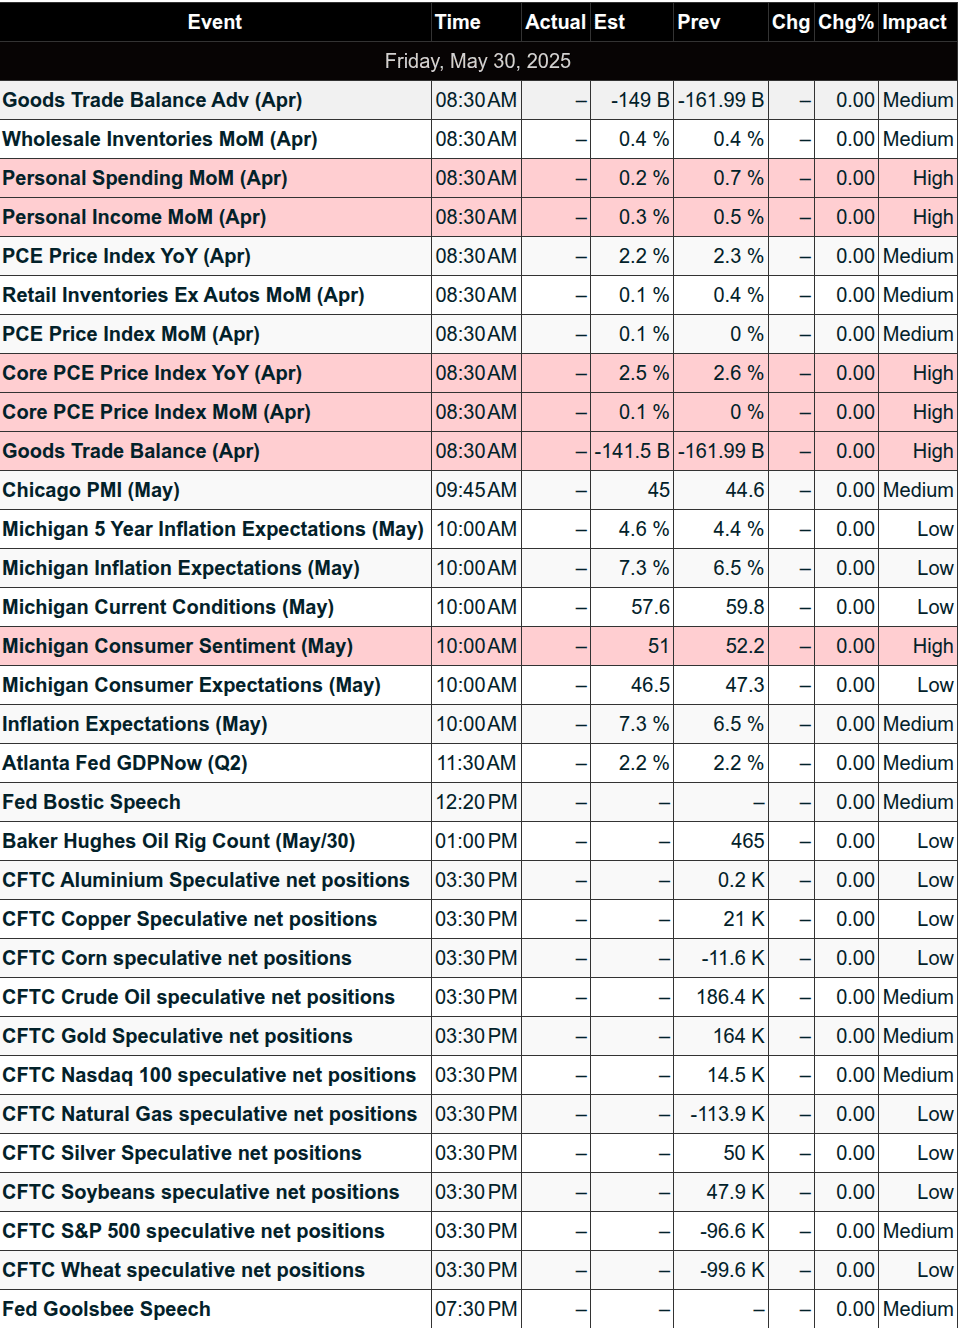
Today is the last trading day of May, and it’s packed with six economic reports, including the PCE number, which is expected to remain relatively steady, with a 0.3% monthly increase, mirroring the previous two months. There’s also an after-the-close speech by San Francisco Fed President Mary Daly.
The ES did bounce off its lows, but I think there’s a good chance some of the pension rebalancing is still around. My guess is that a lot of the $20 billion has already been executed. I think the selloff is simple math—it rallied 120 points from Wednesday’s late-day low, and it went up too much, too fast. As of yesterday’s close, the ES is up 5.59% YTD. The ES and NQ are on pace for their biggest monthly gains since November 2023.
Our lean: I think the main events today are the PCE number, end-of-quarter rotation, Friday’s options expiration, and Trump’s headlines. In most cases, after a big dump, the ES rallies on Globex. The PCE number is going to be a big part of the day’s trade. My gut says we bounce, but keep an eye out for remnants of yesterday’s buy-bonds-sell-ES rotation. PitBull bought calls late yesterday; we shall see.
The 50% retracement from the 6008.00 high to yesterday’s 5884.00 low is 5946.00. The 61.8% is 5931.37, 38.2% is 5960.67, the 23.6% is 5978.74, and the 78.6% is 5910.54.
Support levels: 5895.35 (5-day MA), 5888.37 (200-day MA), 5882.00, 5877 (low end of range), 5837.25 (20-day MA), 5824.74, 5818.54 (100-day MA)
MiM and Daily Recap
The S&P 500 futures (ES) saw a mixed session on Thursday that began with bullish momentum overnight but reversed sharply lower through the regular session.
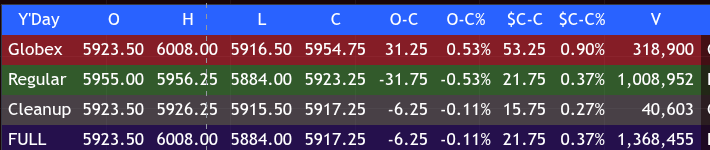
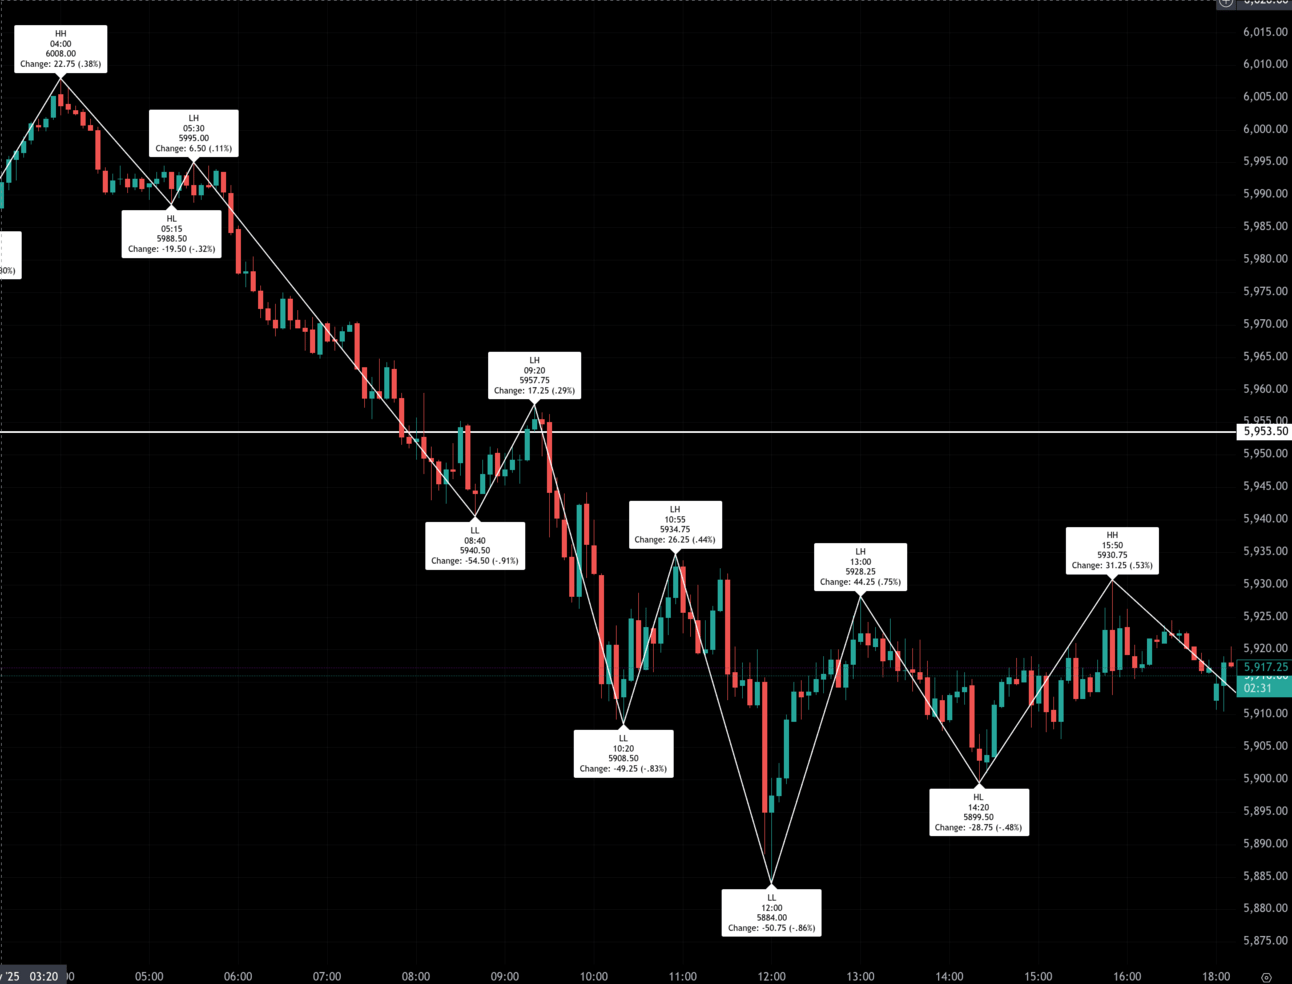
The Globex session opened at 5923.50 and climbed to a high of 6008.00 by 04:00 ET, marking the session’s peak. Selling pressure followed, taking ES down to 5950.50 by 05:30 and then a lower high of 5955.00 at 06:10. The decline accelerated into the U.S. morning, hitting a premarket low of 5940.50 at 08:48. A brief bounce carried prices up to 5957.75 by 09:06, but the recovery was short-lived as ES dropped hard into the regular open.
The cash session opened at 5955.00 at 9:30 ET and was immediately met with selling. ES plunged to 5903.25 by 09:46 and extended losses into midday, reaching the session low of 5884.00 right at noon—marking a 71.75-point decline from the Globex high.
A recovery phase followed, as ES bounced 44.25 points to 5928.25 at 13:00. The rally stalled and reversed into 5899.50 by 14:40 before a final late-day push brought the index back to 5931.25 at 15:50. The session settled at 5923.25 at the 4:00 PM bell.
The regular session closed down 31.75 points from the open (-0.53%) but up 21.75 points from Wednesday’s close (+0.37%). Including the cleanup hour, the full session ended at 5917.25.
Market Tone & Notable Factors
The market displayed a bearish-to-neutral tone, with the majority of the downside damage occurring in the first half of the regular session. After printing a new weekly high at 6008.00 in Globex, ES faced a swift reversal as month-end volatility and potential pension rebalancing weighed on equities.
Volume was notably strong during the day, with 1,008,952 contracts traded during the regular session, suggesting active institutional participation.
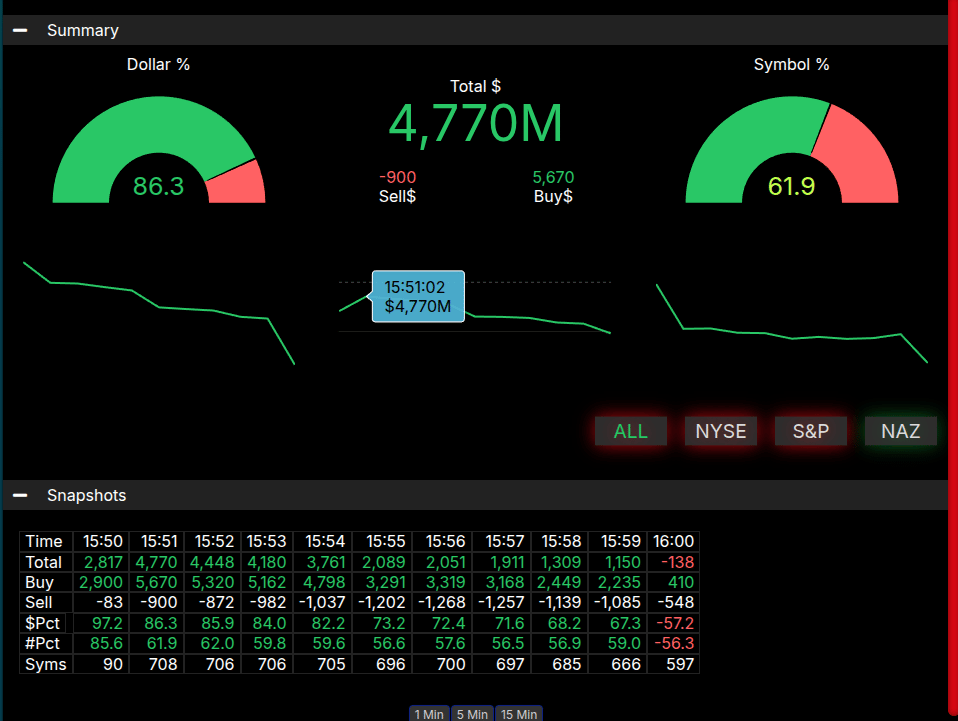
The Market-on-Close (MOC) imbalance skewed sharply bullish, with 86.3% of notional flow ($4.77B total) on the buy side and a symbol imbalance of 61.9%, approaching the notable threshold. This late-session buying helped lift ES off its lows and supported a stabilizing close.
Despite intraday volatility, the recovery into the final hour helped contain losses and maintain a net gain for the session overall. Still, the inability to sustain levels above 5950 after the overnight run suggests profit-taking ahead of the key PCE inflation release.
With the month-end dynamic fading and economic data in focus, bulls will need to reclaim the 5950–5960 zone to regain control. Otherwise, the market remains vulnerable to further backfilling, especially if inflation surprises to the upside.
Technical Edge
Fair Values for May 30, 2025
-
SP: 11.52
-
NQ: 48.36
-
Dow: 66.82
Daily Breadth Data 📊
For Thursday, May 29, 2025
-
• NYSE Breadth: 61% Upside Volume
• Nasdaq Breadth: 68% Upside Volume
• Total Breadth: 67% Upside Volume
• NYSE Advance/Decline: 68% Advance
• Nasdaq Advance/Decline: 59% Advance
• Total Advance/Decline: 61% Advance
• NYSE New Highs/New Lows: 56 / 18
• Nasdaq New Highs/New Lows: 86 / 88
• NYSE TRIN: 1.58
• Nasdaq TRIN: 0.67
Weekly Breadth Data 📈
Week Ending Friday, May 23, 2025
-
• NYSE Breadth: 39% Upside Volume
• Nasdaq Breadth: 50% Upside Volume
• Total Breadth: 46% Upside Volume
• NYSE Advance/Decline: 19% Advance
• Nasdaq Advance/Decline: 34% Advance
• Total Advance/Decline: 28% Advance
• NYSE New Highs/New Lows: 156 / 97
• Nasdaq New Highs/New Lows: 312 / 244
• NYSE TRIN: 0.36
• Nasdaq TRIN: 0.49
Guest Posts:
Get instant access to our partners’ real-time market data and insights not available anywhere else. Here is last night’s Founder’s note getting you ready for today’s market and explaining the constraints in yesterday’s market. – MrTopStep
Founder’s Note:
Futures are flat at 5,905 – there is that JPM call strike again – with PCE at 8:30 AM ET.
TLDR: If PCE is a non event, we assume traders will squeeze vol lower – particularly into the weekend. Although this was our view last week too – before Trump took to afternoon tweeting about EU tariffs. At the end of the day we have to lean to upside when the SPX is >5,905. Our favored way to express this is through short dated call spreads or call flies which play moves into 6k. To the downside we also want to keep owning tails via >=1-month puts.
The 0DTE SPX straddle is $42/71bps/27% IV (ref 5,905) – which “ain’t much” given that SPX realized vol is 16.5% for 1-month and 19.6% for 5-day. Historically the VIX holds a 3.5pt premium to 1-month SPX – so we’d say fair value for VIX is ~20. The VIX is now at 19, and so that seems pretty fair…right?
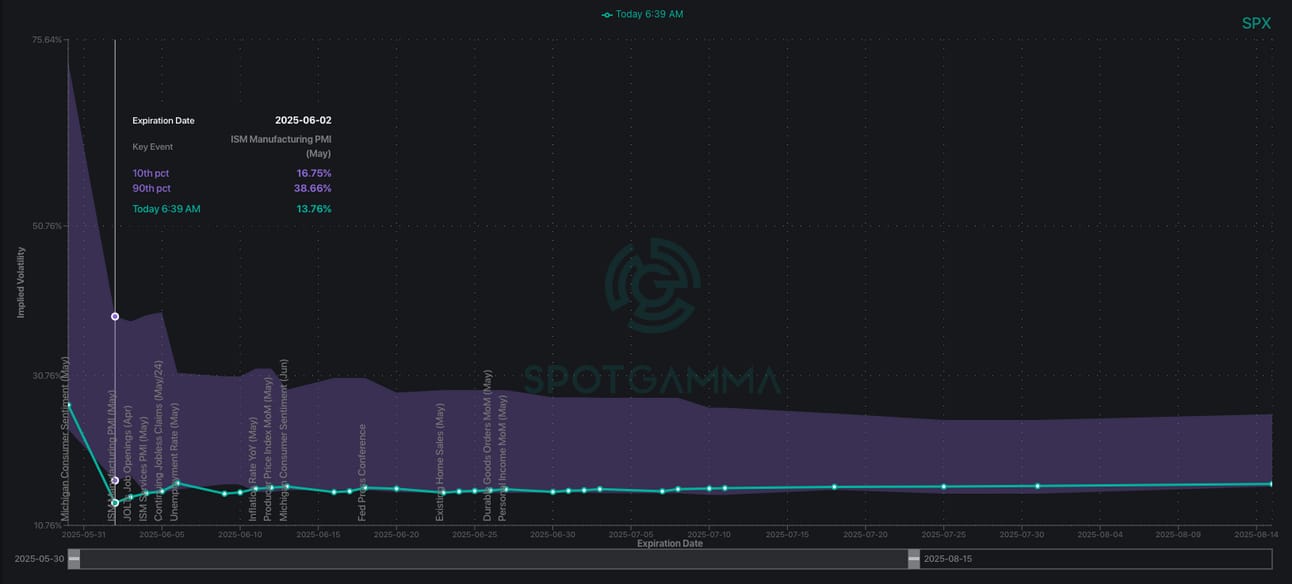
If you look out at SPX term structure we see ATM vols at 90-day lows near 15%, with Monday a quaint 13%. “Priced for perfection” is how we’d describe this.
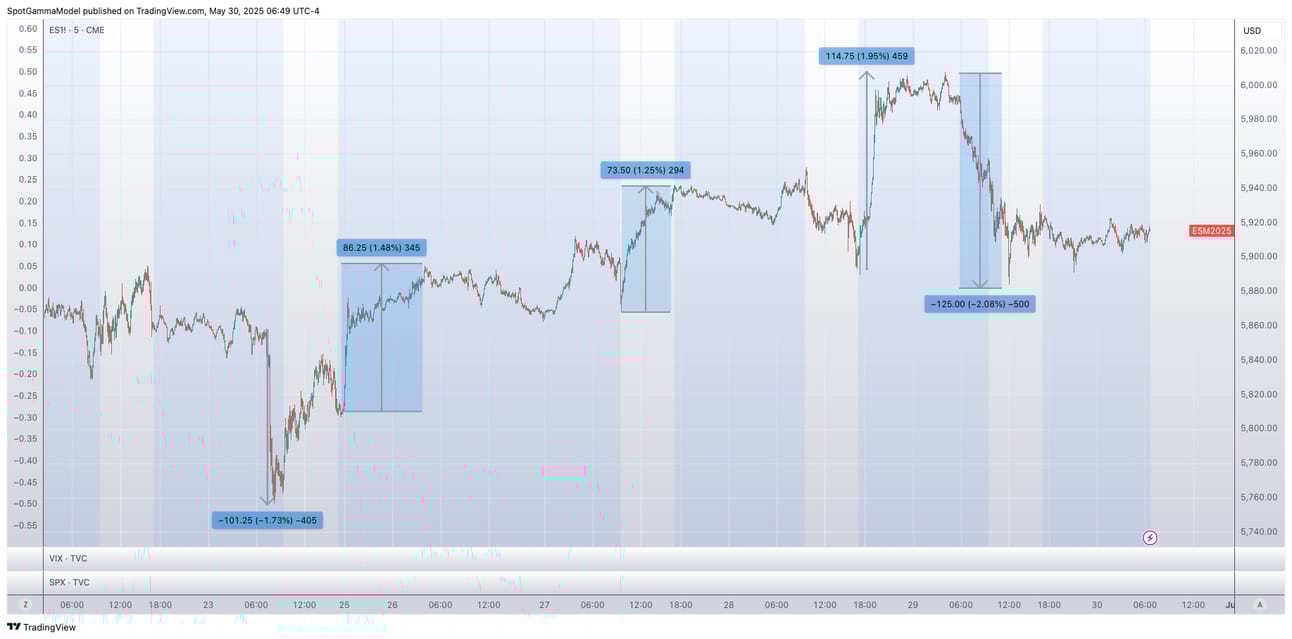
Below is the ES futures movement over the last 5 days. Each day has had at least a 1.25% move, with moves as large as 2%. 1.25% = ~19% IV, and 2% moves = ~24% IV. Those two figures only equate to how much the SPX has been moving – and does not include any vol premium!
Shouldn’t we have some vol premium?
I know we keep complaining about the serially low priced vol – but (I think) we continue to be proven right on this point as per just whats happened over the last 24-48 hours (i.e. the 2% “pop & drop” on the Federal tariff rulings). If the market wants to keep underpricing vol then we will keep wanting to own the tails (both higher & lower).
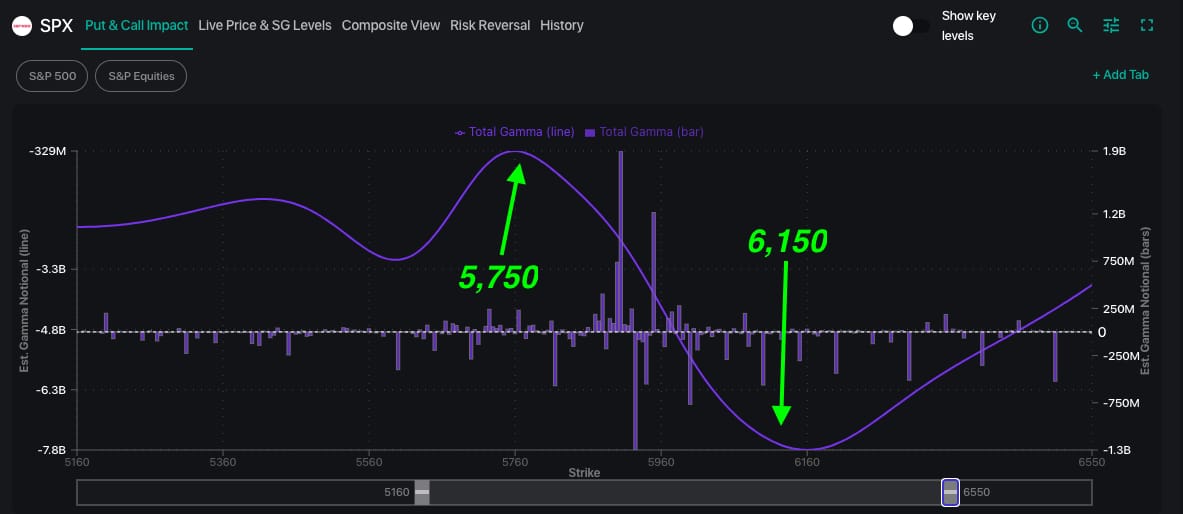
One could make the argument that IV may be lower because the SPX positioning isn’t too stressed. To the downside we see a build in positive gamma into 5,750. Its not a huge amount of positive gamma – but it speaks to a lack of traders being long puts. To the upside, you can see the curve gets quite negative into 6,150 suggesting that the chance of an upside dealer chase is something to keep in mind.
We would note that SPY continues to show a fair number of traders long puts, and that gives some more potential downside into 5,500 – but largely this market is not holding lots of long puts (dealers short). Until/unless we see material negative gamma to the downside then we will be looking to more quickly monetize downside movement vs looking for new equity lows.
Get instant access to our partners real-time market data and insights not available anywhere else. Here is last night Founder’s note getting you ready for today’s market and explaining the constraints in yesterday’s market. – MrTopStep
Trading Room News:
Polaris Trading Group Summary – Thursday, May 29, 2025
Yesterday’s trading session was driven by textbook execution of the Daily Trade Strategy (DTS) levels with precision on both the upside and downside in $ES and $NQ. PTGDavid guided the room through several profitable opportunities, emphasizing risk discipline, pattern recognition, and patience in an overall sell-biased market.
Key Market Developments:
-
Overnight Action:
-
$ES fulfilled the upper DTS target of 6005 before reversing to test the key 5950 “Line in the Sand.”
-
$NQ also hit and exceeded its target at 21776 before pulling back.
-
Both moves were framed within EoM “Window Dressing” activity.
-
Morning Session Highlights:
-
Bearish Lean Confirmed:
-
Open Range shorts were called in both $CL and $NQ.
-
$ES bearish scenario played out perfectly—price broke below 5950 and tagged 5930 (downside DTS target) with precision.
-
A sharp 10-handle bounce from 5930 provided a quick counter-trade opportunity.
-
$CL downside targets also fulfilled cleanly.
-
-
Further Downside Action:
-
$ES hit 5909 and then ultimately reached the open downside target of 5890, reinforcing the power of DTS levels.
-
PTGDavid noted 5914 had fulfilled the Cycle Day 1 average decline, confirming broader structure.
-
Midday to Afternoon:
-
Reversal and Caution:
-
Post-5890 test, the market saw a strong reversal.
-
Afternoon trade was characterized as “choppy”, with PTGDavid advising traders to protect morning gains and avoid overtrading.
-
Price coiled with sellers defending bounces. Bulls managed to hold the 5900–5910 zone multiple times.
-
-
Fed Speaker & News Impact:
-
At 2 PM ET, Fed’s Kugler spoke; volatility picked up with “sticky wicks” dominating.
-
Late-breaking headline: U.S. Appeals Court reinstates Trump tariffs—added uncertainty.
-
End of Day (EOD):
-
Late Session Drama:
-
Bulls successfully held 5900 but struggled to push above the 5925–5930 breakout zone.
-
Despite attempts, market remained range-bound with shorts defending VWAP.
-
A massive MOC buy imbalance of $4.7 billion added a bullish skew into the close.
-
Positive Trades & Lessons Learned:
✅ Precision Execution: DTS targets hit both directions—6005 upside and 5890 downside—underscoring the strategy’s reliability.
✅ Open Range Shorts: $CL, $ES, and $NQ yielded multiple solid opportunities with clean fulfillment of short-side objectives.
✅ Discipline Over Noise: Emphasis on not chasing reversals and avoiding “pushing on a string” in the afternoon chop paid off.
✅ Contextual Awareness: Effective use of macro cues (tariffs, Fed) and price structure (Cycle Day 1 expectations).
Key Takeaways:
-
Stick with the plan and trust the strategy—today’s DTS roadmap was extremely accurate.
-
Be flexible: opportunities existed both with trend and in quick reversals, but discipline mattered most.
-
Guard your gains—especially post-lunch, when action gets noisy and less predictable.
DTG Room Preview – Friday, May 30, 2025
-
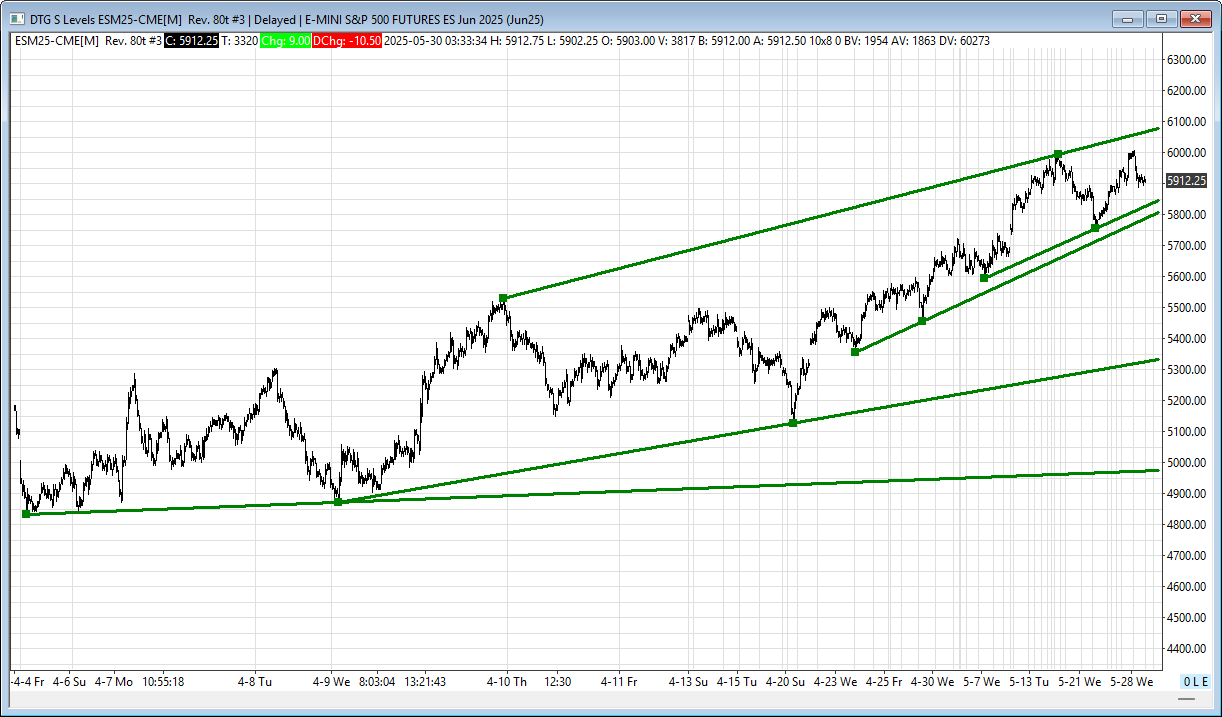
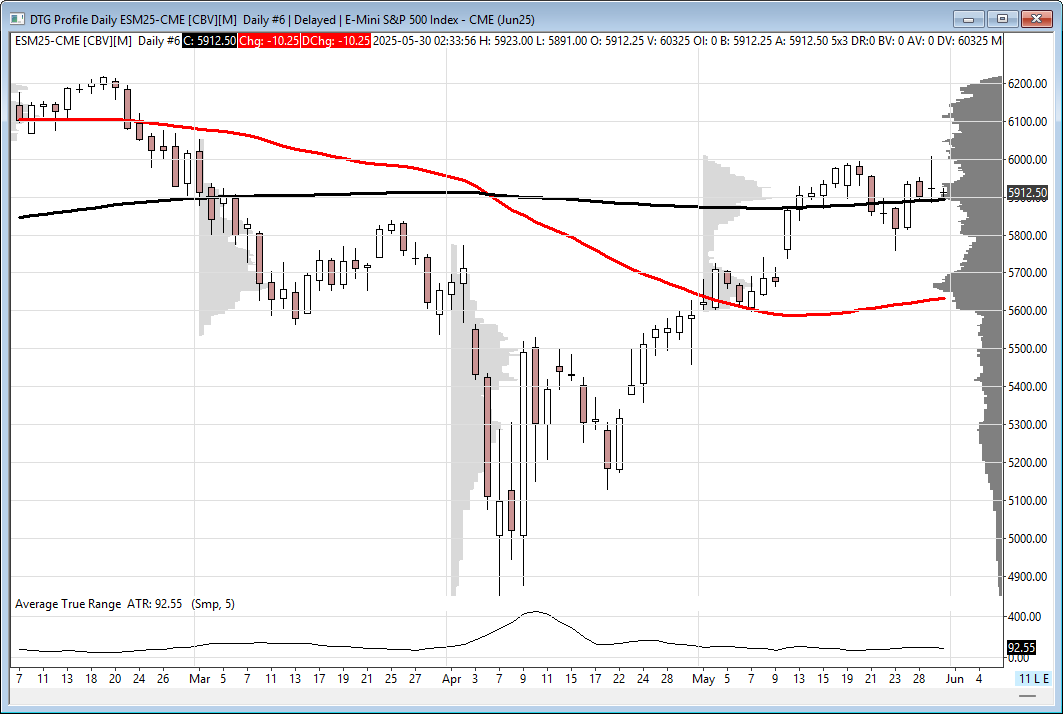
Levels to Watch: Key ES support remains at the 200-day MA (5893.50). Potential resistance at 6078/83, support at 5833/38, 5794/99, 5333/38, and 4975/80.
-
Volatility: Elevated, with a 5-day average daily range of 99.5 points, reflecting ongoing tariff and policy uncertainty.
-
Macro Focus: Core PCE Price Index at 8:30am ET is the main event, alongside data on personal income/spending, trade balance, and Chicago PMI. UoM Consumer Sentiment and Inflation Expectations out at 10:00am ET.
-
Fed Watch: Speech from Atlanta Fed’s Bostic at 12:20pm ET.
-
Trade & Tariffs: Tariff tensions persist as a court allowed Trump-era tariffs to remain temporarily. Talks with China are stalled, adding pressure to already struggling import volumes—Port of LA reports double-digit declines in May.
-
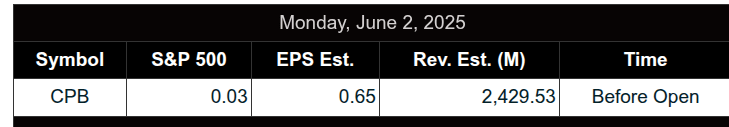
Earnings: No notable corporate reports today.
-
Market Sentiment: No clear whale bias; light overnight volume suggests a wait-and-see approach from large traders.
ES
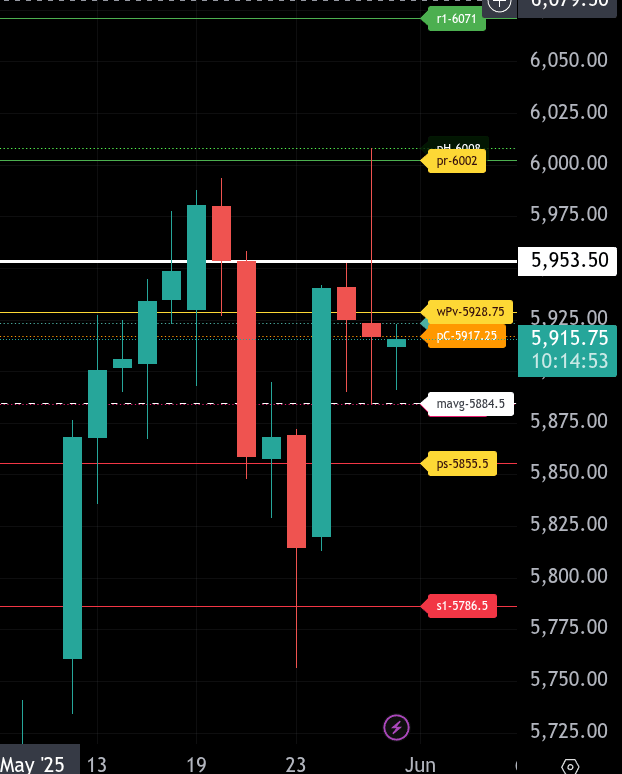
The bull/bear line for the ES is at 5928.75. This level marks the key pivot for directional bias today. As long as ES remains below this line, sellers retain the edge. A move back above and hold could shift momentum to the upside.
Currently, ES is trading around 5916.25, indicating it is below the bull/bear line and showing early session weakness. The lower intraday range target is 5855.50, and if selling pressure persists, we could see a push toward that level. Below 5855.50, stronger support sits down at 5786.50, which would be a deeper test of the broader range.
On the upside, a reclaim of 5928.75 would target the 6002.00 level, which serves as today’s upper range target. A breakout through there would open the door for a move toward 6071.00, with minor resistance at 6008.00.
Additional support lies near 5884.50, the moving average level on the chart, which could offer a short-term bounce zone if tested. Holding above that level could keep the tape from accelerating lower.
In sum, ES remains vulnerable under 5928.75. Bulls must reclaim that level for a push toward 6002.00. Bears maintain control below it, with 5855.50 and 5786.50 as key downside zones.
NQ
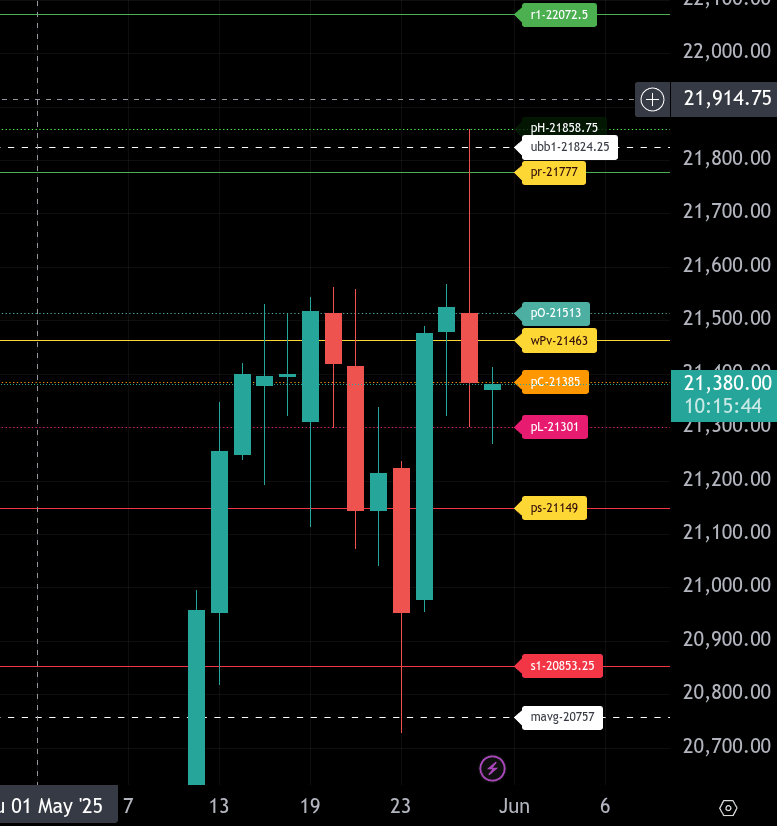
The bull/bear line for the NQ is at 21,463.00. This is the critical pivot level for today’s session. Sustained action above this level favors buyers, while remaining below it points to continued downside pressure.
Currently, NQ is trading near 21,380.80, indicating weakness below the bull/bear line. If the index cannot reclaim and hold above 21,463.00, the path of least resistance remains to the downside. Immediate support sits at 21,385.00, followed by 21,301.00. A break below 21,301.00 would open the door to the lower range target of 21,149.00.
If buyers can regain control and push above 21,463.00, we could see a move toward resistance at 21,513.00, then 21,777.00, the upper range target. Holding above this could trigger a rally toward the broader resistance zone around 21,824.30 to 21,858.80.
For now, the tone remains bearish under 21,463.00, and any bounce into that area should be viewed cautiously unless bulls can demonstrate control with volume and follow-through.
Calendars
Economic Calendar Today
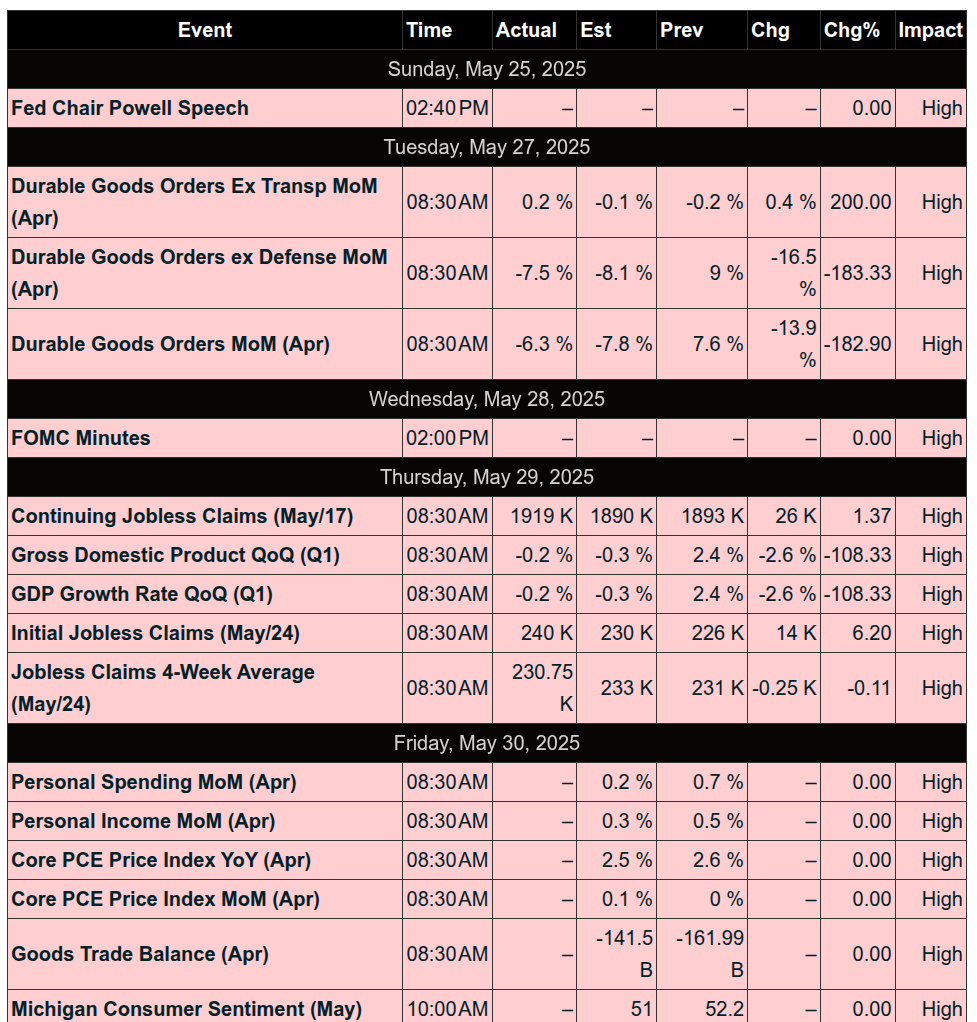
This Week’s High Importance
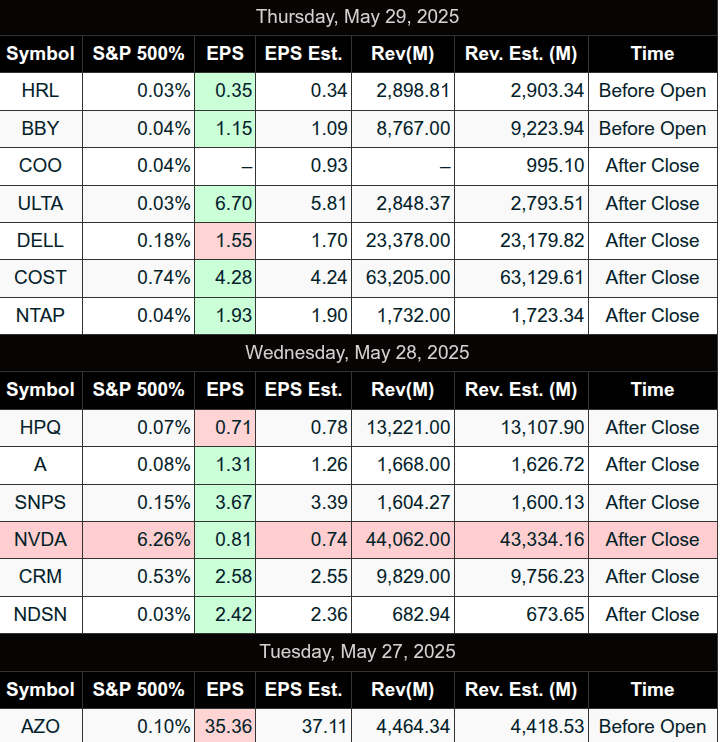
Earnings:
Affiliate Disclosure: This newsletter may contain affiliate links, which means we may earn a commission if you click through and make a purchase. This comes at no additional cost to you and helps us continue providing valuable content. We only recommend products or services we genuinely believe in. Thank you for your support!
Disclaimer: Charts and analysis are for discussion and education purposes only. I am not a financial advisor, do not give financial advice and am not recommending the buying or selling of any security.
Remember: Not all setups will trigger. Not all setups will be profitable. Not all setups should be taken. These are simply the setups that I have put together for years on my own and what I watch as part of my own “game plan” coming into each day. Good luck!!
Follow @MrTopStep on Twitter and please share if you find our work valuable!
This post goes out as an email to our subscribers every day and is posted for free here around 2 PM ET. To get your real-time copy, sign up for the free or premium version here: Opening Print Subscribe.
Comments are closed