There Are Several Major Focuses This Week
Keep an eye on NVDA
Follow @MrTopStep on Twitter and please share if you find our work valuable!
Our View
There are no scheduled economic reports or Fed speak today. Now that the jobs report is out of the way, the focus will be on NVDA today, which just went through with its 10-for-1 stock split.
The rest of the week there are 9 economic releases and the Fed’s two-day meeting. It’s not the quantity of the economic reports this week, but the importance of three key data points: CPI and Powell’s press conference on Wednesday at 2:30, and PPI on Thursday.
I don’t think there is a lot to say that we don’t already know. Today should be slower, but things should pick up Tuesday.
Our Lean
Friday saw some early and late end-of-the-month rebalancing. This goes along with the ES tending to close in the direction it starts out. If anyone thinks the ES is going to go straight up without pullbacks, you are missing one thing; it’s called back-and-fill and it was doing it for two solid weeks.
What the bears wanted to see and didn’t get was a selloff of 50 or 60 points and do the same thing for a few days, but that’s not what happened. Instead, they would drop 50 or 60 points and then recover half the loss — if not more.
Our Lean: Volume has fallen from a high of over 2.3 million a day to down to 1.2 million a day that should mean we drift higher. I can’t rule out selling a rip, but ideally when volume is low it’s best to buy the pullbacks.
For what it’s worth, I found this piece by Goldman Sachs worthwhile.
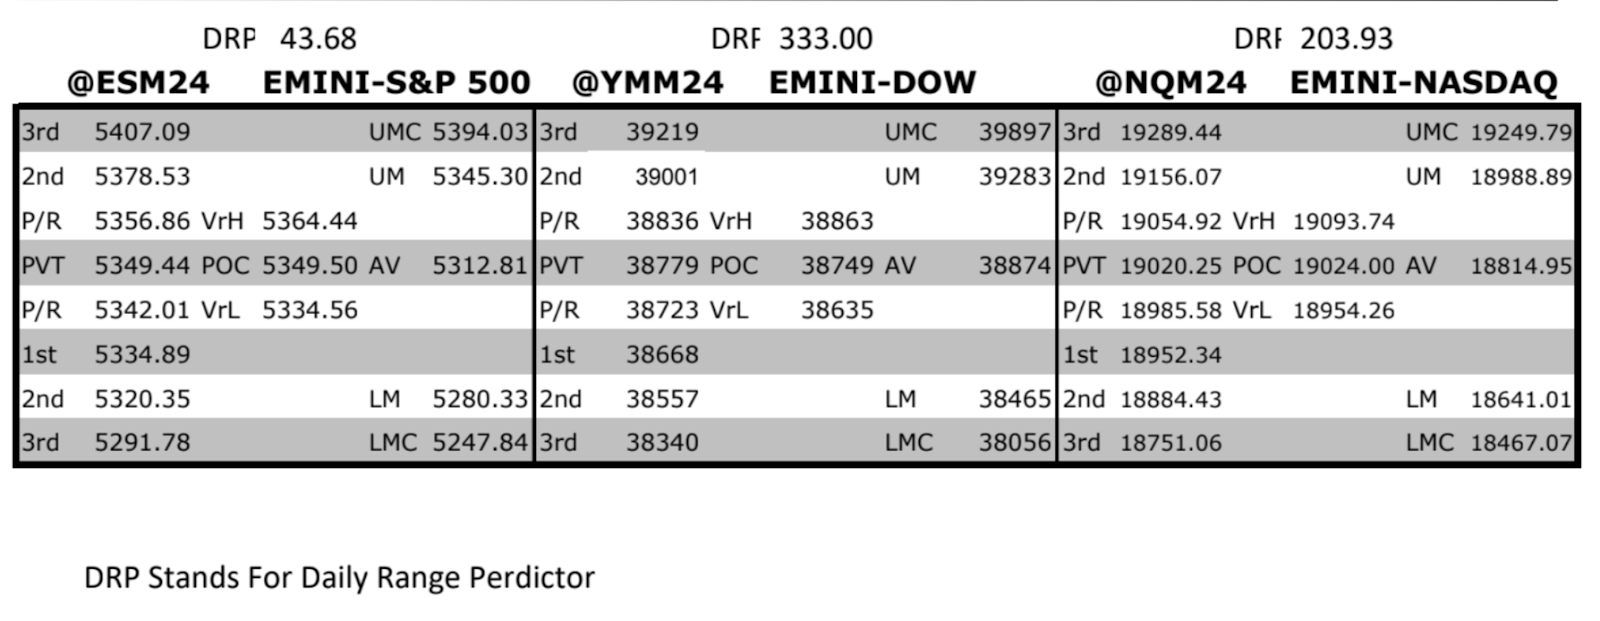
MrTopStep Levels:
MiM and Daily Recap
ES recap
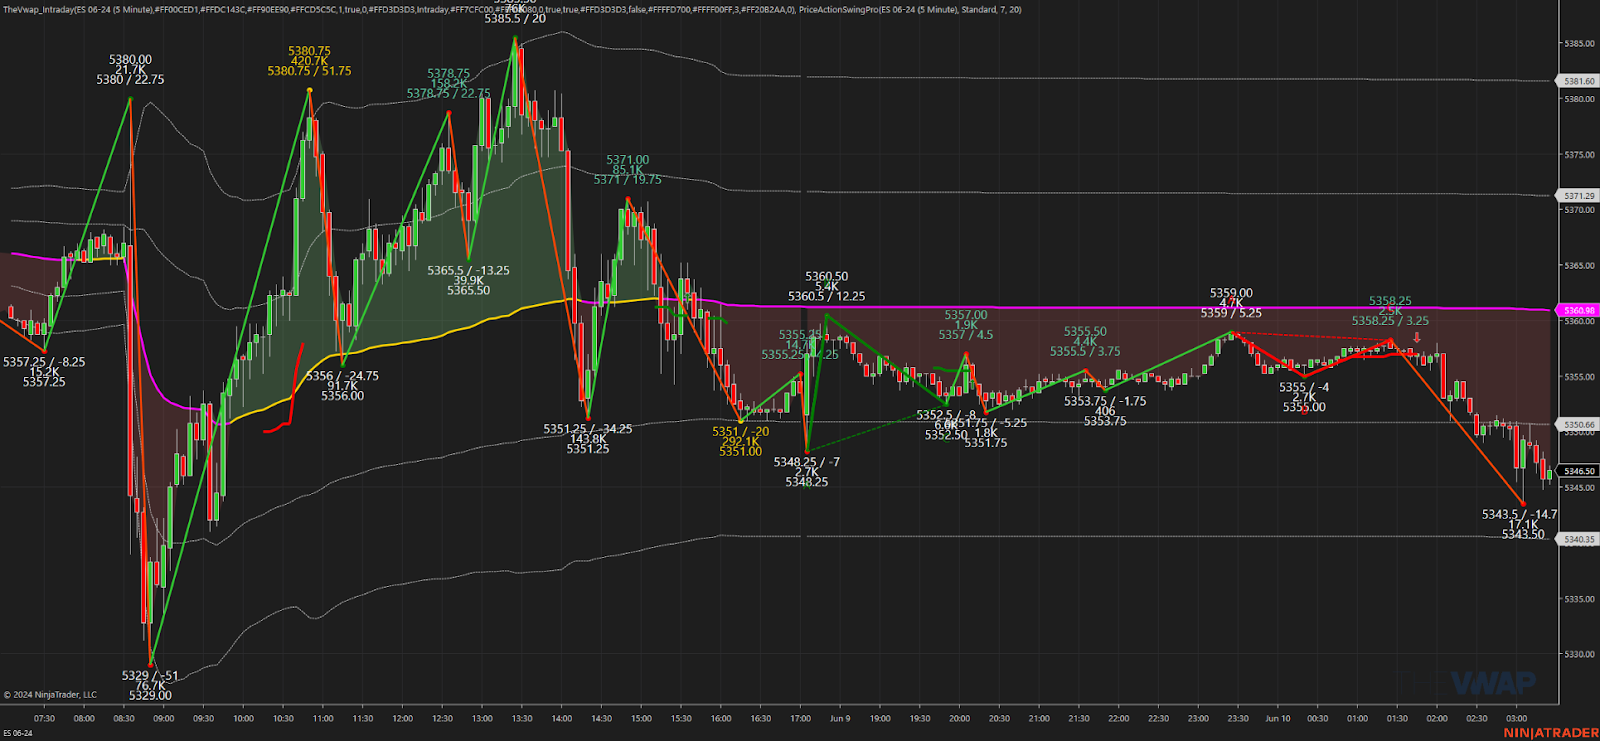
The ES made a new high at 5373.50 on Globex and quickly traded up to 5380 after the May jobs report showed a total gain of 272k jobs, higher than expectations. The ES then dropped 41 points down to 5339.00, rallied back up to 5353.25 at 9:20 and opened Friday’s regular session at 5352.50.
After the open, the ES traded 5352.75, sold off down to 5343.00, then rallied up to 5359.50 at 9:53, pulled back to 5341.00 and then rallied all the way up to the Globex high at 5380.75 at 11:47, up 51.75 points off the low with a total of 51.75k contracts traded from low to high. After the high, the ES sold back down to down to 5156.00 — a 24.75 point drop — and then rallied back up to a lower high at 5378.75 at 12:35 and then sold off down to 5363.50 at 12:50 and then rallied up to 5385.50 at 1:23. From there, it pulled back to the 5375 area, traded up to a lower high at 5380.75 and sold off down to 5351.25 at 2:20 as several ECB headlines hit the tape about the path to 2% inflation won’t be an entirely smooth move.
After the low, the ES rallied back up to 5371.00 at 2:48 and sold back down to 5354.25 at 3:25 as the bonds made new lows, down 1.28 points. Some small ES and NQ buy imbalances showed up and pushed the ES back up to 5365.00 at 3:33 and then pulled back to 5356.75 at 3:47. The ES traded 5354.50 as the 3:50 cash imbalance showed over $3 billion to sell, traded down to 5351.00 and settled at 5353.50, down 9.75 points or 0.18%. The NQ settled at 19,030.25, down 39.25 points or -0.21%, the 10 yr note settled at 109’085, down 1.030 points or 0.99%, gold settled at 2,311.10, down 79.8 points or -3.34%, crude oil settled at 75.38, down 0.17 or -0.23% and Bitcoin of the July contract settled at 70,215, down 1,370 points or -1.91% on the day.
In the end, the ES and NQ followed NVDA all day. In terms of the ES’s overall tone, the price action was firm. In terms of the ES’s overall trade, volume was higher, with 1.228 million total contracts traded.
Technical Edge
-
NYSE Breadth: 25% Upside Volume
-
Nasdaq Breadth: 42% Upside Volume
-
Advance/Decline: 27% Advance
-
VIX: ~13
Guest Post — Michael Berman, Ph.D. @signal2noise.news
Portfolio Backtesting = Robustness
Before I discuss the subject of today’s post allow me to provide some background.
Since 2012 I have been allocating capital to emerging and experienced traders. The approach I have used has been the use of a proprietary scoring method which acted as a filter for choosing who to invest in, and then a robust money management programme for efficient capital allocation and risk management. I seeded more than 250 traders with more than $200 million of capital over this period.
I also founded and ran a risk and profit analysis platform which included the first robo-trading coach. We analysed more than 100,000 trading accounts in our database, so I feel like I know a little bit about assessing trading talent and identifying edge(alpha).
Allocating to Backtested Returns
Over the years I have been fed a constant stream of amazing backtest trading strategy reports. These people filled with great expectations think that they are worthy of serious dollar allocations to trade.
I have never allocated a dollar to backtested strategies where the trader cannot provide at least a year of actual trades with real money to back up the backtest. I am not saying these people are not working hard and perhaps have found something very worthwhile, sadly in the real investment world it isn’t enough for good reason.
For those of you who don’t know what a backtest is, it is a simulation where a set of rules run through price data and calculate what the returns would be if those rules were followed. You can run a complex backtest over 30 years of data in 1 second with the click of a button. No real money is involved. No fear or greed is involved. No patience or resilience is involved. No confusion or certainty is involved. No happiness or sadness is involved.
Anyone who has traded with real money knows that one goes through a host of emotions when trading real money which no backtest can factor in.
However, there is one characteristic of backtesting that almost all traders fall prey to. This is the habit of constantly optimizing the backtest to make it look good on paper with the benefit of hindsight. Let me give you an example of what they call in the industry “curve-fitting”.
Example: Curve-fitting
Let us say you are trading a strategy where you buy a stock when it is above its moving average and sell it when it is below its moving average. You run a backtest over 5 years of data with a 50-day moving average and it loses money. So, you try again this time you use a 30-day moving average, it is now making money. You try again this time with 20-days, and it is a little worse, so you think I need to find a parameter between 20 – 30 days. You do some trial and error and you come up with 26.5 days as the best moving average for the trading strategy.
The problem with the above scenario is that you have no real idea why 26.5 days was the magic number, it just worked well with the symbol in question over 5 years of data. It is quite possible that it would look totally different on multiple symbols or over a longer period than 5 years.
How much data?
I find inexperienced and sometime experienced traders fall into the trap of insufficient data, which is another form of curve-fitting. I hear people asking where they can buy or download 3 years of tick data. These people who are trading medium to long term strategies are looking in all the wrong places. There is one thing I can assure you that is characteristic of all markets. Markets are subject to regimes, periods of trending, oscillating, volatility, quiet periods, etc.
Most strategies don’t work in all regimes and its incredibly difficult, perhaps impossible to identify when a regime is changing until well after the fact.
This is why I encourage people to forget about tick data, rather spend your money or time getting longer data time series to backtest your strategies across multiple regimes. For example, if you have a trend strategy and the 3 years of data you are using is during a bull trending market then of course your backtest will look great. But you don’t know if the market is about to change from a bull trend to bear trend. That is why the more data you use the more robust your strategy will be as is more likely to have a number of regimes in the data series and you then get to see how your strategy performs in different market regimes.
Single Symbol versus a Portfolio of Symbol Backtest
There are some traders who only trade one symbol and one strategy. If this is your approach, then what I am going to say next will have limited application. I do wish to say that be very careful with trading only one symbol and strategy as there will be very lengthy periods of losing money that will put enormous strain on you emotionally and financially. I therefore recommend diversifying a strategy across a number of symbols to test for robustness. My ideal strategy will make money across a number of symbols over most periods. Let’s dive in:
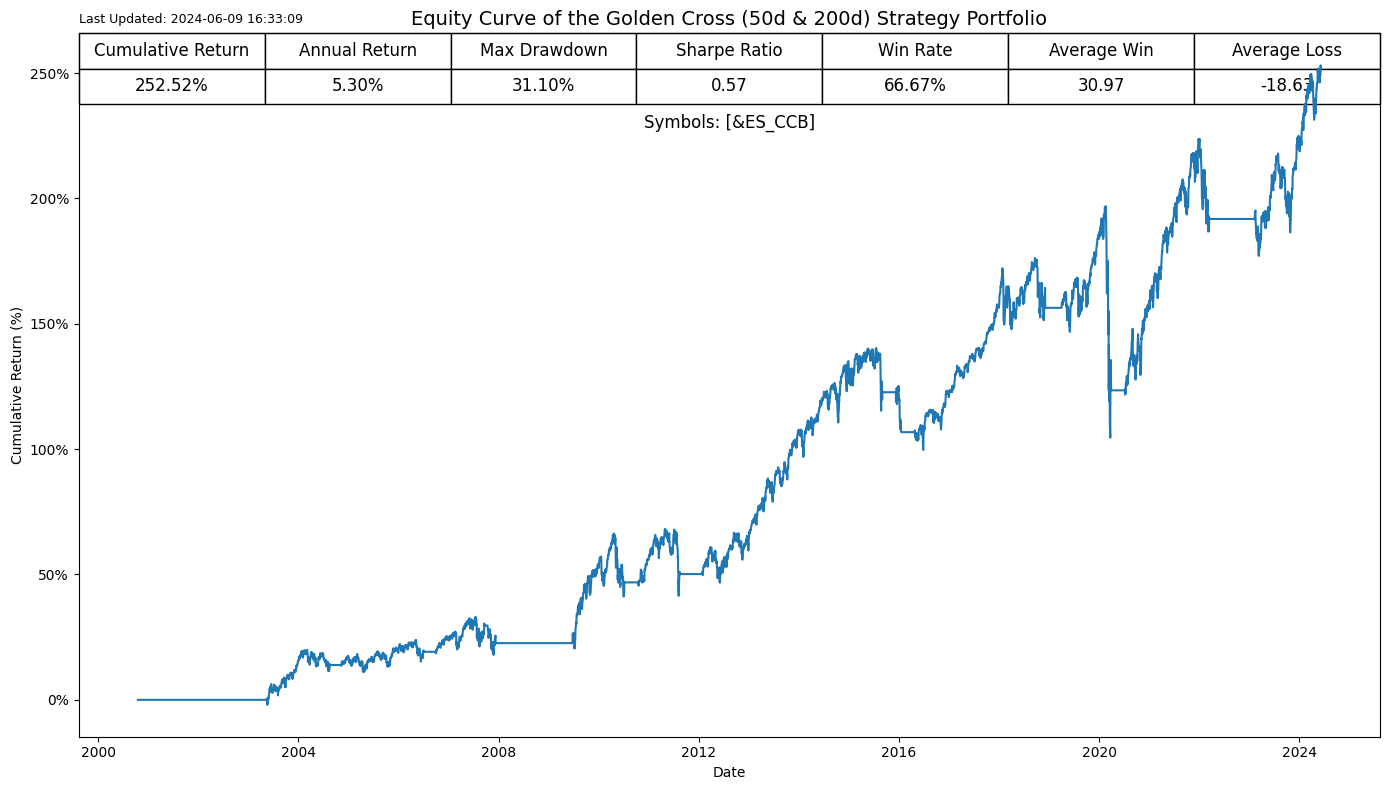
I look at a single symbol strategy (50 day cross of 200 day moving average), looking only at the SP – emini future, it produces a very nice backtest. 252% total return with maxDD of 31%.
We now use the same strategy across a portfolio of 8 Symbols.
The returns are much lower but so is the MaxDD however the Sharpe Ratio is not as good as the single strategy.
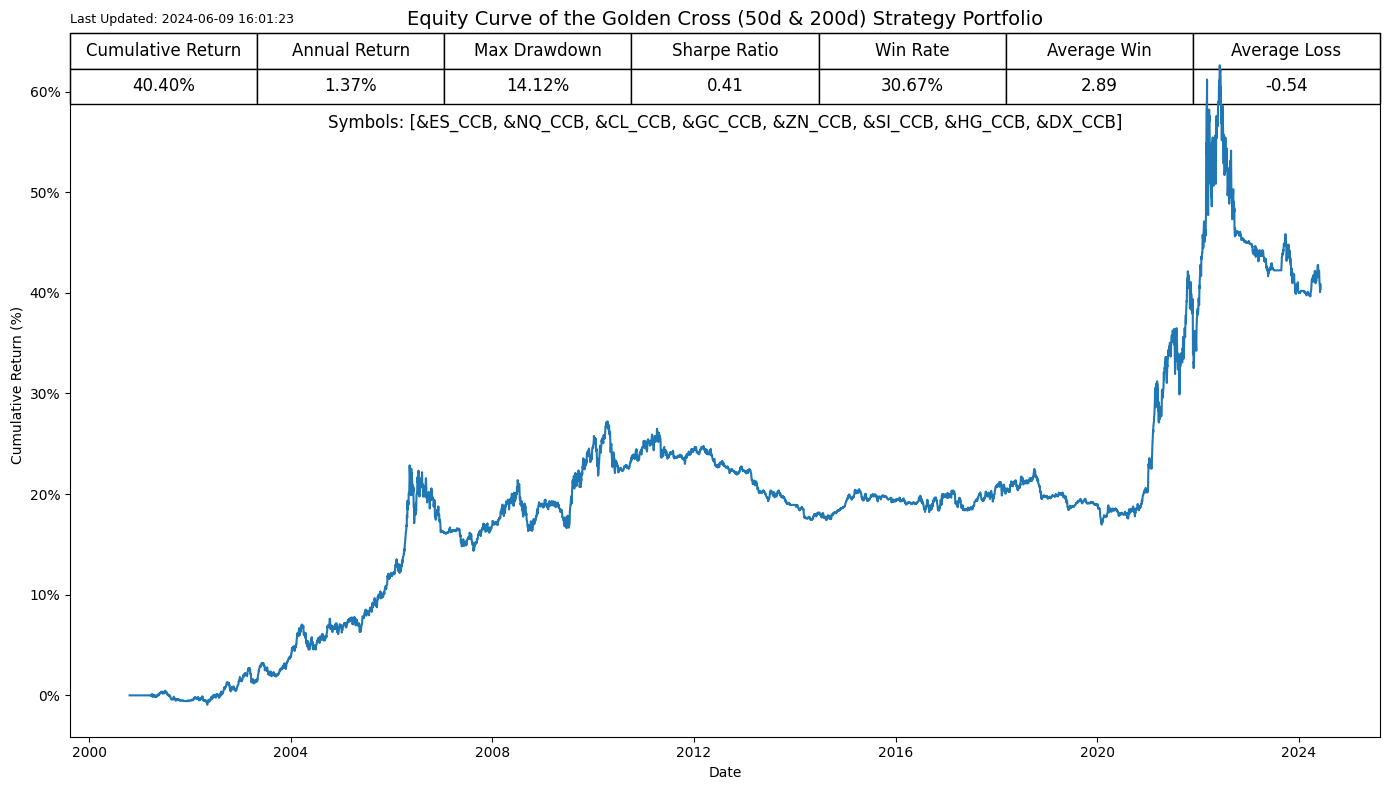
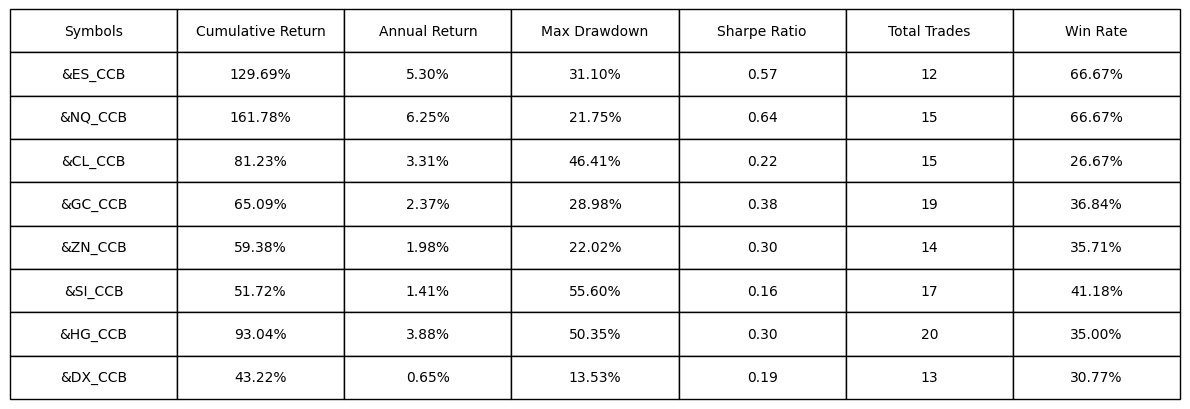
I include below the performance of each symbol that is allocated an equal amount to trade at the beginning of the backtest.
Concluding comments
In the example I have shared most of you will be tempted to trade the single symbol Nasdaq future (NQ) as it performed the best over the history since 2000. However, I would argue that you are probably better off investing across all these 8 symbols and perhaps improve some of the rules around allocating the capital. It is clear that the diversification provides some smoothing of returns which could allow more leverage as it has reduced the risk profile compared to a single symbol strategy.
The above example is purely illustrative of the concept of robustness that more traders avoid due to the temptation of chasing the most favourable return on paper.
Comments are closed