This post goes out as an email to our subscribers every day and is posted for free here around 2 PM ET. To get your real-time copy, sign up for the free or premium version here: Opening Print Subscribe.
They Can Spin It Any Way They Want — This Tape Still Smells Like Trouble
Follow @MrTopStep on Twitter and please share if you find our work valuable!
Our View
Trump was all over the place again yesterday. He said the U.S.-Israel war with Iran was “ahead of schedule” and nearly complete, downplaying Iranian strikes in the Strait of Hormuz and characterizing the conflict as a brief “excursion.”
Despite internal pressure to exit and rising gas prices, Trump pivoted to an economic tour of Kentucky and Ohio to promote his “Made in America” priorities, while simultaneously pushing for national voter ID laws and a federal benefit fraud crackdown with VP JD Vance. Amidst legal battles over immigration and the census, public approval remains strained by voter concerns over the war’s mounting household costs.
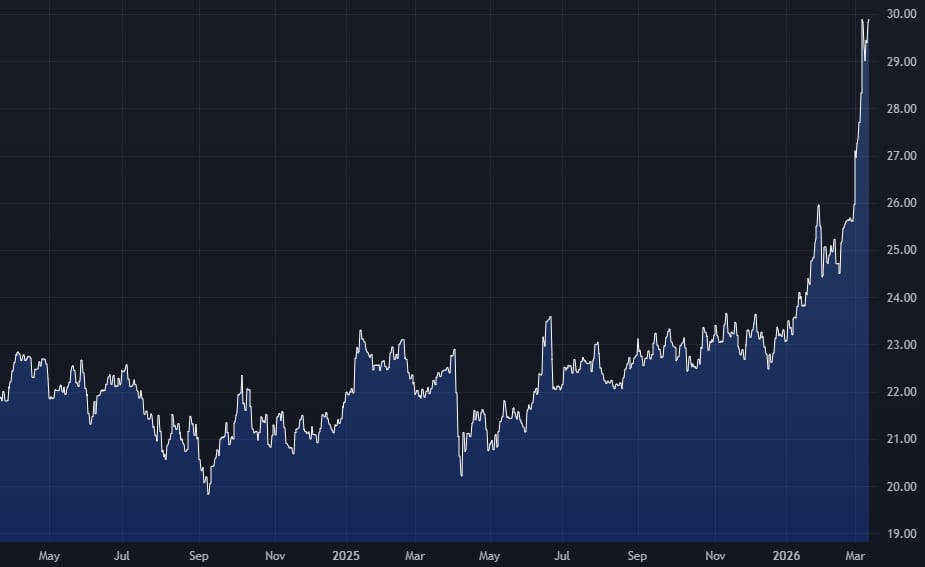
The big elephant in the room came after the IEA said it will release a record 400 million barrels of oil from strategic oil reserves to stabilize prices. Futures for Brent crude jumped to $93.80 and settled at $91.98 a barrel, up 4.8% on the day. The yield on the 10-year note jumped to 4.207% after a soft auction, making it harder for the Fed to lower interest rates.
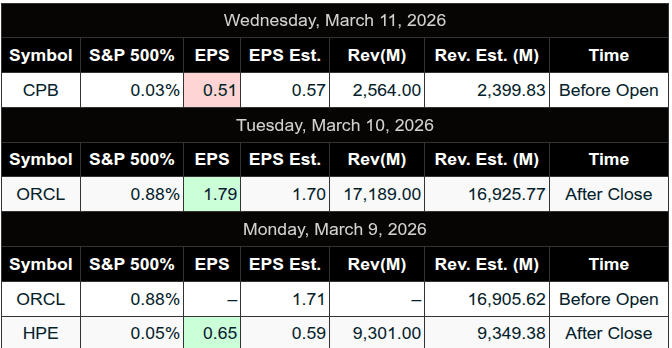
Oracle jumped 9.2% after the company reported strong demand for cloud computing to train and run artificial intelligence.
Our View
As the war continues to wreak havoc throughout the Middle East, some of Iran’s proxies have upped the ante. Hezbollah fired 100 rockets into Israel yesterday, and that is why the ES sold off on Globex last night.
Right now, the Houthis have been fairly silent, but for how long? U.S. and Israeli intelligence assessments indicate that, at this stage, the Houthis in Yemen are providing only indirect support to Iran. But if the situation of the Iranian regime deteriorates, the likelihood increases that they may eventually join the conflict and launch attacks against American and Israeli targets.
I think Iran is on its heels, and as the US and Israel continue to decimate Iran’s military capabilities and infrastructure, the pressure is increasing. My concern has always been that Trump thought this would be one and done, but that’s not going to happen.
Houthi forces in Yemen continue to threaten global maritime trade by targeting commercial shipping in the Red Sea and the Bab al-Mandeb Strait, a vital artery for 12–30% of global trade. For Iran, it could be a twofer: shutting down the Strait of Hormuz and the Red Sea/Bab al-Mandeb Strait. The total trade is in the trillions of dollars.
Our Lean
I don’t know how this is all going to end up, but it’s 10:40 pm, and the ES just traded down to 6705.75.
I know there are several economic reports out today and Friday, but the markets don’t care about any of them. The roll over used to start today, but the CME officially changed it to next Monday. I’m sure some accounts have already started to roll positions, and while it may not seem that way, the roll does affect the markets.
The other factor is that the March Quad Witching (March 20) is the largest quarterly expiration ever, with a notional value of $7 trillion. I know I am skipping around, but we are facing a market overload.
Our lean: Our lean remains the same. I can’t rule out dead cat bounces, but they will get sold. There is a dark cloud hanging over the markets, and that is not going to change anytime soon. If the ES gaps sharply lower, I can’t rule out buying the open of the first drop under the gap down. I understand the Pitbulls rule about looking for a low Thursday or Friday the week before the quad witching, but who wants to go long over the weekend? Not me!
Words to the wise: don’t over-risk, don’t hold on to losers, and use stops.
Claude ES Comprehensive Market Profile Roadmap (Down to 6,550)
Price
Profile / Technical Level
Context & Significance
6,874.00
Structural POC
Major Target: Highest volume node in the upper range.
…
[Refer to previous upside levels]
Detailed resistance nodes up to 6,874.
6,713.00
LATEST PRICE
Current Auction: Trading in “Discovery” below Value.
6,711.17
Pivot Point 2nd Support (S2)
Front Line: Immediate floor for the current session.
6,705.75
Session Low (Daily)
Current absolute floor; a breach triggers the “Flush.”
6,690.00
Minor Volume Node
Small shelf of support from late January.
6,672.58
Pivot Point 3rd Support (S3)
The Capitulation Line: Common end-of-day range target.
6,621.00
High Volume Node (HVN)
Structural Target: Where buyers previously stepped in with size.
6,611.00
Lower Value Area High (LVAH)
Top of the deep structural value zone.
6,590.00
200-Day Moving Average
Institutional Floor: Major trend-defense level.
6,584.50
1-Month / 13-Week Low
The Line in the Sand: Critical multi-month support.
6,579.47
14 Day RSI at 30%
Deeply Oversold; high probability of a relief bounce.
6,562.00
Structural Point of Control (POC)
Deep Value: The “fairest price” of the Q4 range.
6,550.00
Psychological Round Number
Final Support Node: Base of the current roadmap.
Strategic Lower Level Analysis
The 6,672 – 6,621 Air Pocket:
Looking at the S&P 500 E-Mini Mar ’26 profile, if 6,672 (S3) fails, the market enters a “Low Volume Node.” Without historical “fair value” to stop the price, it can slide rapidly to the 6,621 HVN.
The “Triple Confluence” (6,579 – 6,590):
This is the strongest support cluster on your entire sheet. It combines:
-
The 200-Day Moving Average
-
The 1-Month / 13-Week Lows
-
The Daily RSI 30% oversold trigger
Traders often look for “Excess” (a quick spike through and back above) this zone to signal a long-term bottom.
The Deep POC at 6,562:
If the 200-Day MA fails to hold, the market will naturally gravitate toward the 6,562 Structural POC. This is where the highest number of contracts changed hands earlier this year, making it the ultimate destination for a full-scale correction.

Guest Posts:
Dan @ GTC Traders
We’re All Oil Traders Now
At this point?
We’re all Oil traders.
Every market from Equities, to Treasuries, to even the agricultural’s? Is about Oil, and the fact that the Strait of Hormuz is closed. The deeper issue is that the macro foundation We have all been living in a structural inflation economy for 5 years. That is our foundation. Now, with the closure of the strait … we have one of the most extreme supply-shocks in the world … ongoing. GSCI is going through the roof, and GSCI is the price of all of the commodities that we use on in our daily lives. Basically, the input cost of goods that are produced …
GSCI via GSG
Markets have spent months assuming that time alone would solve this problem.
But time does not fix structural inflation.
Higher inflation is not coming. It’s already here, and people just don’t realize it yet. We’re just waiting for the April print of the number is all.
The problem for equities is not simply valuations, although those remain historically stretched. Risk assets more broadly feel increasingly unstable as geopolitical tensions and commodity inputs reassert themselves. Yet the market has not fully broken down either. The result is a macro environment where conviction shorts across the board remain difficult. We feel this is due to the fact that the market really hasn’t woken up to the coming surge in inflation either. So that rules out Treasuries as well. When everyone is ‘hip’ to the fact that inflation will surge? Watch Treasuries scream to higher yields.
Basically? We see a repeat of 2022 forming in capital markets.
We see the discretionary trade right now? Is ( as crazy as this sounds ) to be long oil. We said it last night in the X stream. If you look over at the Forward Curve … you’ll see that Crude Terms aren’t buying the narrative that ‘this will be over soon’ …
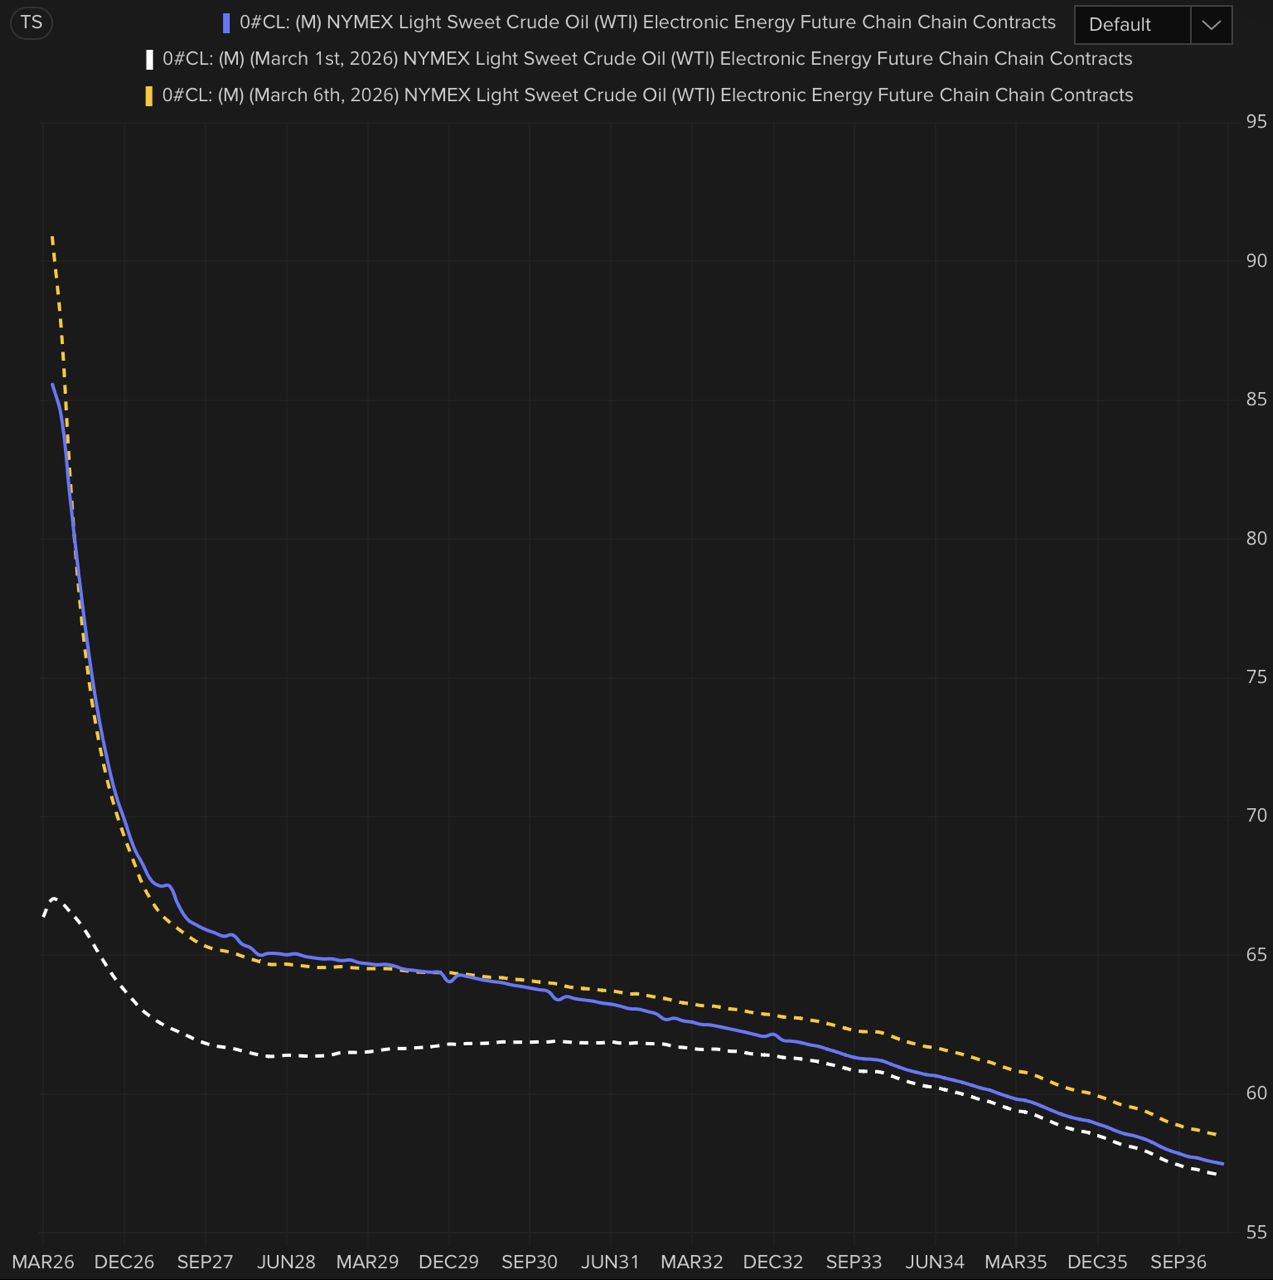
You can see there for yourself that the entire forward curve keeps pressing further out in time.
This does not mean the correct approach is simply to chase crude higher in an un-hedged fashion. Oil is notoriously volatile and headline sensitive. Positioning needs to be intelligent, hedged, and structured in a way that respects the inherent instability of the market.
If one hates the trade as the market is rallying? They could leg into a spread, so short a back month … and as soon as it moves against them for the periodicity that makes sense to hold the trade … then that’s the long entrance to go long the front term. As we try to work equities at GTC … this would be an $SCO … $USO at whatever your desired ratio. If you don’t know how to leg into trades? Honestly? I’d think about getting flat.
At the moment? We see that as the only real discretionary trade at the moment. Other than Oil? As was said in the movie “Margin Call”?
Sell it all.
Today.
Until next time, stay safe and trade well.
Market Recap:
There was a lot of chop on Globex. The ES traded down to 6768.25, rallied up to 6806.00 around 7:00 am, and then sold off down to a new low at 6734.75 after Iran attacked commercial ships, Dubai International Airport, and oil infrastructure and said it would target US banks and financial institutions next.
The consumer price index increased a seasonally adjusted 0.3% for the month, putting the 12-month inflation rate at 2.4%, according to the Bureau of Labor Statistics. The ES then rallied back up to and opened Wednesday’s regular session at 6792.59, up 4.5 points or +0.07% on total volume of 475k.
The core CPI rose 0.22% in Feb, in line with expectations. That lowered the 12-month rate to 2.46%. Core inflation was 2.3% annualized over the previous six months. Both are the lowest readings in five years. Over the last 3 months it has been 3% annualized the highest since Sept 2025.
Intraday Flow Summary
After the open, the ES traded 6791.75 and rallied up to 6802.00. That’s when I posted this
IMPRO: “Dboy:[9:41:42 AM]: this is a weak rally.”
The ES then sold off down to 6778.25 and rallied up to 6817.75 (after the G-7 agreed to a release of 400 million barrels of crude), sold off down to 6768.50 at 10:25, rallied up to 6803.75 at 11:00, and dropped 50.50 points down to 6753.25 at 11:45. It rallied up to 6767.00, sold off down to a new low at 6751.50 at 12:05.
The up and down pattern continued into the afternoon as the ES rallied up to 6784.75 at 1:25, and sold off 35.00 points down to a new low at 6749.75 at 1:35. It then rallied 24.75 points up to 6774.50 at 1:50, sold off down to 6753.50 at 2:10, rallied up to 6774.50, sold off down to 6760.00 at 3:15, and rallied up to 6779.00 at 3:40.
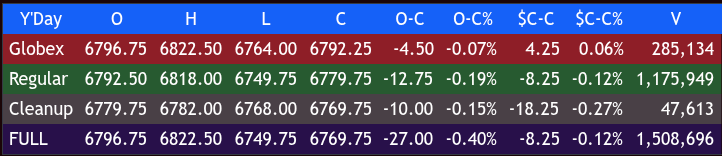
The ES traded 6773.00 as the 3:50 cash imbalance showed $900 million to sell, traded up to 6782.75, and traded 6779.75 on the 4:00 cash close.
After 4:00, the ES sold off down to 6768.00 at 4:55 and settled at 6779.50, down 7.75 points or 0.11%% and down 8 of the last 10 sessions.
The NQ settled at 24,983.50, up 1 point (00.2%%). The YM settled at 47,488, down 297 points (-0.62%) and down 8 of the last 10 sessions. The RTY settled at 2,545.00, down 5.50 points (-0.22%), and down 4 of the last 5 sessions.
In the end, it was all about crude oil, or the lack of it. Revier in the MrTopStep chat warned about the G-7 oil reserve headline just before it hit the tape and added that it was a sell-the-news event. He was right on with both.
In terms of the ES‘s and NQ’s overall tone, they were weak, like I expected in yesterday’s Opening Print. In terms of the ES’s overall trade, volume was on the high side at 1.893 million contracts traded.
If you want a good read on the G-7’s oil reserves release, Tracy (CHI) from Renegade Resource wrote a story titled:
The G-7 SPR Bluff: Why 300 to 400 Million Barrels Changes Nothing
The arithmetic of strategic reserves against a physical supply crisis that dwarfs every tool in the toolkit
The article sums things up pretty well and basically says the G-7 oil release is a spit in the bucket.
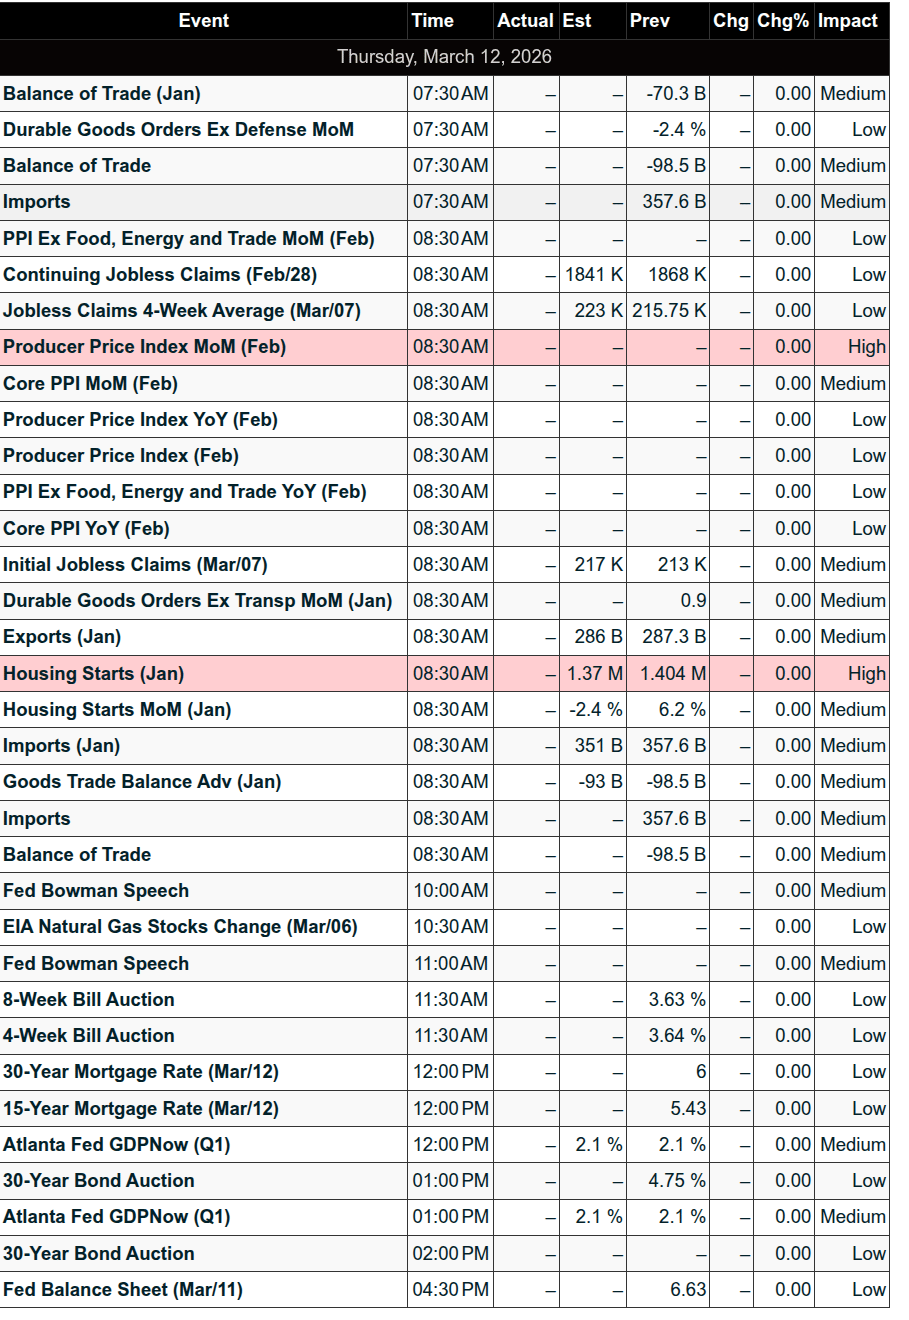
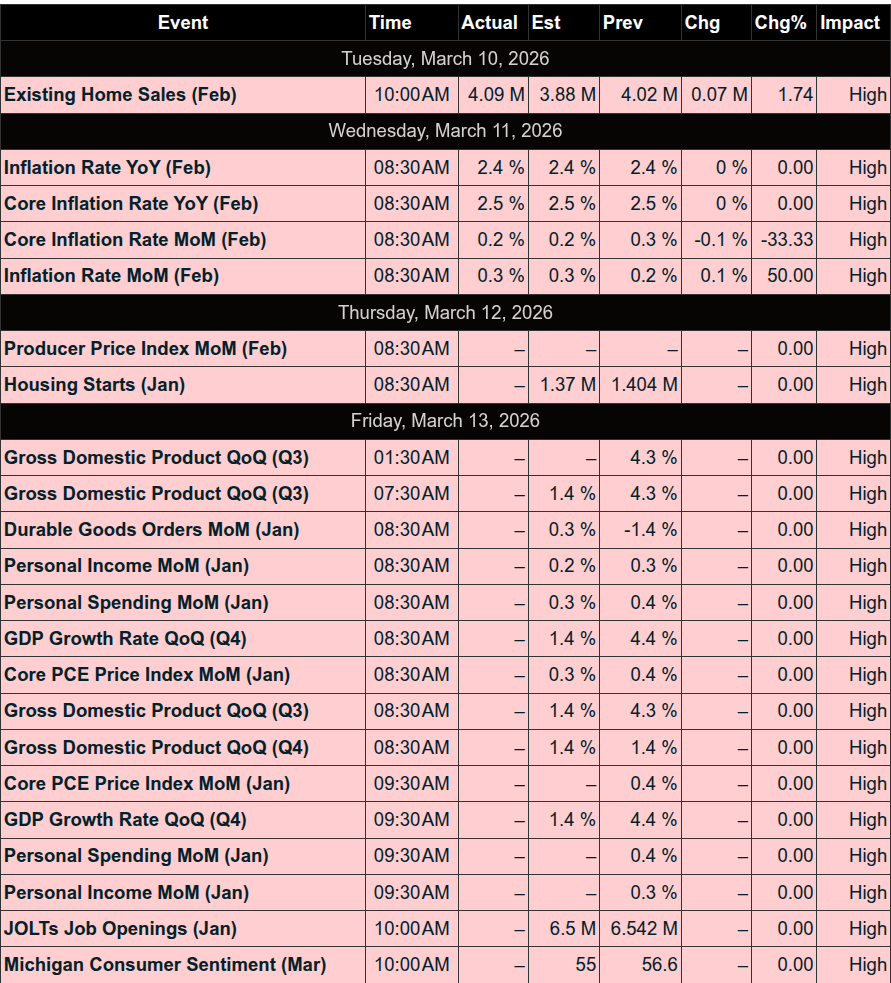
Economic Calendar
THURSDAY, MARCH 12
8:30 am: Initial jobless claims (March 7)
8:30 am: U.S. trade deficit (Jan)
8:30 am: Housing starts (Feb)
8:30 am: Building permits (Feb)
FRIDAY, MARCH 13
8:30 am: GDP (first revision) (Q4)
8:30 am: Personal income (Jan)
8:30 am: Personal spending (Jan)
8:30 am: Durable-goods orders (Jan)
10:00 am: Job openings (Jan)
10:00 am: Consumer sentiment (prelim) (March)
MiM
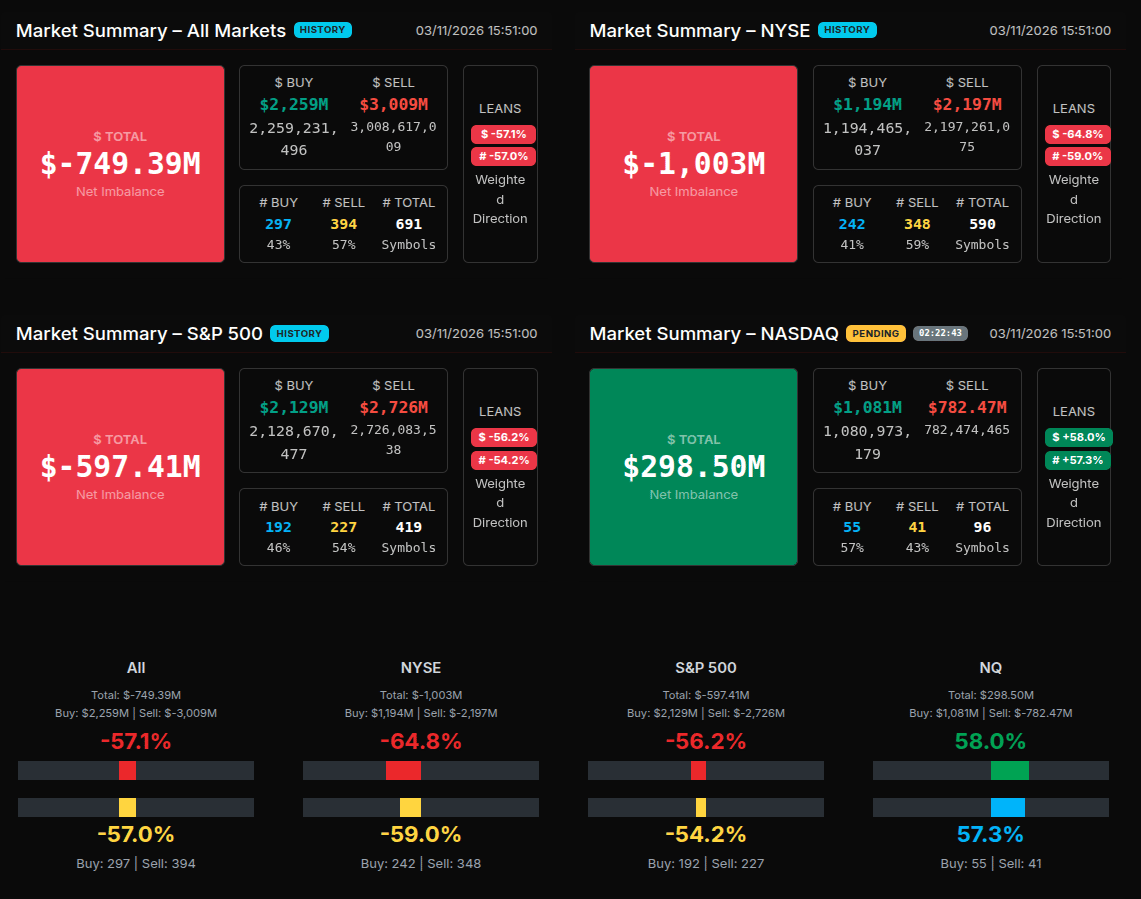
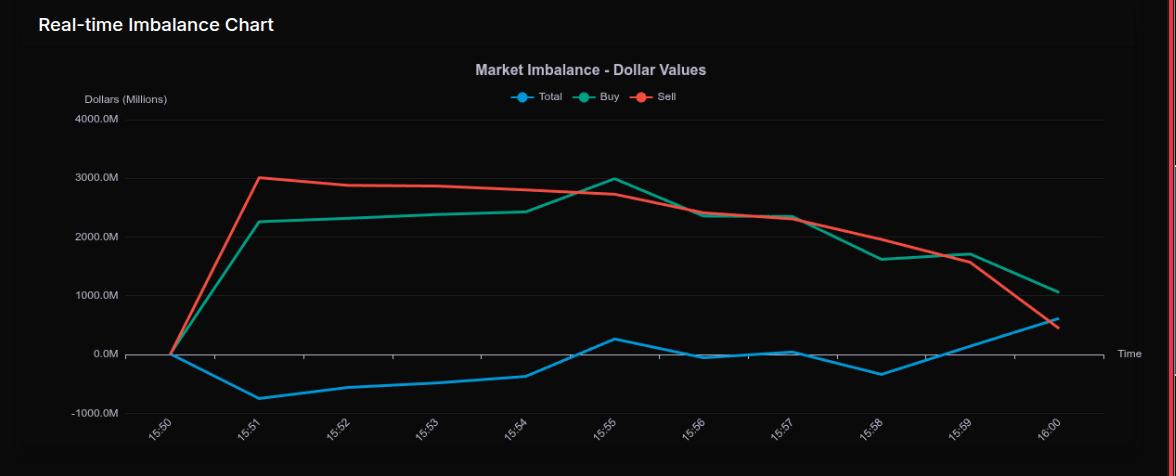
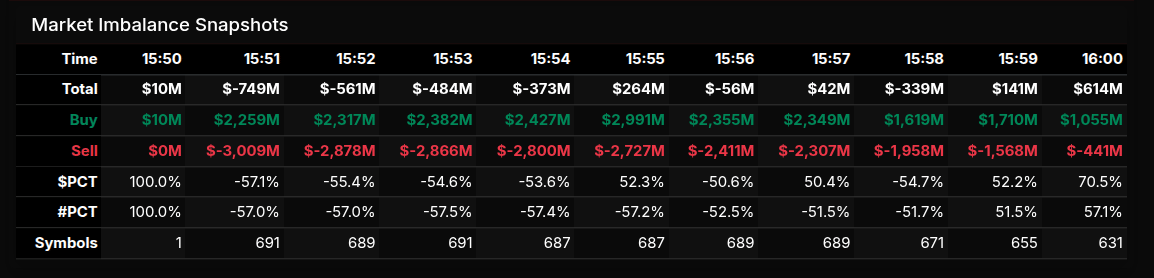
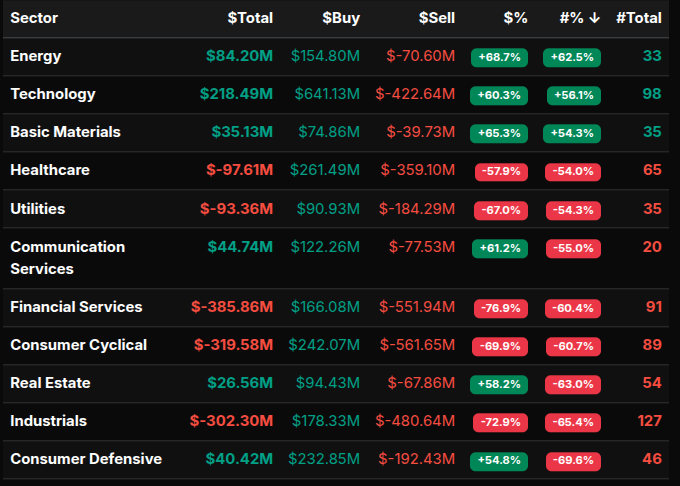
The closing auction imbalance opened with a clear sell bias across the broad market before rotating throughout the final minutes of trading. At 15:51, the market showed a net imbalance of approximately -$749M, driven by $3.01B in sell orders versus $2.26B in buys. The lean measured roughly -57%, indicating consistent sell-side pressure rather than a complete liquidation. The NYSE carried the heaviest weight with a -$1.0B imbalance and a stronger directional lean of -64.8%, while the S&P 500 also showed a notable sell tilt of -56.2%. In contrast, the NASDAQ diverged from the broader tape, holding a positive imbalance of roughly $298M with a +58% buy lean.
As the auction progressed, the imbalance fluctuated but remained largely sell-driven through 15:54. At 15:55, the market briefly flipped to a buy imbalance of roughly $264M as buy orders surged to nearly $3B. This rotation proved temporary, however, and the imbalance quickly returned to a sell bias before stabilizing into the close. By 16:00, the auction ultimately finished with a modest buy imbalance near $614M, reflecting late demand stepping in during the final match.
Sector flows showed a mixed but generally defensive posture. Energy (+68.7%), Basic Materials (+65.3%), and Technology (+60.3%) leaned strongly toward buy programs, while Communication Services (+61.2%) and Consumer Defensive (+54.8%) also attracted demand. On the sell side, Financial Services (-76.9%) and Industrials (-72.9%) displayed particularly strong sell pressure, both exceeding the -66% threshold that signals more wholesale distribution rather than simple rotation. Consumer Cyclical (-69.9%) and Utilities (-67.0%) also crossed that threshold, reinforcing the risk-off tone.
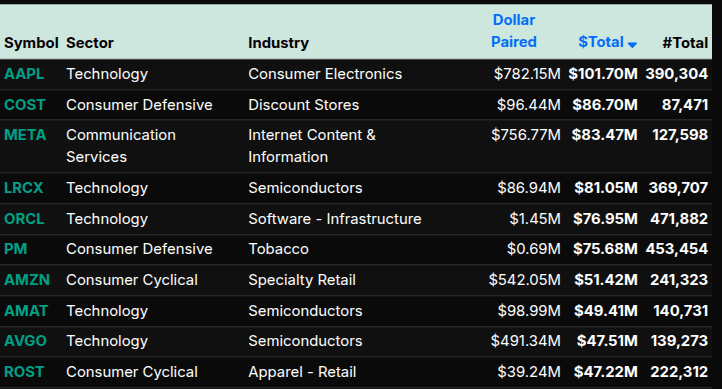
At the symbol level, buying was concentrated in large-cap technology and consumer leaders. AAPL, NVDA, META, LRCX, and ORCL all appeared among the largest buy imbalances, alongside defensive demand in COST and PM. Semiconductor names such as NVDA, AMAT, AVGO, and LRCX highlighted strong institutional participation in the tech complex.
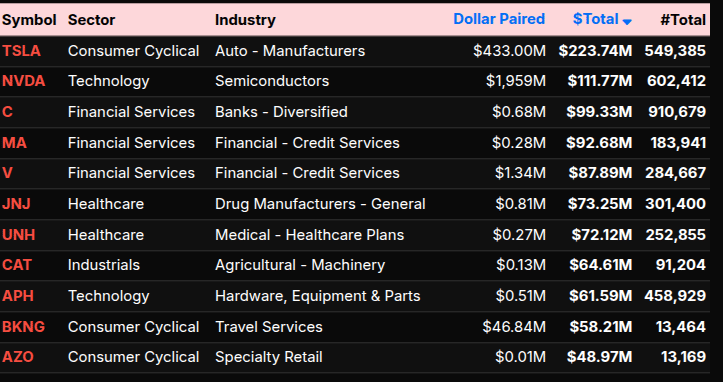
Conversely, the largest sell programs appeared in financials and cyclicals. TSLA led the sell side with the largest imbalance of the session, followed by major banks and payment processors, including C, MA, and V. Healthcare names JNJ and UNH also showed sizable sell pressure, while industrial exposure appeared through CAT.
Overall, the closing auction reflected a broadly defensive tone with persistent sell pressure in financials, cyclicals, and industrials, partially offset by targeted buying in technology and defensive consumer names. The late rotation into buys suggested some rebalancing activity rather than a purely directional liquidation into the close.
Technical Edge
Fair Values for March 12, 2026
-
S&P: 4.43
-
NQ: 20.56
-
Dow: 37.9
Daily Breadth Data 📊
For Wednesday, March 11, 2026
• NYSE Breadth: 39% Upside Volume
• Nasdaq Breadth: 59% Upside Volume
• Total Breadth: 51% Upside Volume
• NYSE Advance/Decline: 37% Advance
• Nasdaq Advance/Decline: 42% Advance
• Total Advance/Decline: 40% Advance
• NYSE New Highs/New Lows: 37 / 75
• Nasdaq New Highs/New Lows: 69 / 124
• NYSE TRIN: 0.91
• Nasdaq TRIN: 0.49
Weekly Breadth Data 📈
For the Week Ending Friday, March 6, 2026
• NYSE Breadth: 39% Upside Volume
• Nasdaq Breadth: 54% Upside Volume
• Total Breadth: 48% Upside Volume
• NYSE Advance/Decline: 26% Advance
• Nasdaq Advance/Decline: 32% Advance
• Total Advance/Decline: 30% Advance
• NYSE New Highs/New Lows: 320 / 160
• Nasdaq New Highs/New Lows: 318 / 550
• NYSE TRIN: 0.54
• Nasdaq TRIN: 0.39

BTS Levels:
ESH2026
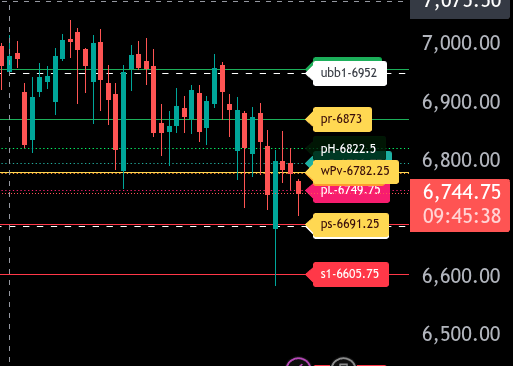
The bull/bear line for the ES is at 6782.25. This level is the key pivot for today’s session. As long as price remains below this level, the market maintains a bearish tone, and rallies into resistance may find sellers.
Currently, ES is trading around 6744.50, which keeps price firmly below the bull/bear line. If sellers maintain control below 6782.25, the market is likely to continue probing lower levels. Immediate support sits at 6749.75, which is the overnight lower pivot area being tested. A sustained move below this zone opens the door to 6691.25, which is the lower range target for today. If selling pressure accelerates through 6691.25, the next major downside support sits near 6605.75.
On the upside, bulls need to reclaim 6782.25 to shift the intraday tone. If price can recover this level and hold above it, the first resistance comes in at 6796.75, followed by 6822.50. Acceptance above 6822.50 would increase the probability of an expansion higher toward 6873.00, which is the upper range target for the session.
Above 6873.00, momentum could extend toward 6958.50, though that level would likely require strong participation and a broader market bid to reach during the regular session.
Overall, the market structure remains bearish while below 6782.25. Traders should expect two-sided volatility around the overnight lows, but sustained trade below 6749.75 keeps pressure on the downside toward 6691.25.
NQH2026
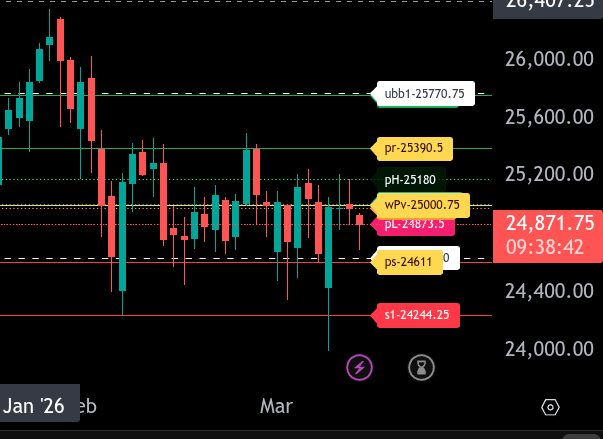
The bull/bear line for the NQ is at 25000.75. This level is the key pivot for today’s session. Holding below this level keeps the market in a bearish posture, while reclaiming it would signal a shift back toward bullish momentum.
Currently, NQ is trading around 24865.00 during the Globex session, positioning the market below the bull/bear line. As long as price remains below 25000.75, sellers are in control and downside continuation is possible. Initial support sits at 24873.50. A break below this level opens the door for a move toward 24640–24611, which represents the lower range target for the session. If 24611 fails to hold, the market could extend lower toward 24244.25.
On the upside, the first resistance to monitor is 25180. A push through this level would likely lead to a test of 25390.50, which is the upper intraday range target. If buyers reclaim the bull/bear line at 25000.75 and maintain acceptance above it, momentum could build toward these higher levels.
Beyond the upper range, major resistance sits much higher at 25770.75. This level represents a more extended upside objective should the market regain sustained strength.
Overall, the market remains bearish while trading below 25000.75. Bulls must reclaim and hold above this pivot to shift the tone of the session, while failure to do so keeps the focus on 24873.50 and the 24611 lower range target.
Economic Calendar Today
This Week’s High Importance
Earnings:
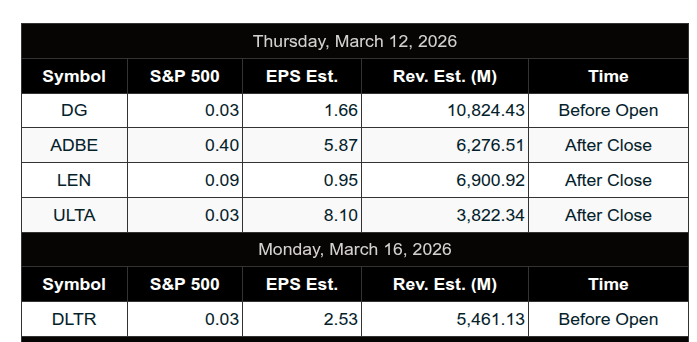
Recent
Trading Room News:
PTG Room Summary – March 11, 2026
Market Context
-
The session was Cycle Day 2, which typically carries expectations for MATD (Mid-Cycle rhythm) behavior after targets from the prior cycle were already met overnight.
-
Overnight activity fulfilled both major targets:
-
6820 upside edge
-
6770 downside edge
-
-
This set the tone for a potential consolidation / rotational session rather than a strong directional trend.
Key Strategic Level
Line in the Sand (LIS): 6800
David emphasized this level throughout the session as the dominant pivot determining directional bias.
-
Above 6800 → Buyers maintain control with upside objectives:
-
6820
-
6830
-
6840
-
-
Below 6800 → Rotation/reset scenario with downside objectives:
-
6780
-
6770
-
6760
-
Additional reference levels:
-
PVA High Edge: 6830
-
PVA Low Edge: 6780
-
Prior POC: 6788
How the Day Played Out
Pre-Market
-
David framed the day with the 6800 pivot as the critical battlefield.
-
Early expectation was MATD rotational rhythm, especially after overnight targets were completed.
-
An A10 sell setup was mentioned early as a potential opportunity.
Morning Session
-
Price struggled to gain acceptance above 6800, confirming the importance of the level.
-
David noted the market was having “tough sledding” sustaining bids above LIS, reinforcing the idea of balance rather than expansion.
Room discussion focused on:
-
Trade discipline
-
Avoiding account blowups
-
Staying aligned with the dominant force rather than predicting.
Key reminder from David:
Take only Triple-A setups and always use hard stops on the exchange.
Midday
-
Market continued rotational behavior around the pivot, consistent with the MATD expectation.
-
David stepped away during lunch, indicating a slow or balanced market environment where patience was required.
Closing Activity
Late in the session:
-
MOC Sell Imbalance: 700M
This suggested institutional selling pressure into the close, reinforcing the idea that buyers never fully took control above 6800 during the session.
Key Lessons From the Day
1️⃣ Respect the Line in the Sand
6800 acted exactly as intended:
-
Price failed to sustain above it
-
Market rotated around it most of the day
A great example of pivot-based decision making.
2️⃣ Cycle Context Matters
With overnight targets already hit, expecting trend expansion was lower probability.
Instead:
-
Market delivered rotation / balance behavior, matching the Cycle Day 2 rhythm expectation.
3️⃣ Patience > Activity
This was a session where:
-
Waiting for clean AAA setups was critical
-
Overtrading likely punished traders.
Positive Takeaways
-
Clear game plan before the open
-
Key level (6800) accurately guided the session
-
Market behavior matched cycle expectations
-
Strong emphasis on risk management and discipline
DTG Room Preview – Thursday, March 12, 2026
-
Macro Focus: Markets are watching Middle East escalation, oil prices, and 8:30 a.m. ET Unemployment Claims.
-
Geopolitics: Conflict appears to be widening with attacks on vessels and infrastructure across the Strait of Hormuz, Iraq ports, UAE, and Saudi Arabia, raising risks of further energy supply disruption.
-
Oil Impact: Crude has pushed back above $100 despite a large strategic release by the IEA. The strait has reportedly been impassable for 12 days, with mines discovered in the waterway.
-
U.S. Energy Response: The U.S. plans to release 172M barrels from the Strategic Petroleum Reserve over ~120 days and is considering measures to restart offshore production off Southern California.
-
Gas Prices: U.S. average gasoline prices have jumped to $3.58, up $0.64 since the conflict escalation.
-
Corporate News:
-
Tesla (TSLA) received a UK electricity supply license, allowing it to provide power to homes and businesses.
-
Premarket earnings: Dollar General (DG), Dick’s Sporting Goods (DKS).
-
After close: Adobe (ADBE), Ulta (ULTA), Lennar (LEN).
-
-
Economic Calendar:
-
8:30 a.m. ET: Weekly Jobless Claims
-
8:30 a.m. ET: Delayed releases — Building Permits, Housing Starts, Trade Balance
-
11:00 a.m. ET: Fed Governor Michelle Bowman speaks
-
Tomorrow: Heavy data slate including PCE, GDP, Durable Goods, JOLTS, and Michigan Sentiment.
-
-
Volatility: ES 5-day average daily range ~131.75 points, still elevated though volatility contracted Wednesday.
-
Positioning: Whale flow slightly bullish into the Claims release with relatively light overnight volume.
-
Market Structure:
-
ES remains trapped in a 6-month range: 6600–7000
-
200-day MA near 6697.50 acting as loose support after the overnight bounce
-
Price currently near the middle of a short-term downtrend channel, reducing odds of testing extremes without a catalyst.
-
Key ES Levels
-
Resistance: 6930–6935, 7240–7245
-
Support: 6545–6550
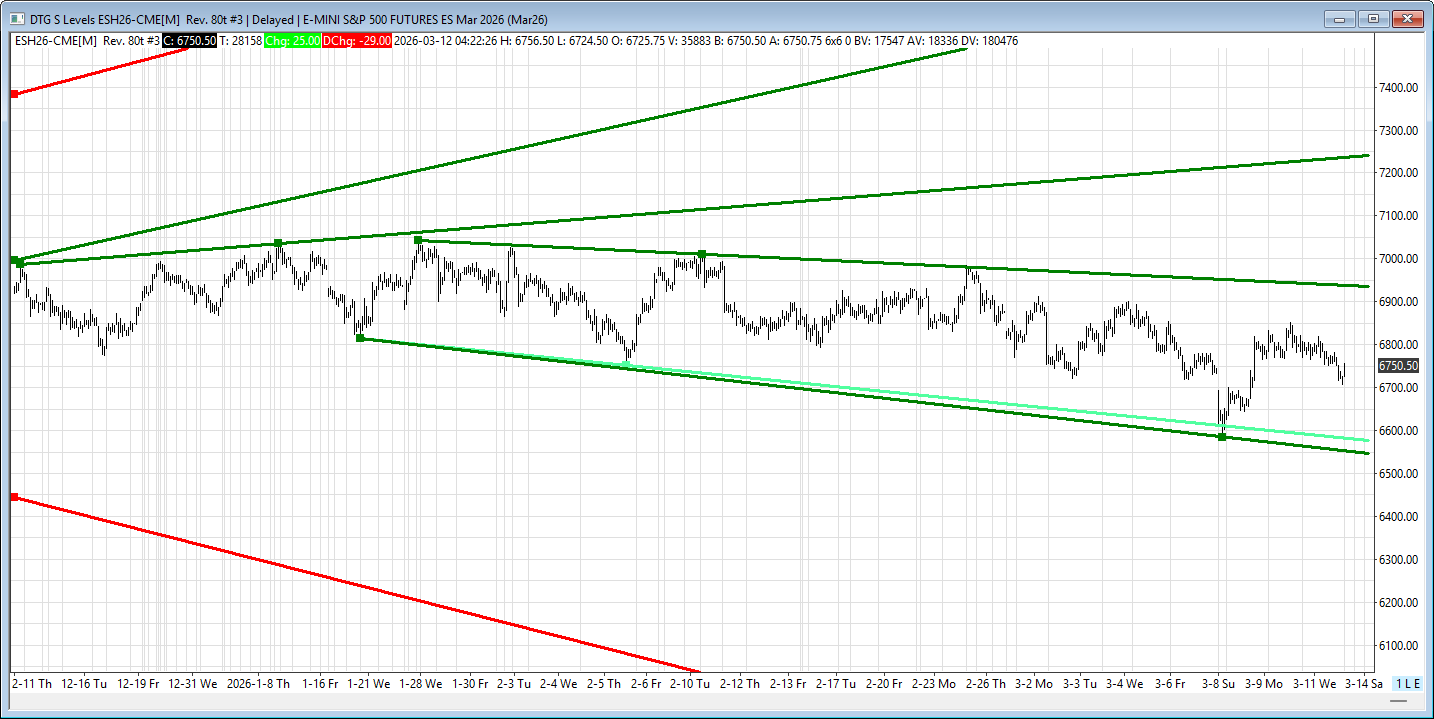
Affiliate Disclosure: This newsletter may contain affiliate links, which means we may earn a commission if you click through and make a purchase. This comes at no additional cost to you and helps us continue providing valuable content. We only recommend products or services we genuinely believe in. Thank you for your support!
Disclaimer: Charts and analysis are for discussion and education purposes only. I am not a financial advisor, do not give financial advice and am not recommending the buying or selling of any security.
Remember: Not all setups will trigger. Not all setups will be profitable. Not all setups should be taken. These are simply the setups that I have put together for years on my own and what I watch as part of my own “game plan” coming into each day. Good luck!
This post goes out as an email to our subscribers every day and is posted for free here around 2 PM ET. To get your real-time copy, sign up for the free or premium version here: Opening Print Subscribe.
Comments are closed