This post goes out as an email to our subscribers every day and is posted for free here around 2 PM ET. To get your real-time copy, sign up for the free or premium version here: Opening Print Subscribe.
They Scare You Out, Then Buy the Hell Out of It
Follow @MrTopStep on Twitter and please share if you find our work valuable!
Despite the dark clouds earlier last week, the ES and NQ survived a host of threats from the government shutdown, Trump’s tariff headlines, and regional bank losses. This is the way it works: everyone gets sucked into selling, and the banks run to the Fed’s open discount.
In short order, the ES sold off down to 6571.25 on Globex, rallied 120.75 points up to 6672, and opened Friday’s $1.9 trillion October options expiration trading session at 6659.25. After the open, the ES traded 6646.75, rallied up to 6663.75, sold off down to 6641.40, and then rallied up to 6697.00 at 10:15. It then sold off to a new daily low of 6640.50 at 11:36.
After the low, the ES rallied up to a lower high at 6696.50 at 12:30, pulled back to the 6665.50 level at 1:32, and then rallied 52.50 points up to 6718.00 at 3:21—only 2 points off my upside target. After the high, the ES traded down to 6702.50 at 3:33, rallied back up to 6711.50 at 3:40, and then started to slide down to 6703.50 at 3:48. It traded 6707.50 as the 3:50 cash imbalance showed just $192 million to sell, sold off down to 6701.00 at 3:57, and traded 6703.75 on the 4:00 cash close. After 4:00, the ES traded up to 6713.50 at 4:21 and settled at 6702.50, up 33.75 points or +0.51%.
In the end, the price action spoke for itself: scare the public into selling after the headlines—and then buy the hell out of it.
In terms of the ES’s overall tone, the ES settled at 6715.00 on Wednesday and 6702.50 on Friday. How bad is that? In terms of the ES’s overall trade: on 10/10, when the ES sold off down to 6540.25, total volume was the lowest of the last three sessions at 2.006 million contracts traded, with over 500k of that coming from Globex.
On Tap:
-
Tuesday: Fed Governor Christopher Waller – opening remarks
-
Wednesday: Fed Governor Michael Barr speaks
-
Thursday: Fed Vice Chair for Supervision Michelle Bowman testifies; Fed Governor Michael Barr speaks again
-
Friday: Would have been CPI, PMI, and Consumer Credit
Trump vs. Xi
There has been news overload over the last few months, which increased steadily over the last few weeks but exploded when Trump responded to China’s rare earth mineral limits last Friday by imposing 100% tariffs on Chinese goods—while both countries were increasing docking and port taxes.
As I’ve said a few times, the Chinese are not falling for Trump’s “Art of the Deal” threats anymore. And as the tariff deadlines approach, there has been a noticeable pickup in volatility and risk. Despite the ES only being 1.5% off its high, there is one area of constant risk-off: gold—and it’s not just from the dollar, but also from Bitcoin and other cryptocurrencies that have rocketed to new highs in the last few weeks.
Gold
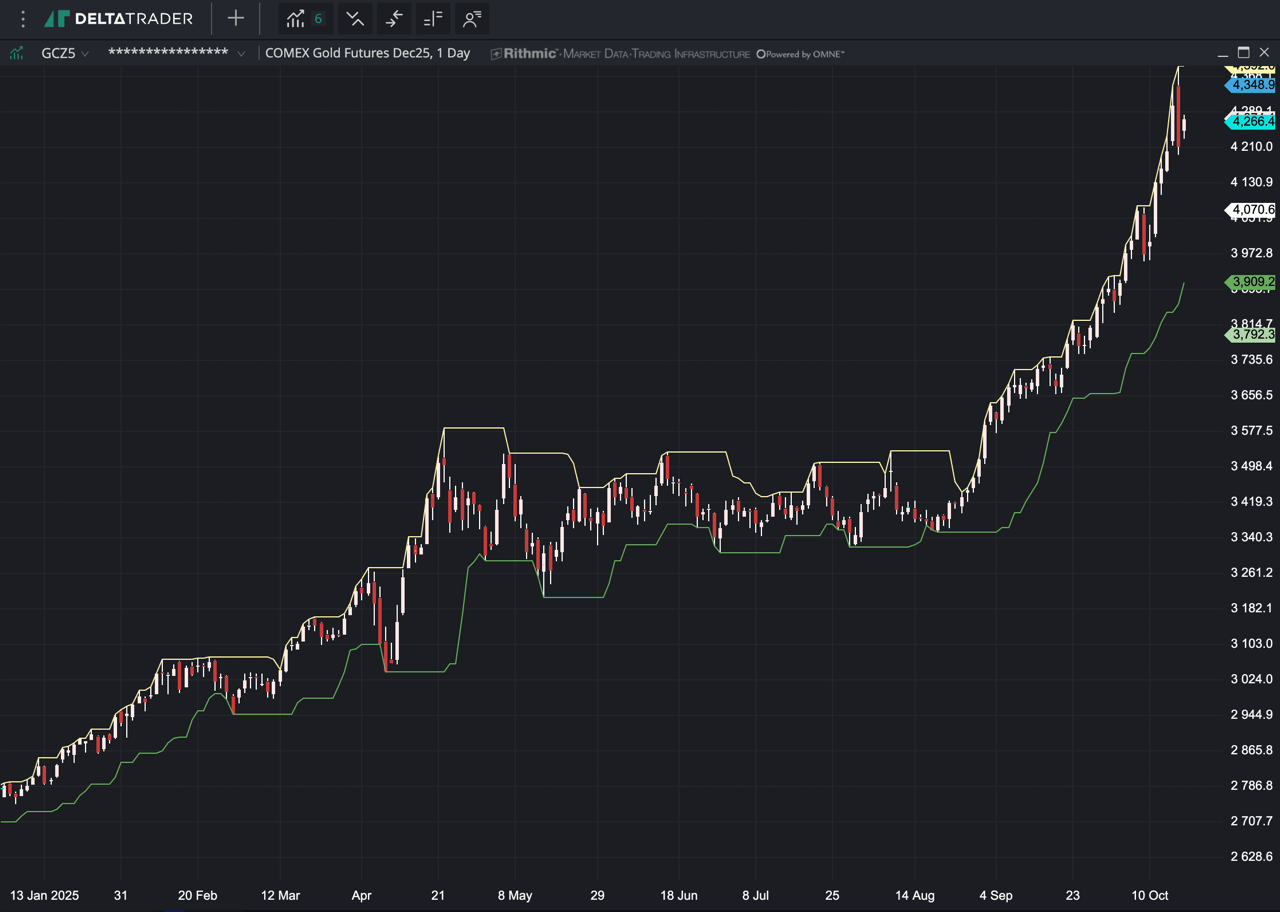
Goldman, in a note on Oct. 12, said gold prices above $3,000 an ounce, and potentially even higher, are increasingly being viewed as the new normal rather than a peak. They also said the gold sector could return to historic mid-cycle enterprise multiples—a common valuation measure—of roughly 7.0–7.5x for large-cap stocks and about 5.0x for mid-cap ones. That compares with current trough multiples around 5.5–6.0x in large caps and 4.0–4.5x in mid-caps.
If someone told me back in October 2022, when gold was trading in the low $1800s, that we’d see $4,392.00, I would have said you’re full of shit. Yet, when I look at the stats, the last time gold fell more than two days in a row was the 4-day decline from 8/14/25 to 8/19/25.
Out of the last 28 sessions:
-
20 have closed up
-
8 have closed down
-
Up 14, down 3 of the last 17
-
Up 9 of the last 11
-
Up for the last 5 days in a row
However you slice it, gold has gone parabolic, but as long as central banks need a hedge against the dollar, gold will continue going higher. I told the PitBull over two months ago: gold is going to $4,500 and then $5,000.
Will there be hiccups? Yes. Up until last week, most of the drops have been $50.00 to $60.00, and they didn’t stay down long. But last Friday’s drop was $120.00.
Crude (CLZ): Buybacks Under Pressure
Crude (CLZ) has taken a beating as world economies slow during the tariff wars. European oil majors face intensifying scrutiny over unsustainable share buyback programs amid weaker crude prices ($65–$75/barrel, down from $100 in 2022 and potentially below $60 next year) and rising debt squeezing profits. Maintaining current levels requires $70–$90/barrel—most will suspend buybacks below $50/barrel while protecting dividends.
-
BP slashed its quarterly buybacks in April, with net debt steady at $26 billion.
-
TotalEnergies slowed its program in September after debt nearly doubled.
-
Shell committed to $3 billion+ in quarterly repurchases even at $50/barrel.
-
Eni eyes a Q3 increase to at least $1.7 billion (down from $2.2 billion in 2024) via divestments.
-
Chevron reduced buybacks post-Hess acquisition.
-
ExxonMobil reaffirmed $20 billion annually despite 19% Q2 debt growth funded from its balance sheet.
Bank of America forecasts 40% buyback cuts at $60/barrel and 80% at $50/barrel in 2026, forcing a shift from the “capital allocation trilemma” (shareholder returns, healthy balance sheets, reserve investments) toward prioritizing debt reduction as investor concerns dominate upcoming earnings calls.
The CLZ25 futures made a low at 55.15 on Friday and bounced up to 57.53 on Globex.
I think the $55.00 key support is extremely oversold. Under $55.00, major support is at the $48.00 to $50.00 level.
BTC Crypto Flash Crash
If there’s anything clear about Bitcoin, it’s that it doesn’t like it when the ES and NQ come crashing down. I think most of it is another case of too many people buying it at or near record highs.
Bitcoin’s crash severity came from its high correlation with equities during macro stress—acting like a leveraged tech stock, not “digital gold” (which hit records).
-
$19B in long positions were liquidated in 24 hours (largest ever), triggering forced selling on Binance, amplified by margin flaws, after BTC/altcoin futures open interest surged 374%/205% YTD.
-
Suspected whale Garrett Jin shorted $735M in BTC/ETH pre-announcement, profiting ~$200M (unproven insider trading).
By Oct 19, BTC stabilized at $105K–$115K, with Marathon Digital buying dips and $3.17B ETF inflows signaling recovery—but options hedge for year-end volatility amid tariffs and shutdown risks.
Downside: The issue was less about a single company failing and more about the entire market structure being unable to handle an extreme, high-speed sell-off, which led to record liquidations and exposed the weaknesses of some centralized exchanges.
Dollar $DXY
The US Dollar Index (DXY), which measures the dollar against a basket of major currencies like the euro, yen, and pound, has plummeted about 10–11% year-to-date through mid-October 2025—its worst first-half performance since 1973, and the sharpest annual drop in over 50 years.
Currently hovering below 99 (down from a late-2024 peak above 108), the decline accelerated in recent weeks amid a confluence of domestic policy shocks and global shifts.
Key Drivers:
-
Federal Reserve rate cuts and dovish expectations
-
Tariff policies and trade war escalation
-
US government shutdown and fiscal strain
-
Broader economic and geopolitical pressures
Implications and Outlook:
A weaker dollar benefits US exporters (cheaper goods abroad) and emerging markets (lower debt costs), but it raises import prices, potentially fueling inflation and travel costs for Americans.
Bank of America and Morningstar see 5–10% further downside by year-end if shutdowns persist and tariffs bite. However, AI-driven US productivity (up 3.3% Q2) or paused Fed cuts could spark a rebound to 100+.
Despite all the negatives, the dollar still holds ~58% of global reserves—no viable replacement yet.
Key Support Levels:
-
98.01 – 98.24: The 50-day moving average (~98.017) and recent Fibonacci retracement levels (98.238) form a critical support zone. This area has held as a consolidation base recently, with the DXY trading near 98.20 during Asian sessions on October 17.
-
97.68 – 97.92: A deeper support band, including the 97.921–97.685 range and the 14-day RSI 50% level (~98.16), could act as a pivot if selling pressure intensifies. A break below 98.00 may target this zone, especially if bearish momentum persists.
-
96.00 – 96.63: A major longer-term support, with 96.00 as a psychological level and 94.63–94.98 as a key technical floor, seen as critical in prior analyses. A drop here would signal a significant bearish leg, potentially triggered by adverse Fed signals or trade escalation.
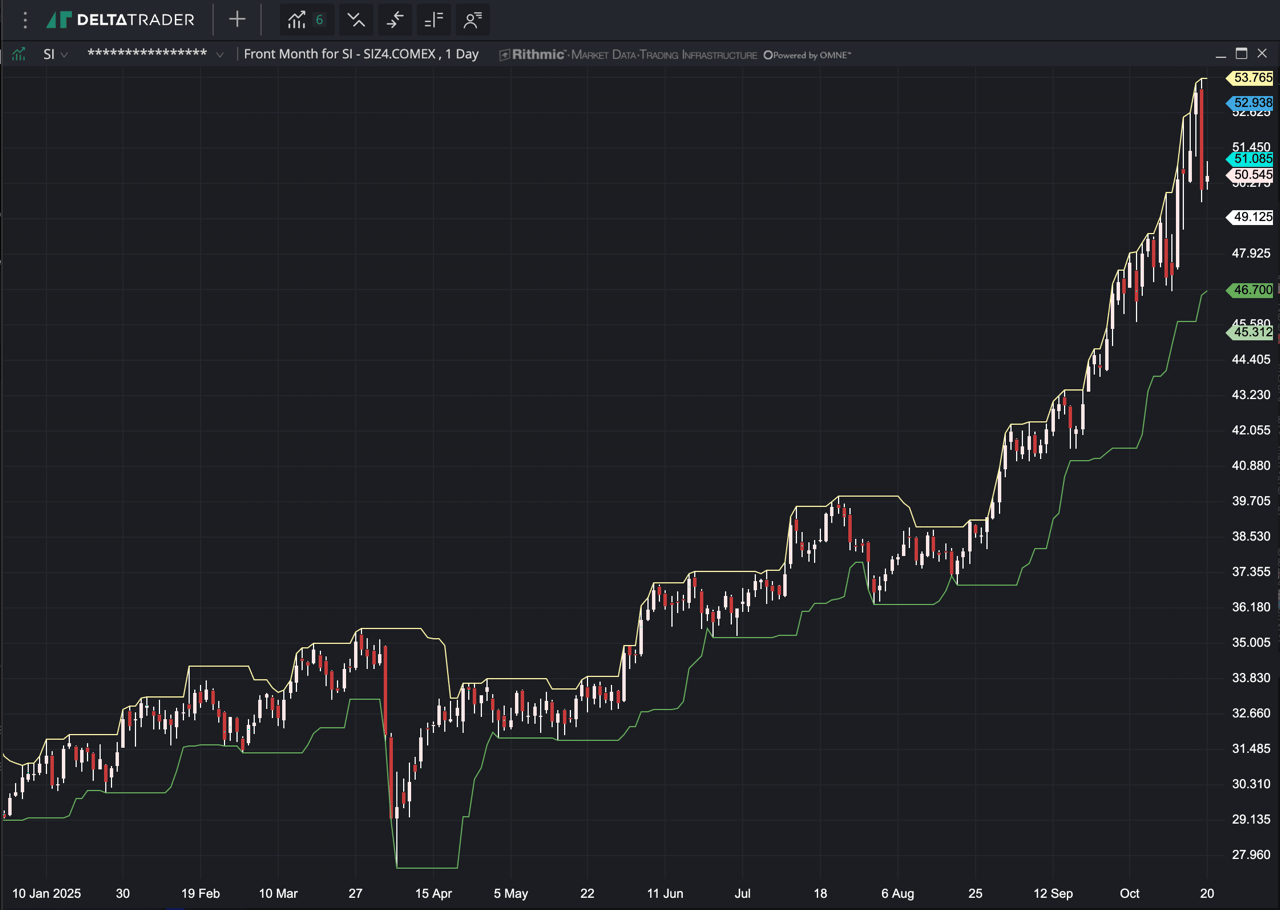
Silver: How High is High?
The (SIZ:25) gained 3.8% Thursday, extending a record-breaking rally that has Wall Street forecasters raising their price targets. It rose for the 5th consecutive trading session, adding $1.95 a troy ounce to end at $53.023, then fell over 7% and closed down 5.99% on Friday.
Futures on Monday notched their first new record high in 45 years and have now gained 83% this year—well ahead of major stock indexes, as well as gold, which also ended Thursday at a new record price of $4,280.20 a troy ounce and is up 63% in 2025.
Bank of America analysts said that although they expect an 11% decline in silver demand next year—thanks largely to diminished consumption by the solar-power industry—they anticipate a continued supply deficit. As such, they said prices could average $56.25 an ounce next year and potentially trade as high as $65.
Silver Stats:
-
A new record high
-
Up for five consecutive sessions
-
Up $6.173 or 13.18% over the last five sessions
-
Up eight of the past ten sessions
-
Rose 67.94% from 52 weeks ago
-
Up 82.11% from its 2025 settlement low of $29.116 hit Friday, April 4, 2025
-
Month-to-date: up 14.64%
-
Year-to-date: up $24.083 or 83.22%, according to FactSet
While gold and silver may be at a pullback point, I do not see a major metals correction anytime soon—there is just too much demand.
Our View
No Kings Day. Trump is turning up the heat on Colombia and Venezuela. Israel hits dozens of Hamas targets after an attack on its troops. Automakers in the US are hit by low levels of rare earth materials. Powell keeps the Fed on track to lower rates. Is there going to be a shortage of copper?
Eurozone industrial production decreased by 1.2%. The BoE remains cautious on the pace of rate cuts. China’s imports surprised to the upside, rising 7.4% year-over-year in September. A new Goldman Sachs team will focus on deals to finance data centers and AI projects. A Justice Department official instructed attorneys to probe George Soros’s philanthropic empire. The window for extending billions of dollars in Americans’ healthcare subsidies is closing rapidly.
President Trump announced the U.S. will cease aid payments to Colombia. Four individuals executed a daylight heist at the Louvre Museum, stealing eight royal jewels, including Empress Eugénie’s bow brooch. The yen weakened against other G-10 and Asian currencies during the morning session. Utah prepares for the Charlie Kirk murder trial. Donald Trump urged Volodymyr Zelenskyy to accept Russia’s terms for ending the war in a volatile White House meeting on Friday.
I know this may not be a standard view, but it’s a very small example of the kind of headlines we face every day. I made this saying up on the trading floor when S&P pit volume was shrinking and Globex volume was increasing:
“We live in an ever-changing world that doesn’t stay the same for long.”
I think that sums things up nicely.
Our Lean
These are not easy markets to trade. While I don’t do a bad job calling the markets, it doesn’t always add up on my trading statement.
When you’re losing, it’s important to follow some BCIS rules, and one is to cut size, preserve capital, and keep your head in the game. When traders start making money, they often end up thinking they are smarter than the markets. That is a losing strategy.
Go slow, go back to the basics, and get back in the swing. I know that sounds easy—it’s not. But if you’re out of focus, your account will suffer.
The PitBull taught me years ago, back when I was doing his orders, that it’s OK to take a few days off when you go on a cold streak; it acts as a reset.
Our lean: In the last 12 hours, the ES rallied 145 points and is higher on Globex. As we’ve learned, almost all the Trump sell-offs are short-lived, and there’s talk that the government budget is going to get passed this week, which I think would be a big positive for the stock market.
That said, 8 out of the last 8 Mondays have been higher, and if volume falls, it could favor the upside. If you follow the early price action, the play is to sell the gap up or the early rallies and buy the pullbacks.
There should be minor support at:
-
6690, 6684, 6676.00, 6665.50, 6658, 6646, 6637.50, 6630.00, 6613.50, 6604.00
I don’t see the ES selling off that much, but based on the size of the ranges, it wouldn’t be out of the ordinary.
MiM and Daily Recap
Intraday Recap
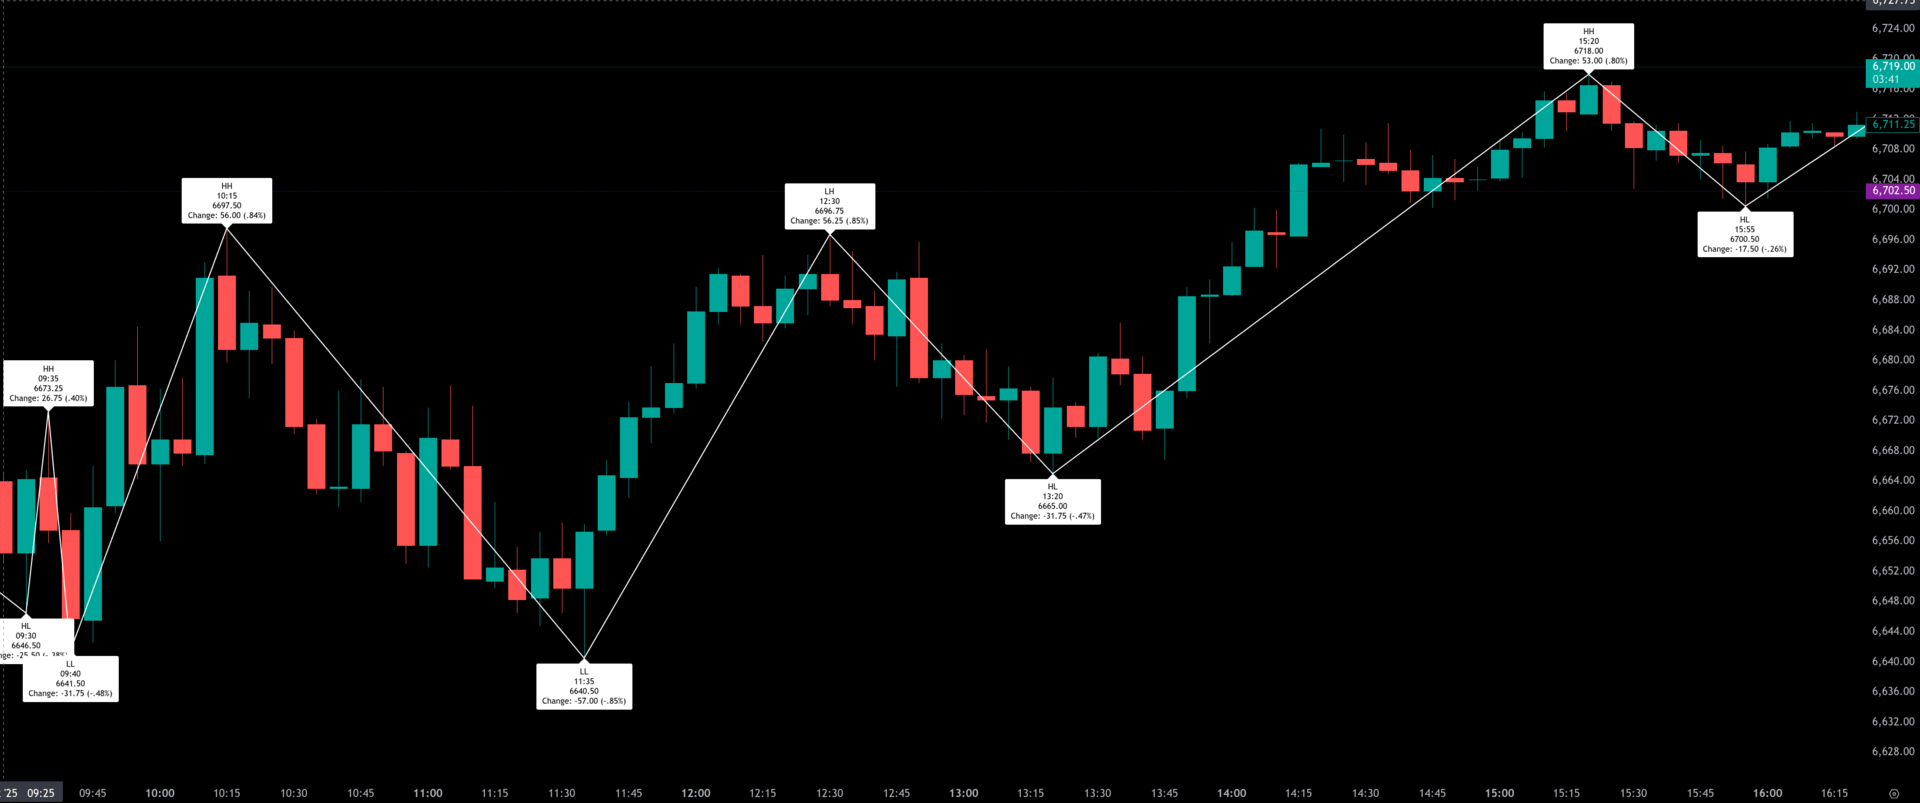
The ES began the Friday Globex session with a slow drift lower, opening at 6659.25 and hitting a low of 6571.25 at 4:20 AM before finding buyers into the European open. That Globex swing marked a 1.19% slide from the early high of 6641.75 at 7:00 PM, later recovering into the mid-6660s ahead of the NY cash open. The overnight tone was defensive, but the low held steady above the prior week’s deep support band.
The regular session opened at 6654.50 and immediately dipped to 6646.50, but buyers stepped in quickly. From there, momentum built as the ES rallied to 6673.25 at 9:35 and extended to 6707.50 at 10:15 — a 55-point climb off the morning low. That surge met profit-taking, sending prices down to 6634.50 at 11:35. This midday pullback completed a full round-trip back toward the Globex recovery base.
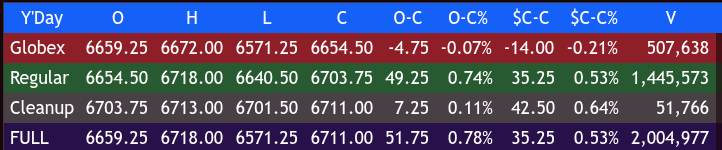
Once that low was in, buyers pressed again. The ES gained 56 points to 6696.75 at 12:30, pulled back modestly to 6665.00 at 13:20, and then advanced to the afternoon high of 6718.00 at 15:20 — matching the prior day’s Globex peak and setting a near-term pivot. The market eased into the 3:50 imbalance window, dipping to 6700.50 at 15:55 before closing the session at 6703.75, up 49.25 points (+0.74%) from the open and 35.25 points (+0.53%) above Thursday’s settle. Total day volume reached roughly 2.0 million contracts, with 1.45 million during the cash session.
The full-session performance (Globex through Cleanup) printed an open-to-close gain of 51.75 points (+0.78%), with the cleanup print at 6711.00, up 42.50 points from the previous day’s cash close (+0.64%).
Market Tone & Notable Factors
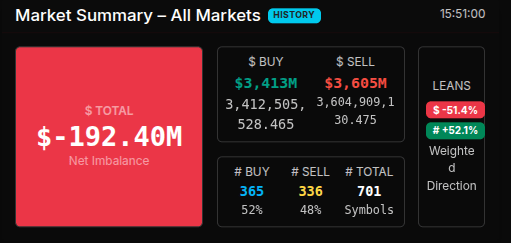
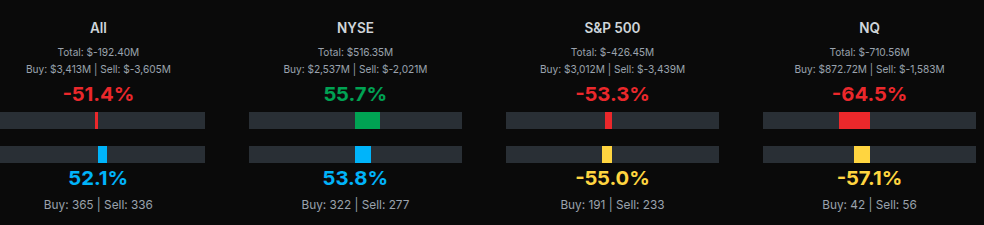
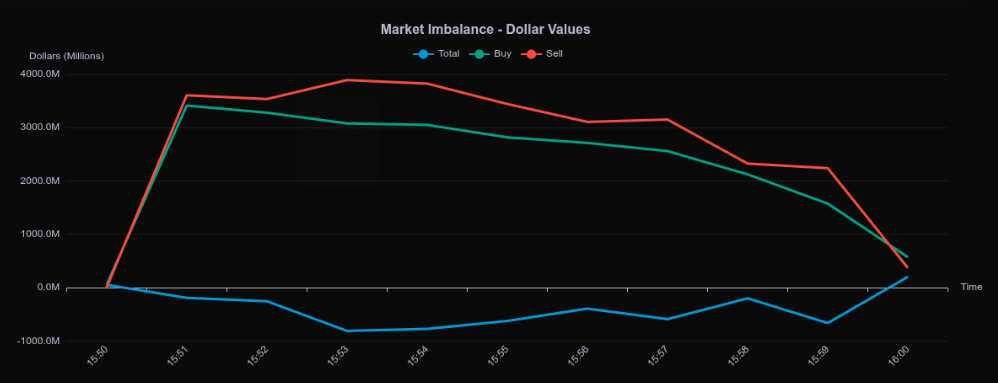
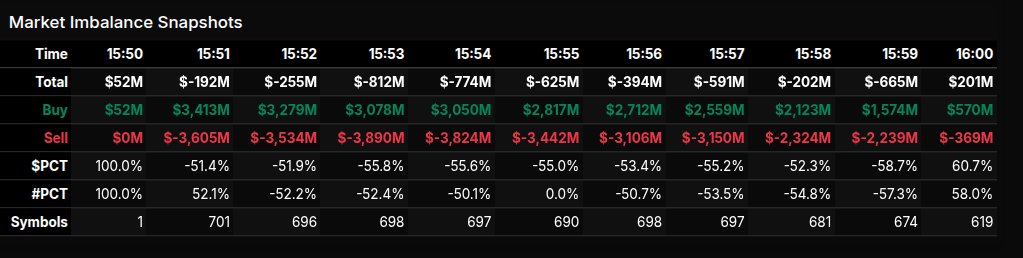
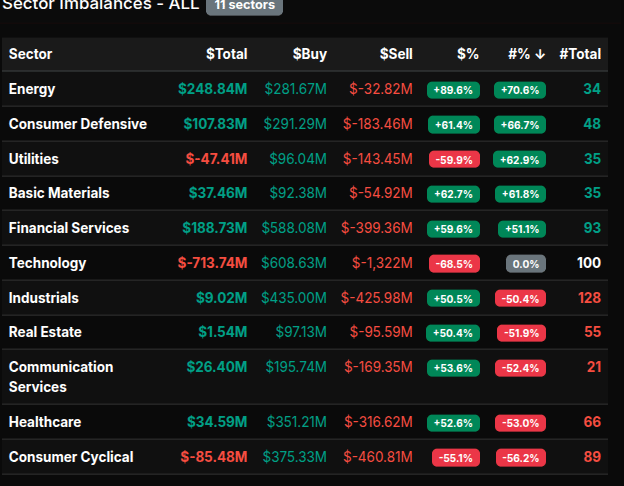
Friday’s OPEX session was largely balanced and rotational, showing size in both directions without a decisive lean. The Market-on-Close imbalance meter confirmed this neutrality: total MOC flow was a mild net sell of –$192 million, split between $3.41B to buy and $3.61B to sell — a roughly 52%/48% buy-to-sell symbol ratio, indicating no strong directional pressure. Sector data reflected rotation rather than broad risk-on or risk-off positioning.
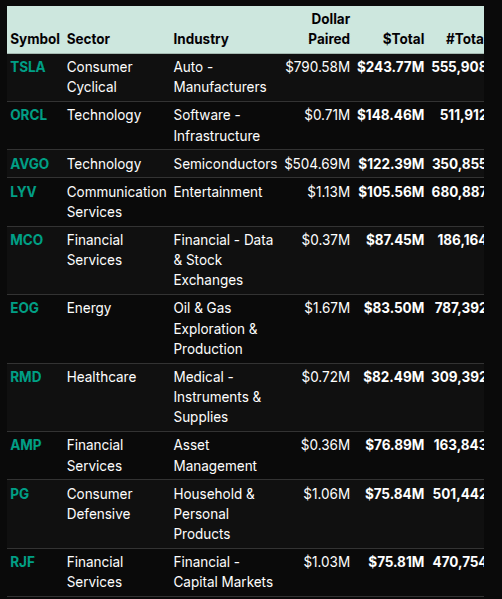
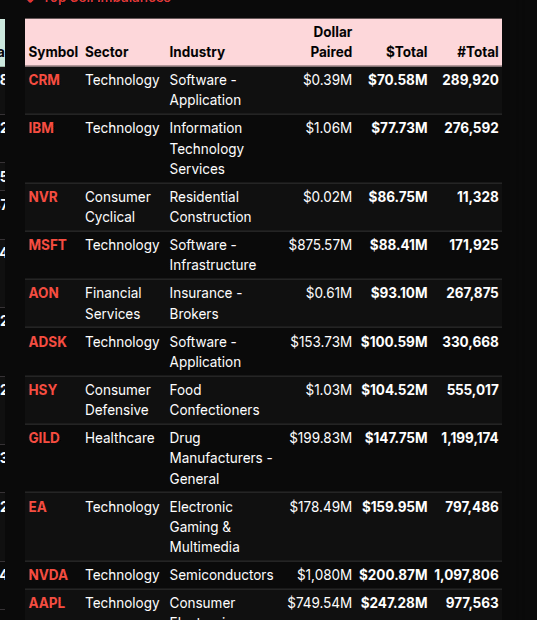
Technology carried the heaviest sell imbalance at –$713M (68.5% sell-side), led by large outflows in NVDA (–$200.9M), AAPL (–$247.3M), and MSFT (–$88.4M). Consumer Cyclical (–$85.4M) and Real Estate (–$94.5M) also saw modest outflows. In contrast, Energy (+$248.8M), Financials (+$188.7M), and Healthcare (+$34.6M) attracted inflows, showing traders rotating into more value-oriented and defensive sectors as tech took profits into expiration.
The S&P imbalance segment itself showed –53% leaning to sell, while the Nasdaq (NQ) registered a deeper –64.5% sell bias. Yet the NYSE composite held a +55.7% buy tilt, illustrating how energy, healthcare, and financials offset tech liquidation into the bell. Despite OPEX volatility, breadth steadied, and buyers controlled the final 90 minutes, keeping the ES anchored above 6700 into the weekend.
MIM
Technical Edge
Fair Values for October 20, 2025:
-
SP: 37.7
-
NQ: 161.27
-
Dow: 197.61
Daily Breadth Data 📊
For Friday, October 17, 2025
-
NYSE Breadth: 55% Upside Volume
-
Nasdaq Breadth: 49% Upside Volume
-
Total Breadth: 50% Upside Volume
-
NYSE Advance/Decline: 51% Advance
-
Nasdaq Advance/Decline: 41% Advance
-
Total Advance/Decline: 45% Advance
-
NYSE New Highs/New Lows: 30 / 52
-
Nasdaq New Highs/New Lows: 74 / 139
-
NYSE TRIN: 0.95
-
Nasdaq TRIN: 0.72
Weekly Breadth Data 📈
For Week Ending October 17, 2025
-
NYSE Breadth: 57% Upside Volume
-
Nasdaq Breadth: 55% Upside Volume
-
Total Breadth: 55% Upside Volume
-
NYSE Advance/Decline: 64% Advance
-
Nasdaq Advance/Decline: 59% Advance
-
Total Advance/Decline: 61% Advance
-
NYSE New Highs/New Lows: 230 / 136
-
Nasdaq New Highs/New Lows: 564 / 296
-
NYSE TRIN: 1.36
-
Nasdaq TRIN: 1.15
Today’s BTS Levels:
ES Z
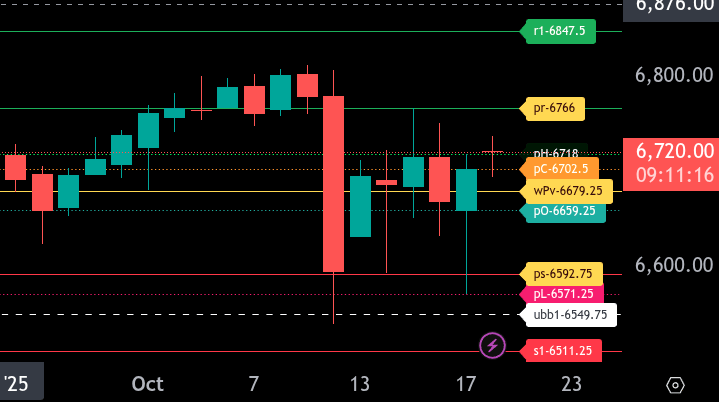
The bull/bear line for the ES is at 6679.25. This is the key pivot level to determine the directional bias for the session. Above this level, the tone turns bullish, while sustained trade below favors sellers.
Currently, ES is trading around 6719.50 in the Globex session, modestly above the bull/bear line, showing early strength after a volatile Friday. If the ES can hold above 6679.25, the next resistance levels to watch are 6718 and 6766, which serves as the upper range target. A breakout above 6766 could extend toward 6847.50.
On the downside, initial support sits near 6702.50, with additional levels at 6659.25 and 6592.75, the lower target level.
Intraday traders should note that 6679.25 is the balance point — holding above keeps the bias long toward 6766 and 6847.50, while slipping back below it shifts the focus toward 6592.75 and 6571.25.
Overall, sentiment leans cautiously bullish as long as ES maintains above 6679.25, but a rejection from the 6766 resistance area could trigger renewed selling pressure.
NQ Z
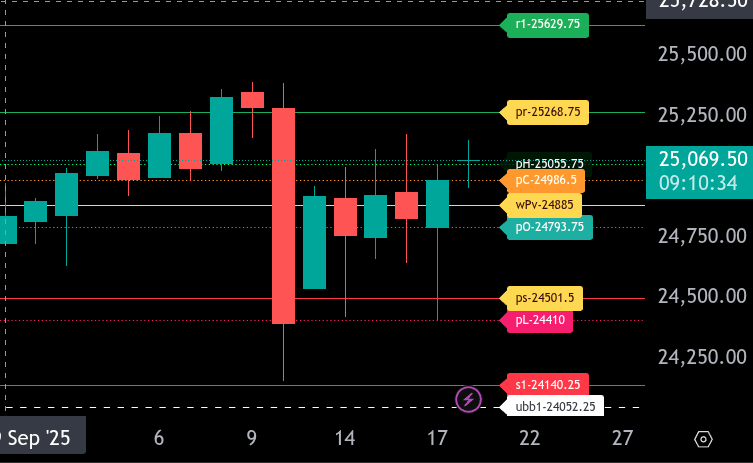
The bull/bear line for the NQ is at 24,885. This level marks the key pivot for determining intraday direction. Trading above 24,885 favors the bulls, while sustained action below it indicates bearish control.
Currently, NQ is trading around 25,068, showing strength above the bull/bear line. If the market can hold above 24,885, the next upside objective is 25,268, which is the upper range target. A continued rally through that area opens the door for a test of resistance at 25,629.
On the downside, initial support is found at 24,793 and then 24,501, the lower range target. A break below 24,501 could extend the decline toward deeper support near 24,140.
Overall, intraday sentiment is bullish above 24,885 with potential for continuation higher toward 25,268 and possibly 25,629. Should price fall back below 24,885, expect sellers to regain control, targeting 24,501 and below.
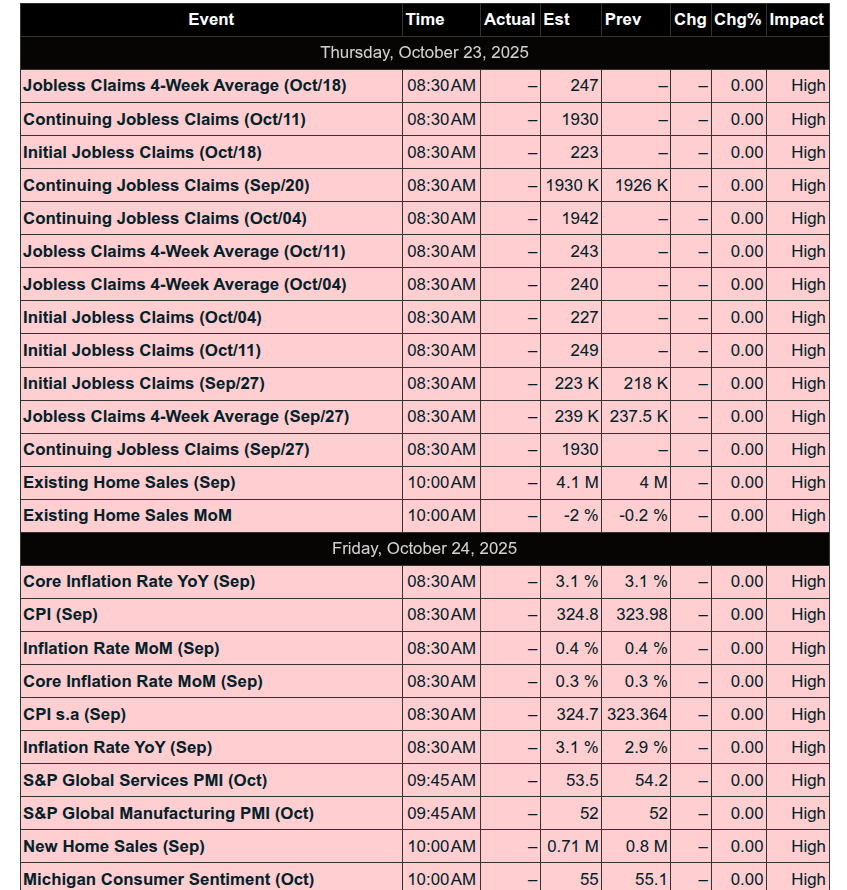
Calendars
Today’s Economic Calendar
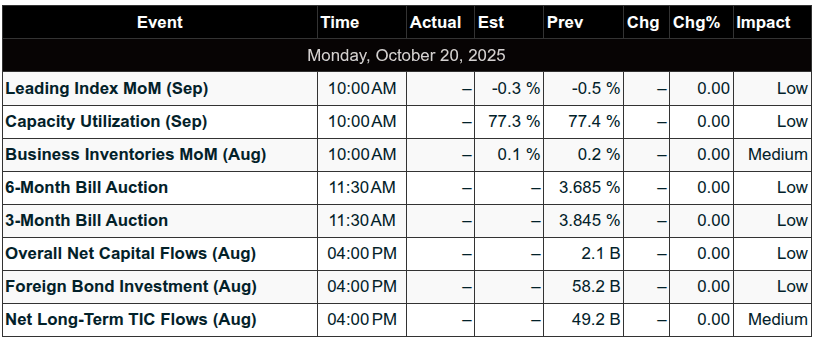
This Week’s Important Economic Events
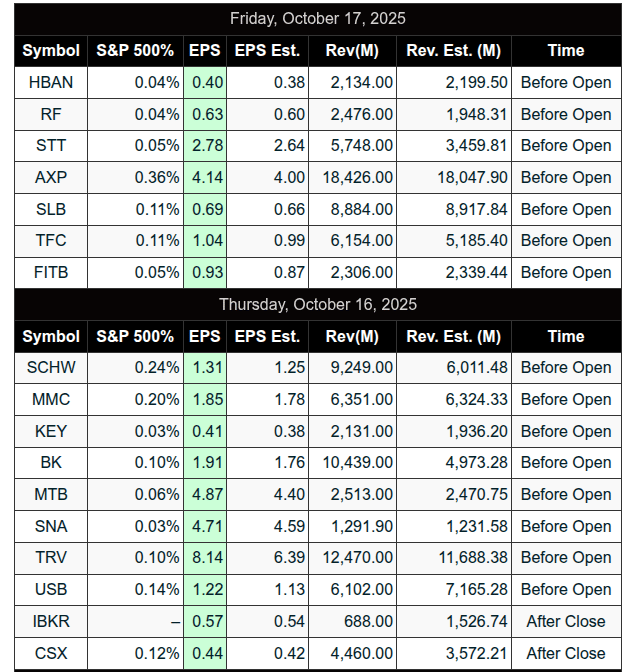
Today’s Earnings
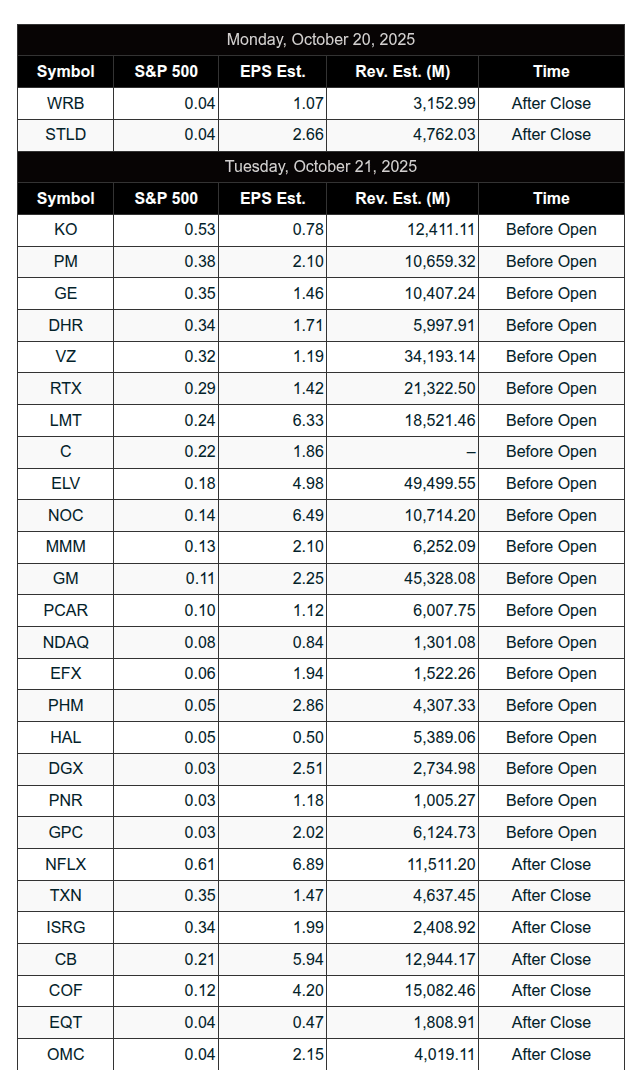
Recent Earnings
Room Summaries:
Polaris Trading Group Summary – Friday, October 17, 2025
The PTG room closed out the week on a high note with strong price action, well-respected levels, and highly disciplined execution. Manny and David led the room with sharp calls and insightful commentary, while members engaged in deep discussions around journaling, structure, and technical strategy.
Key Trades & Highlights
-
Textbook LB&F Setup Hits Big Early:
Manny called out a continuation of Thursday’s “Look Below & Fail” setup at ES 6593, which reclaimed and ripped higher.-
Entry: Around 6600
-
Targets Hit: Up to 6680, with a +70pt runner logged
-
This was a clean higher-low retest, textbook execution based on a well-planned thesis from the prior day.
-
-
Pre-market Zone Action:
-
David noted the dip below the Money Box followed by a reclaim to LIS (6655) as the key overnight trade.
-
Bulls were eyeing C&C (Clear & Convert) of 6655 to push higher, which played out well in the morning.
-
-
Midday Fade:
-
A nice fade from the AM high netted Manny another +10 pts, closing out his final position.
-
Slatitude and others executed successful short trades off David’s green zones—emphasizing using key levels as guides.
-
-
Power Hour Ram:
-
David noted a final push in the last hour (“Ram job”), signaling a directional grind to close the session.
-
MOC (Market On Close) action was flat, with David humorously calling it “mice nutz.”
-
Lessons & Takeaways
-
Preparation Pays:
Manny’s setup from the previous day played out exactly as planned. A great reminder that quality trade ideas often require patience. -
Journaling as a Growth Tool:
Manny shared a snapshot of his physical trade journals, emphasizing their value in building pattern recognition and trade memory.-
“Just too much to remember it all. I try to write as much down as I can.”
-
-
Time Windows Mattered:
Manny provided an intraday timing guide that nailed the AM high window (10:00–10:55) and lunch lows (11:00–12:15). Members were attentive to these zones for trade opportunities. -
Community Wisdom:
There was a strong focus on deliberate practice, discipline, and simplification.
Slatitude’s reflections on taking “risky probes” with tight stops and improving patience showed a trader’s journey in real-time. -
Larger Time Frame Structure:
Manny confirmed using the 60-minute chart for structure, and tighter timeframes for execution—a key takeaway for balancing macro view with precise entries.
Final Thoughts
-
A great Friday finish to the week.
-
Members capitalized on prepared setups, practiced patience, and refined execution.
-
Room discussions were rich in insight, from trade management to mindset.
Biggest Lessons:
-
Prepare your levels, respect the structure, and log your process.
-
Journaling and backtesting build confidence, even from small sample sizes.
-
Stay flexible—but stay focused.
DTG Room Preview – Monday, October 20, 2025
-
Macro & Geopolitics: U.S. equities extended Friday’s gains after President Trump signaled a potential softening of China tariffs, citing them as “not sustainable.” Treasury Secretary Bessent will meet with Chinese Vice Premier He Lifeng this week amid improving relations. Meanwhile, the government shutdown enters its third week with economists warning of a short-term GDP drag.
-
Inflation Watch: Despite shutdown-related delays, the Bureau of Labor Statistics aims to release September CPI this Friday. Inflation remains a key concern.
-
China Trade Tactics: Tensions rise as the U.S. criticizes China’s rare-earth export controls. Analysts note Beijing is now using the same legal strategy—foreign direct product rule—that the U.S. has long leveraged against China.
-
Tech & Earnings: Apple’s iPhone 17 is off to a strong start, with U.S. and China sales up 14% YoY. Premarket earnings: PAC, SMMT. After-hours: AGNC, CCK, STLD, WRB.
-
Economic Calendar: CB Leading Index due at 10:00am ET.
-
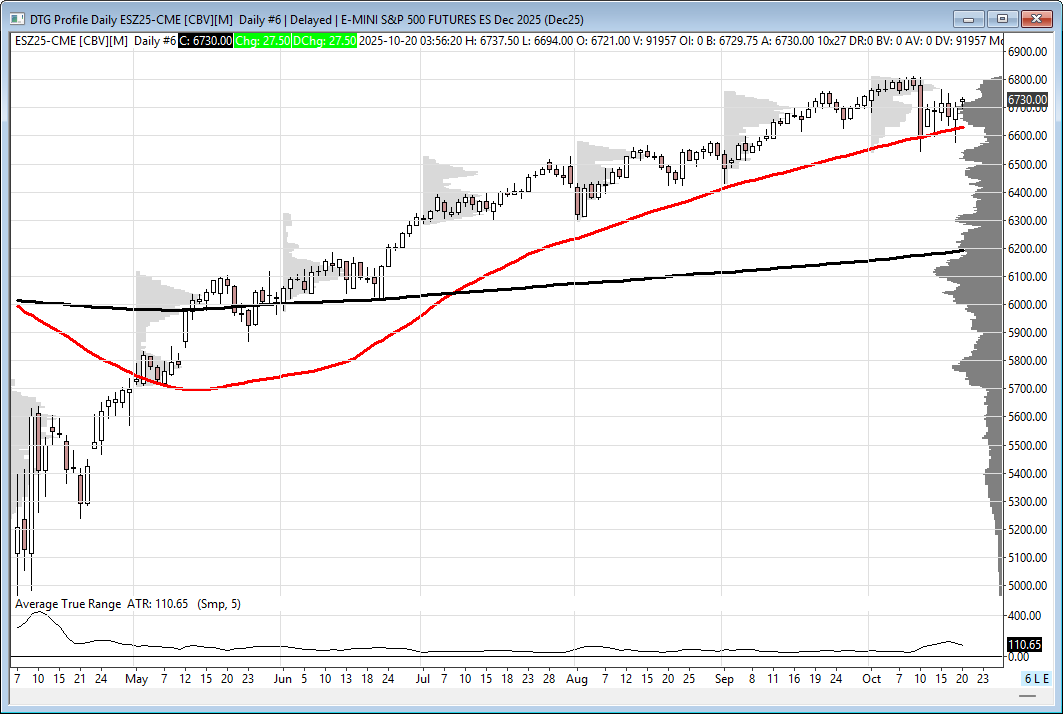
Market Technicals: Volatility eased Friday; ES 5-day ADR dropped to 125.25 points. No significant whale volume overnight. ES remains within a short-term uptrend channel after rebounding from its 50-MA (6630.75). Key trendline levels to watch:
-
Resistance: 6861/66, 6954/49, 7150/55
-
Support: 6600/05
-
Affiliate Disclosure: This newsletter may contain affiliate links, which means we may earn a commission if you click through and make a purchase. This comes at no additional cost to you and helps us continue providing valuable content. We only recommend products or services we genuinely believe in. Thank you for your support!
Disclaimer: Charts and analysis are for discussion and education purposes only. I am not a financial advisor, do not give financial advice and am not recommending the buying or selling of any security.
Remember: Not all setups will trigger. Not all setups will be profitable. Not all setups should be taken. These are simply the setups that I have put together for years on my own and what I watch as part of my own “game plan” coming into each day. Good luck!
This post goes out as an email to our subscribers every day and is posted for free here around 2 PM ET. To get your real-time copy, sign up for the free or premium version here: Opening Print Subscribe.
Comments are closed