This post goes out as an email to our subscribers every day and is posted for free here around 2 PM ET. To get your real-time copy, sign up for the free or premium version here: Opening Print Subscribe.
They Sell the Close, They Buy the Globex
Missed Opportunities:
Despite profit on Setup #5, Manny acknowledged he “missed the better setup” (#4 Long) and took more risk than necessary.
Lesson: Don’t let early wins blind you to better-structured trades ahead.
Follow @MrTopStep on Twitter and please share if you find our work valuable!
FREE Two-Week Offer for the Opening Print Premium. Open up the Lean and other premium features for the next Two Weeks!
Our View
What I Know:
-
The best way to buy the ES is to put in low-ball bids at night.
-
Selling the early morning rallies and buying the pullbacks has been working perfectly.
-
If the ES rallies late in the day, don’t get fooled—get out. They always sell off into the imbalance and after.
-
The ES and NQ are trading in a big back-and-fill.
-
The ES and NQ are setting up for new all-time highs.
I really do not know what else to say. If I am wrong, I dust myself off and start over.
Our Lean
The push up to 6863.75 put the ES just a few points away from a big line of buy stops that run all the way up to 6920–6923. Unless there is a big surprise this morning, we should see the same pattern: early rally, sell-off, and rally again.
The thing I keep screwing up is trying to be long into the late rally and into the imbalance. But the ES and NQ have been getting sold before the 3:50 imbalance for weeks. They trade down after 4:00 and then rally on Globex. Literally, this happens every day.
One of my main trading rules is that the ES never does what most people want it to do when they want it. It’s just not that easy. After a big run-up, I think it’s better to see a rest period—some pops, some drops, and some inside trading-range days.
Yes, I want the pop, and I think it’s coming. I just don’t know if it’s going to be today, tomorrow, or FRYday’s November week one option expiration, but it is coming.
Our lean: Keep buying the 40 to 60-point pullbacks—it’s been working—and look for higher closes.
$GS #GoldmanSachs #CTA #Fund #FLOWS $YM $MYM $DIA $DJD $DJIA $ES $MES $SPY $IVV $VOO $SPLG $SPYM $SPXL $SPXS $SSO $UPRO $NQ $MNQ $QQQ $QQQM CTAs Are we blue in the face yet? This cohort was the most broadcasted as of late – according to GS estimates, CTAs sold $23B of US equities in November (or ~$1.2B avg per day). As of Friday, we estimate the following: Over the next 1 week… Flat tape: Buyers $15.62B ($5.12B into the US) – or ~$1.02B per day (skewed to S&P) Up tape: Buyers $19.22B ($4.34B into the US) Down tape: Sellers $14.42B ($1.95B out of the US) Over the next 1 month… Flat tape: Buyers $37.09B ($12.04B into the US) Up tape: Buyers $61.43B ($14.73B into the US) Down tape: Sellers $142.34B ($51.95B out of the US)
US Money-Market Fund Assets Hit Historic $8 Trillion Milestone
On December 2, U.S. money-market funds reached a landmark achievement by surpassing $8 trillion in assets under management (AUM) for the first time ever, according to data from Crane Data, a leading research firm specializing in money-market and mutual funds. This record reflects a surge of approximately $105 billion in the week ending Monday, December 1, driven by sustained investor inflows amid competitive yields.
Key Details from Crane Data
-
Total AUM: Over $8 trillion (exact figure: $8.105 trillion as of December 1).
-
Weekly Inflow: +$105 billion, marking the latest in a series of record-breaking weeks.
-
Year-to-Date Inflows: More than $848 billion poured into these funds in 2025 alone, highlighting their appeal as a safe, high-yield parking spot for cash.
-
Yield Snapshot: The seven-day yield on the Crane 100 Money Fund Index (tracking the 100 largest funds) stood at 3.80% as of December 1, offering attractive returns compared to traditional bank savings accounts (which average around 0.6%).
Why Investors Are Flocking to Money-Market Funds
Even as the Federal Reserve implements interest-rate cuts, money-market funds continue to draw capital due to their liquidity, stability, and yields that outpace many alternatives like CDs or high-yield savings accounts. These funds invest in short-term, low-risk securities such as Treasury bills, commercial paper, and repurchase agreements.
Annual dividends from these funds are now estimated at around $500 billion, providing a massive income stream for investors.
In Comparison:
-
The Investment Company Institute (ICI), which excludes certain internal funds, reported $7.57 trillion in AUM for the week ending November 25—about $500 billion lower than Crane’s broader tally.
-
Earlier in November, Crane tracked assets at $7.982 trillion, showing the rapid climb toward the $8T threshold.
Broader Context and Implications
This milestone underscores a “wall of cash” phenomenon, where investors are holding record levels of liquidity rather than shifting into riskier assets like stocks or longer-term bonds. Analysts note that while absolute cash holdings are at all-time highs, they represent a relatively small slice of total U.S. household wealth—potentially signaling caution in the market.
Crane Data’s Peter Crane had previously forecasted this $8T level, and it arrived ahead of some 2026 projections.
For historical perspective, money-market AUM has more than doubled since early 2022, fueled by rising rates and economic uncertainty. Globally, U.S. funds dominate, accounting for about 57% of the $12.3 trillion in worldwide money-market assets as of Q2 2025.
Market Recap
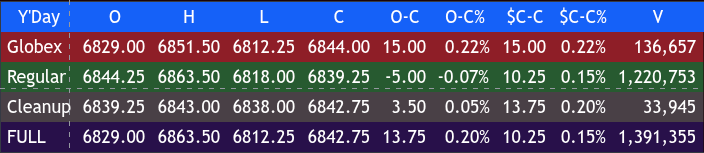
After Monday’s weak finish, the ES traded down to 6812.25, rallied up to 6851.50 on Globex, and opened Turnaround Tuesday’s regular session at 6844.25, up 15.25 points or +0.22%.
After opening at 6841.00, the ES rallied up to 6854.00, sold off down to 6839.75, traded up to 6858.00 at 10:30, and then rallied to a new high at 6863.50 at 11:00. From there, it sold off 45.75 points down to 6817.75 at 11:30, followed by a sideways-to-up back-and-fill pattern until 12:10 before popping up to 6853.25 at 12:30.
After the pop, it traded at 6840.75 at 1:20, rallied to 6844.25 at 2:05, sold off down to 6832.25, rallied again to 6853.50 at 3:30—and that’s when the ES started to downtick. It traded 6839.50 as the 3:50 imbalance came out showing $1 billion to buy, which flipped to $1.8 billion to sell. The ES traded down to 6838.00 at 3:55, then 6839.25.
After 4:00, the ES flatlined and settled at 6842.75, up 13.50 points or +0.20%, and has now been up 7 of the last 8 sessions. The NQ settled at 25,606.00, up 214.75 points or +0.85%, and has been up 6 of the last 7 sessions.
In the end, the ES and NQ did close higher, but it was one of the choppiest trading sessions in a long time.
In terms of the ES’s overall tone, the NQ was the leader. In terms of the ES’s overall trade, volume was steady at 1.404 million contracts traded.
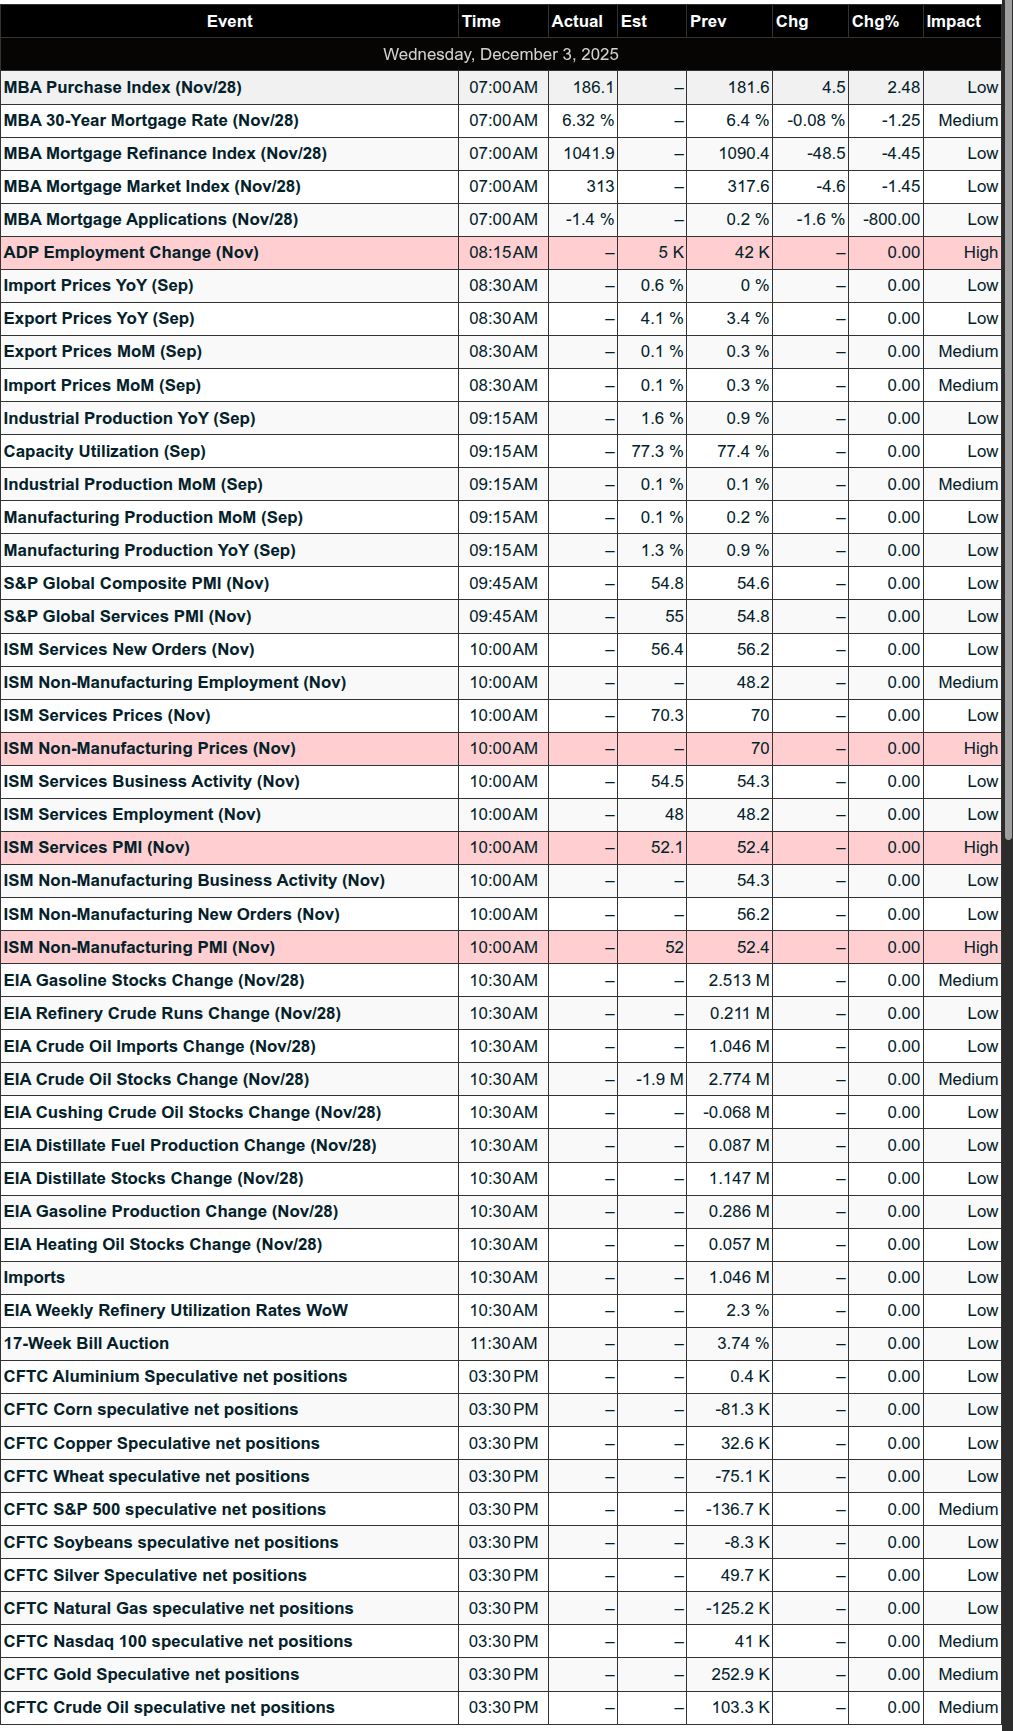
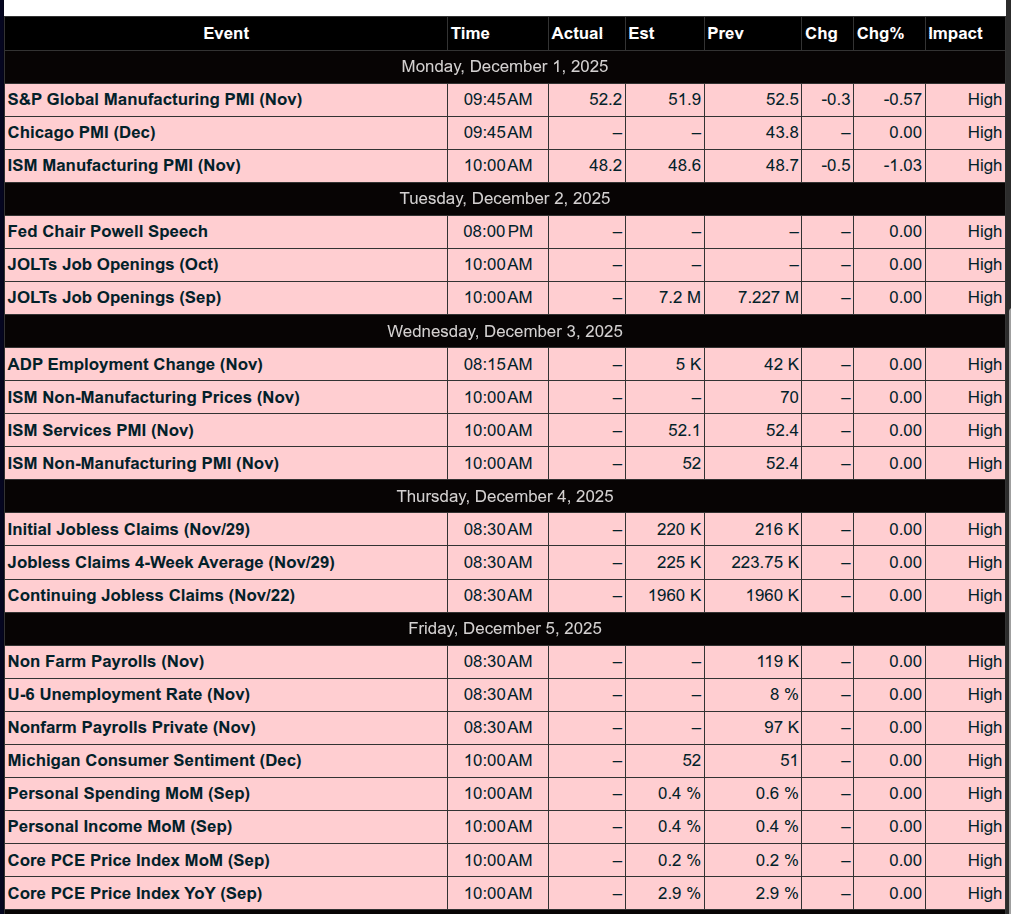
I’m going to cut today’s OP short. Today is eco-day:
-
Mortgage Market Index at 7:00 a.m. EST
-
ADP National Employment Report at 8:15 a.m. EST
-
S&P Final Services PMI at 9:45 a.m. EST
-
ISM Services PMI at 10:00 a.m. EST
-
EIA Crude Oil Inventories report at 10:30 a.m. EST
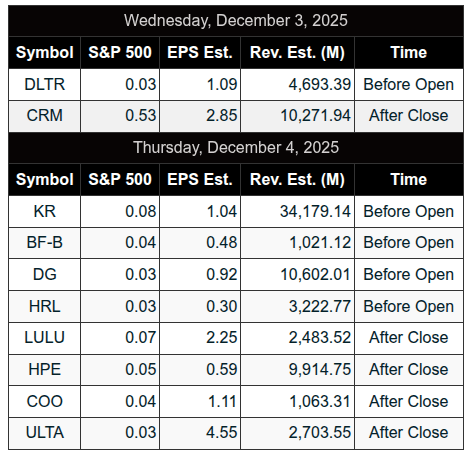
Salesforce and Snowflake report earnings after the close.
Guest Posts

S&P 500 (ES)
Prior Session was Cycle Day 2: The Chop Was Real, The Patience Was Required
Market Rhythm
Welcome to Cycle Day 2 — the day that traditionally behaves like a caffeinated toddler with a Nerf bat. True to form, CD2 delivered turbulence, a two-way draw, and enough psychological warfare to make Sun Tzu crack a smile.
Overnight ES tagged the lower target zone with a clean buy response, then probed the upper objective from the DTS plan. From the open, the market played the classic CD2 game:
look strong → look weak → gaslight everyone → repeat.
As stated in the DTS:
“Both sides shuffle for position and attempt to gas-light each other into submission.”
Check. Verified. Signed in blood.
Range was 51 handles on 1.391M contracts traded.
For greater detail of how this day unfolded, click on the Trading Room RECAP 12.2.25 link.
…Transition from Cycle Day 2 to Cycle Day 3
Transition into Cycle Day 3: “Wild-Card Wednesday: Squeeze Play or Ambush?”
The initial Cycle Target at 6849.37 has already been tagged and bagged during the prior session, officially checking the Cycle Day 3 prerequisite box. With that milestone secured, the Chicago Bulls have the tactical high ground — for now.
They’ve staked out additional upside cycle targets in the 6878.56 → 6900.96 corridor. But before they start planting victory flags, price still needs to Clear and Convert the prior high at 6863.50. Only then can they establish upper-structure dominance and trigger the classic CD3 squeeze play that sends shorts scrambling for fire exits.
But… this is CD3 — and nothing is ever guaranteed.
Standing opposite the field: the Chicago Bears, sharpening their claws and eyeing a counteroffensive. Their mission is simple and brutal:
-
Break 6802 (Cycle Day 1 Low)
-
Seize the lower corridor
-
Open the chute toward 6775 → 6761.50 radar targets
A clean break below 6802 would flip the script fast, shifting the day from “Bulls managing momentum” to “Bears initiating a controlled demolition.”
Given that the initial 3-Day Cycle target has already been fulfilled, we’re labeling today a full-blown “Wild-Card Session.”
Translation:
Expect misdirection, traps, velocity shifts, and a lot of traders pretending they knew it was coming all along.
Stay nimble, stay tactical — and let today’s order flow declare which Chicago faction actually showed up to play.
Of course, nothing changes for PTG…Simply follow your plan. Take only Triple A setups and manage the $risk. ALWAYS HAVE HARD STOP-LOSSES in-place on the exchange.
PTG’s Primary Directive (PD) is to ALWAYS STAY IN ALIGNMENT with the DOMINANT FORCE.
As such, scenarios to consider for today’s trading.
Bull Scenario: Price sustains a bid above 6840+-, initially targets 6855 – 6865 zone.
Bear Scenario: Price sustains an offer below 6840+-, initially targets 6825 – 6815 zone.
PVA High Edge = 6851 PVA Low Edge = 6831 Prior POC = 6840
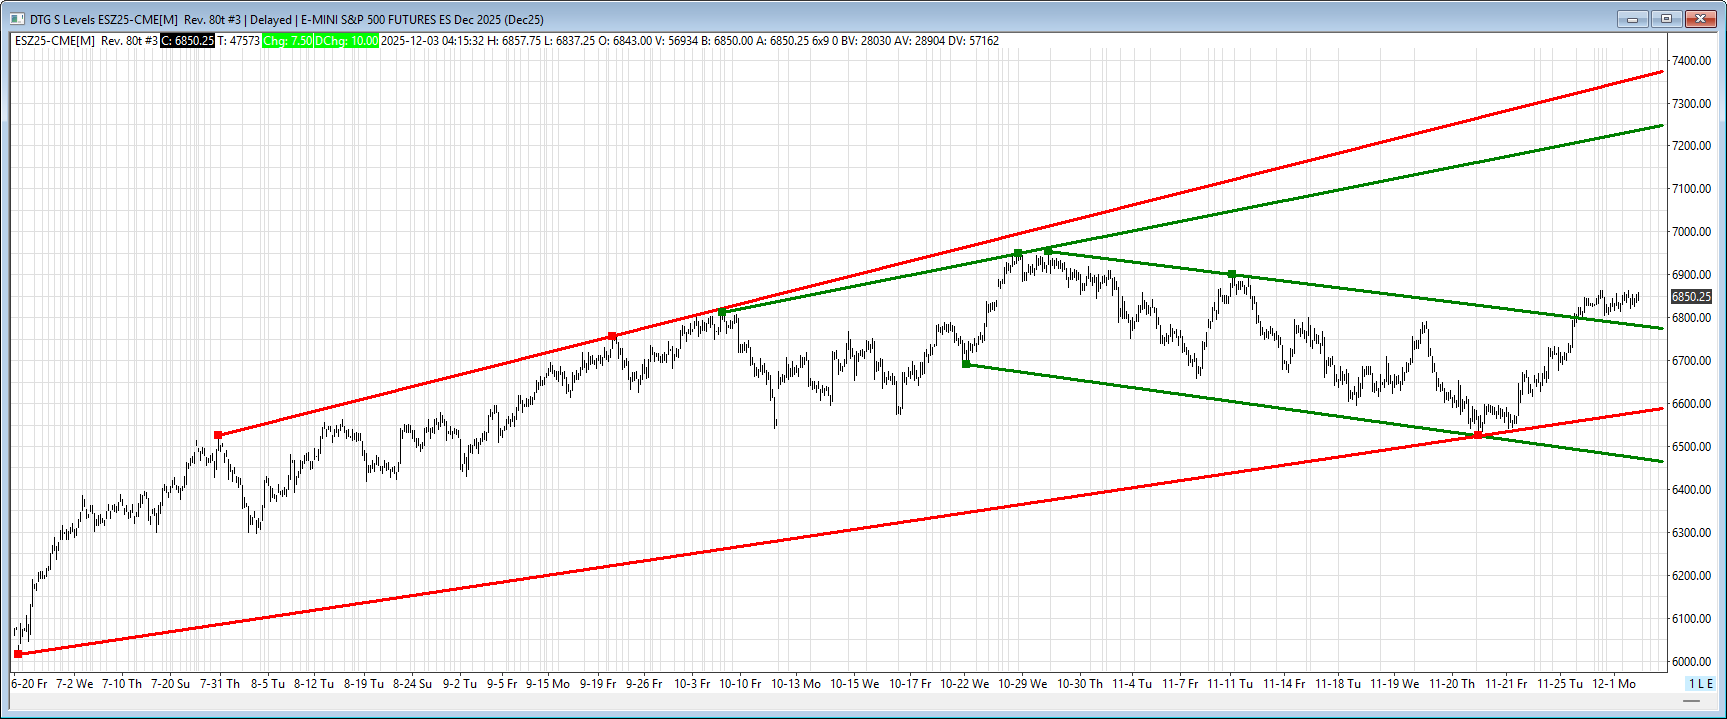
ESZ
Thanks for reading, PTGDavid
MiM
MOC Recap
Market-on-Close Recap – December 2, 2025
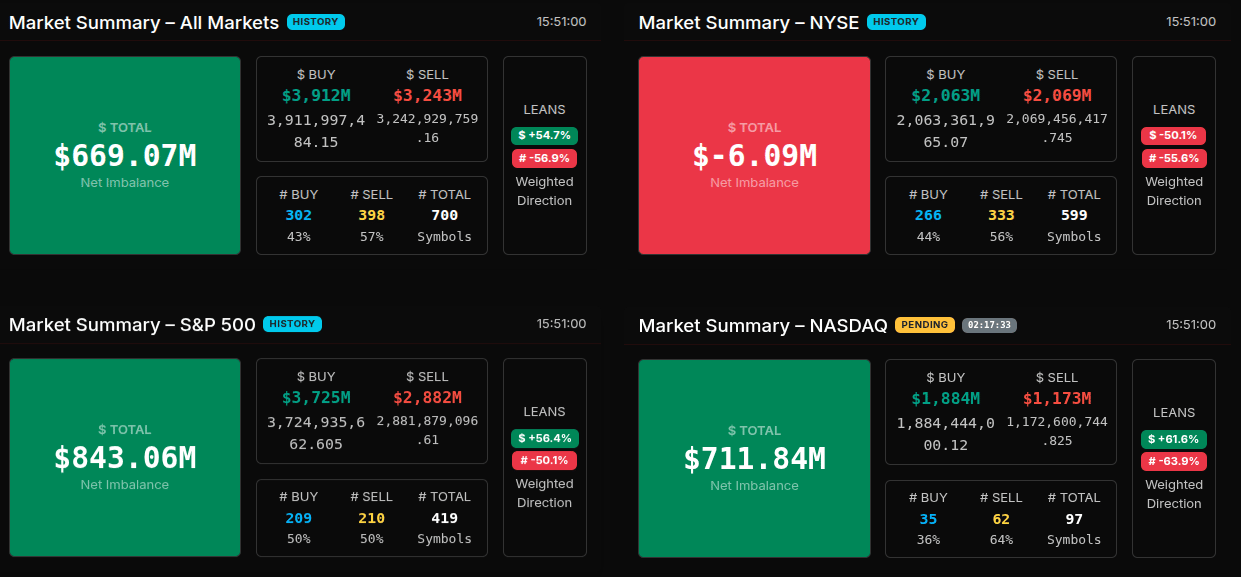
The MOC auction began with an immediate $670M buy imbalance by 15:52, the buyside peaked at $1.06B to buy, but sellers were already responding. The moment buyers pushed, sellers began leaning, setting up the rotational battle that defined this auction. The flow wasn’t about straight‑line buying — it was the struggle between both sides fighting for control as each surge was met with an equal and opposite reaction. And critically, underneath that early buy pressure, the symbol counts told a different story: the number of sell-side symbols outnumbered the buy-side symbols, revealing that sellers were quietly leaning into the auction even as the notional imbalance flashed green.
By 15:54 the auction rotated again, slipping to a $588M sell imbalance as sell programs re-engaged. The most decisive swing came at 15:55 when sell imbalances ballooned to $4.7B, taking the total to a deeply negative $2.29B. This was the wholesale push of the session—an aggressive wave that fits the ‑66% threshold for directional conviction. Yet surprisingly, that pressure did not hold. Within a minute, buy interest returned sharply, flipping the imbalance back to +$265M at 15:56 before settling into a rotational finish.
Sector flow showed the choppiness beneath the surface. Consumer Cyclical ($291M), Industrials ($181M), Technology ($223M), and Communication Services ($275M) led the buy side. Healthcare (-$233M), Energy (-$146M), and Real Estate (-$144M) reflected heavier sell participation. Utilities remained flat and rotational.
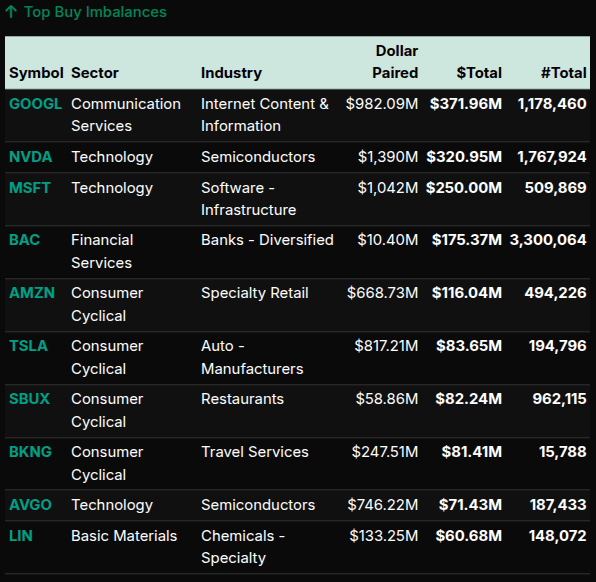
Notable symbol-level buys included GOOG ($372M), NVDA ($321M), MSFT ($250M), BAC ($175M), and AMZN ($116M). On the sell side, XEL, NFLX, and JNJ topped outflows, with several prints exceeding the -66% sell-lean threshold, indicating wholesale pressure from institutions.
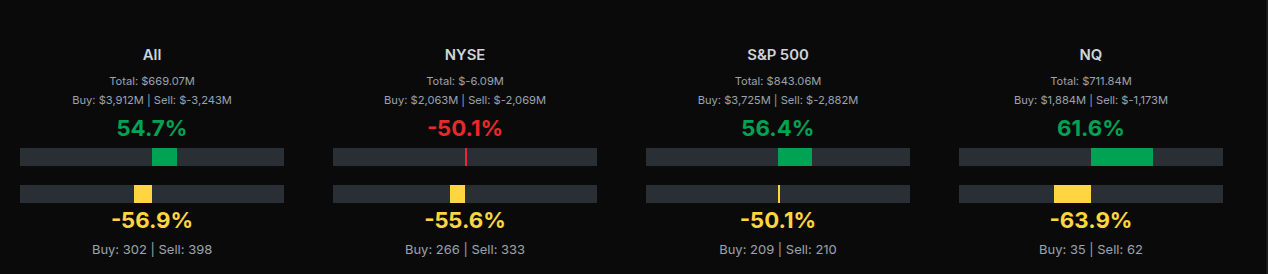
The Nasdaq displayed the strongest buy skew at +61.6%, while NYSE leaned slightly negative at -50.1%. The S&P landed near-neutral but marginally positive. The overall picture: a whipsaw MOC that produced strong rotations rather than a directional trend, with several institutional pushes but no clean dominance heading into the bell.


Technical Edge
Fair Values for December 3, 2025:
-
SP: 10.11
-
NQ: 43.74
-
Dow: 54.93
Daily Market Recap 📊
For Tuesday, December 2, 2025
-
NYSE Breadth: 39% Upside Volume
-
Nasdaq Breadth: 49% Upside Volume
-
Total Breadth: 47% Upside Volume
-
NYSE Advance/Decline: 45% Advance
-
Nasdaq Advance/Decline: 48% Advance
-
Total Advance/Decline: 47% Advance
-
NYSE New Highs/New Lows: 77 / 22
-
Nasdaq New Highs/New Lows: 103 / 135
-
NYSE TRIN: 1.16
-
Nasdaq TRIN: 0.95
Weekly Market 📈
For the week ending Friday, November 28, 2025
-
NYSE Breadth: 69% Upside Volume
-
Nasdaq Breadth: 71% Upside Volume
-
Total Breadth: 70% Upside Volume
-
NYSE Advance/Decline: 85% Advance
-
Nasdaq Advance/Decline: 80% Advance
-
Total Advance/Decline: 82% Advance
-
NYSE New Highs/New Lows: 207 / 64
-
Nasdaq New Highs/New Lows: 384 / 256
-
NYSE TRIN: 2.29
-
Nasdaq TRIN: 1.56
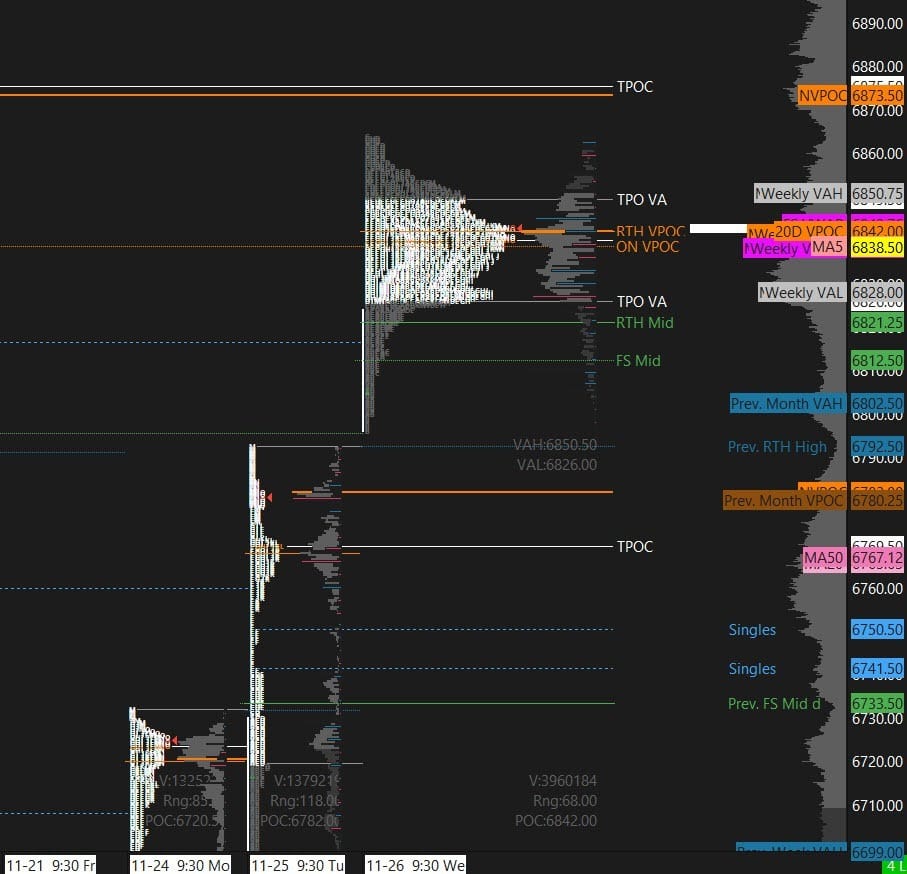
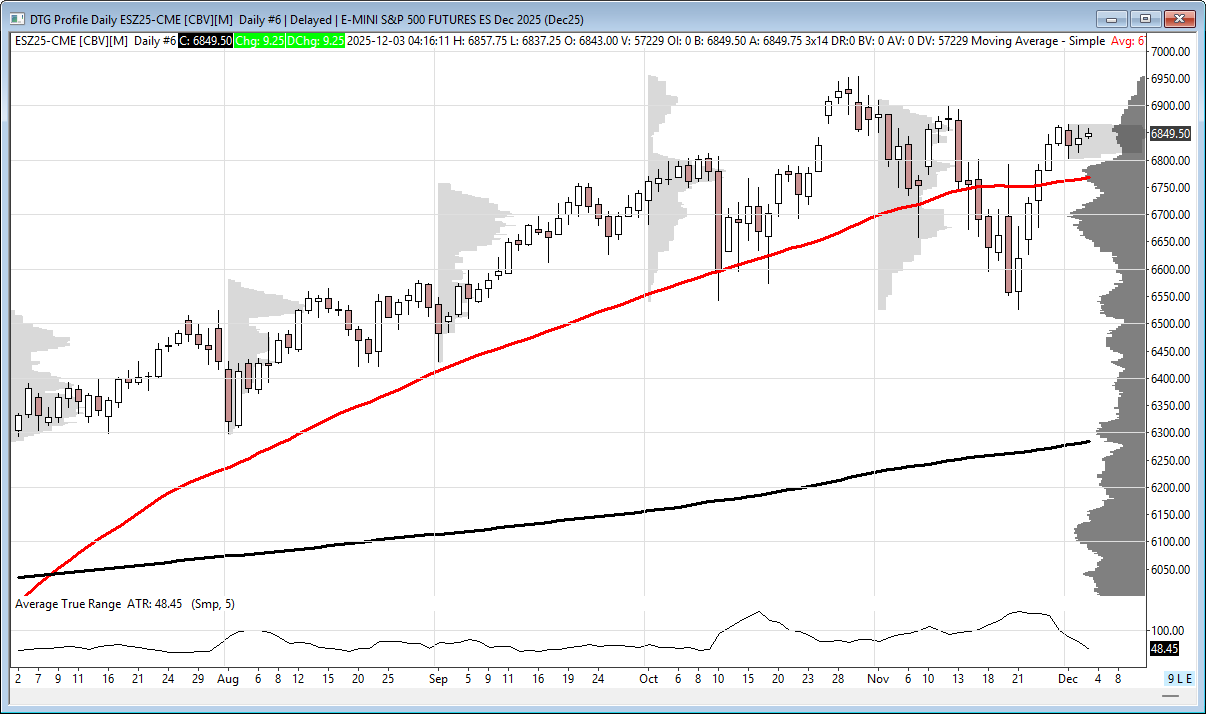
ES Levels
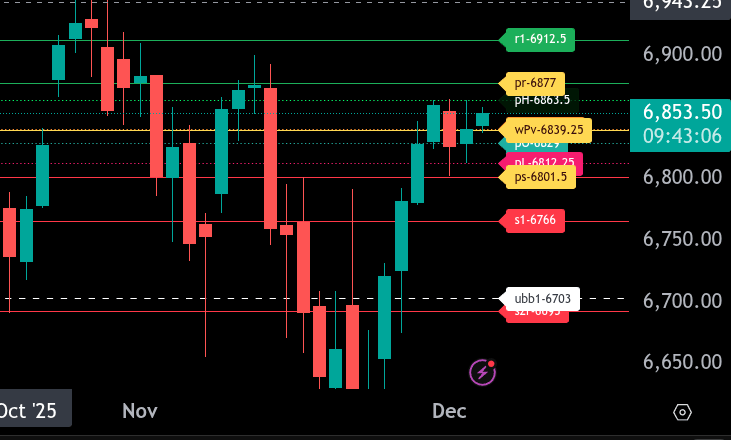
The bull/bear line for the ES is at 6839.25. Trading above this level favors continuation higher; holding below it shifts momentum back to sellers.
ES is currently trading around 6853.75, keeping price above the bull/bear line. If buyers defend this zone, upside continuation targets 6863.5 first and then 6877, which is today’s upper range target. A sustained breakout above 6877 opens the door toward 6912.5.
If ES slips back below 6839.25, look for sellers to press into 6829, then 6812.25. A break below that structure aims for 6801.50, today’s lower range target. Further downside would expose 6766.
Support levels: 6829, 6812.25, 6801.5.
Resistance levels: 6863.5, 6877, 6912.5.
NQ Levels
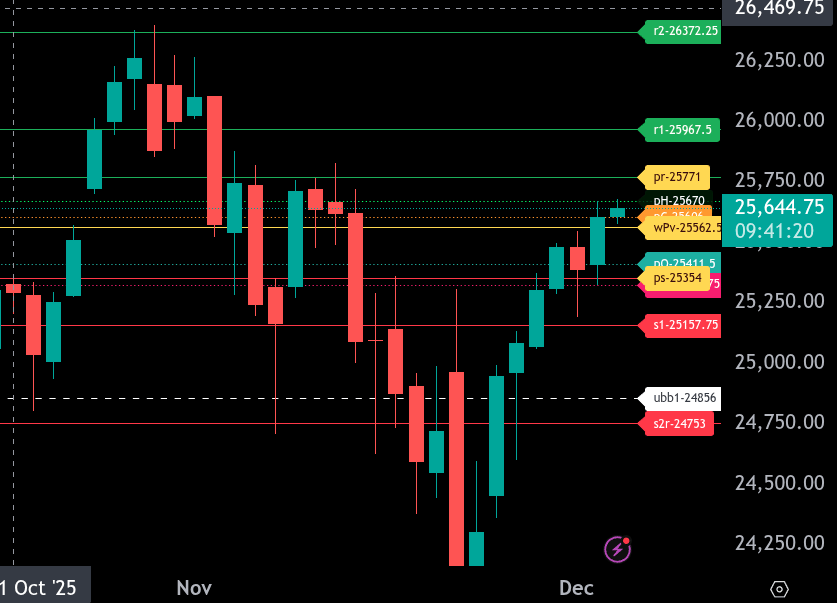
The bull/bear line for the NQ is at 25,562.50. Price is currently trading above this level near 25,645.00, keeping a bullish tone as long as it holds.
On the upside, resistance sits first at 25,606.00 and then 25,670.00. A break over these opens the path toward 25,771.00, the upper range target. Above that, 25,967.50 is the next major resistance.
On the downside, support begins at 25,411.50, followed by 25,354.00 and 25,324.75. A deeper pullback could reach 25,157.75.
Overall, staying above 25,562.50 favors continued strength toward 25,671.00 and 25,771.00. Losing 25,562.50 shifts momentum back toward the support band at 25,411.50 to 25,324.75.
Calendars
Economic
Today
Important Upcoming / Recent
Earnings
Upcoming
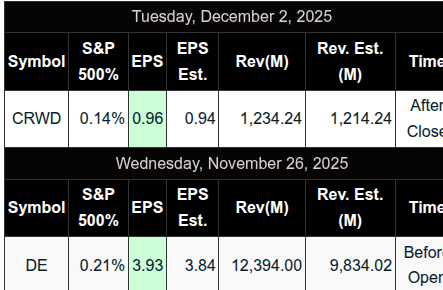
Recent
Trading Room Summaries
Polaris Trading Group Summary – Tuesday, December 2, 2025
Tuesday unfolded as a classic Cycle Day 2 — a day known for its two-way trade, chop, and emotional traps. Traders were reminded early that this rhythm is often full of “range runner” moves, requiring discipline and patience. While the day didn’t deliver a smooth directional trend, it did provide opportunity for traders who were nimble and focused on the setups.
Key Positive Trades:
-
Setup #5 – Resistance Sell 6859–6863 (ES)
Manny nailed this trade early, scoring +5 and +8 points on a counter-trend move. While he later called it a “risky” trade in hindsight, it worked to plan and delivered clean gains.
Lesson: Respect your trade plan and take the meat of the move. -
Setup #4 – Continuation Long 6839–6843 (ES)
This long setup triggered shortly after the Resistance Sell, and while Manny missed the ideal entry, he acknowledged its quality.
Lesson: Prioritize planned setups over gut feel counters, even if you find short-term success elsewhere. -
Crude Oil (CL) Open Range Short
David confirmed TGT1 & TGT2 fulfilled on the OR Short, followed by a well-timed trail stop before an oil spike on geopolitical news (Putin headlines).
Lesson: When trading volatile products like CL, use your targets and manage exits actively. -
NQ (Nasdaq Futures) Opening Range Long
David guided the room through a measured long in NQ, hitting TGT1, then TGT2, and trailing the stop to protect profits.
Lesson: OR setups in NQ continue to show positive stats and offer clear execution structure.
Challenges & Lessons Learned:
-
Choppy Range:
David and others called out “range runner rhythms” early. The price action moved violently in both directions without conviction, often reversing quickly.
Lesson: On Cycle Day 2s, size down or sit out unless you have alignment and confirmation. -
Emotional Discipline:
Manny shared valuable personal insight on avoiding revenge trading and emotional reactions to the tape:
Market Context:
-
The bullish scenario above 6830 played out briefly, with targets hit near the 6855–6865 resistance zone.
-
News headlines (Putin threatening Ukraine tanker strikes) caused spikes in Crude Oil, which reversed quickly.
-
The MOC imbalance flipped from a $1B buy to a sell, reflecting the indecision and chop of the day.
-
ES closed near mid-session VWAP, typical of a Cycle Day 2.
Key Takeaways:
-
Cycle Day 2 = Chop Zone. Know the environment you’re trading in and adapt expectations accordingly.
-
Stick to setups. Both the continuation long and resistance sell provided structure and reward.
-
Emotions can be costly. Recognizing mental patterns helps traders step back when discipline slips.
Final Word from PTGDavid:
“Range Runner Rhythms will rip you apart… That is what we currently have.”
“Keep your emotions in check.”
Discovery Trading Group Room Preview – Wednesday, December 3, 2025
Morning Market Brief – Nov 22, 2025
-
Equities & Crypto
-
S&P 500 stayed buoyant Tuesday, led by Big Tech (notably Nvidia).
-
Bitcoin rebounded to a 2-week high following its steepest drop since March.
-
-
Commodities
-
Silver hit new record highs (~$58.95/oz), driven by Fed rate cut expectations and supply concerns.
-
ETF silver holdings rose by 200 tons Tuesday—highest since 2022.
-
-
Key Economic Events (Today)
-
8:15am ET: ADP Non-Farm Employment Change – key Fed input with the official jobs report delayed.
-
9:15am ET: Capacity Utilization & Industrial Production
-
9:45am ET: S&P Global Services PMI
-
10:00am ET: ISM Services PMI
-
10:30am ET: Crude Oil Inventories
-
2:00pm ET: President Trump speech
-
-
Retail & Consumer Trends
-
Cyber Week online sales hit a record $44.2B (Adobe Analytics).
-
Consumers pulled back on impulse buys; BNPL usage surged.
-
Wealthier consumers continue to prop up retail (Coresight).
-
American Eagle Outfitters (AEO) jumped 12% premarket on strong holiday performance and earnings beat.
-
-
Tech & AI
-
Anthropic (Claude chatbot) prepping 2026 IPO with Wilson Sonsini.
-
Amazon unveiled “AI factories” for secure, on-premise AI systems using Nvidia chips—targeting corporates/governments.
-
-
Earnings Watch
-
Premarket: Dollar Tree (DLTR), Macy’s (M), Royal Bank of Canada (RY)
-
After close: Snowflake (SNOW), Salesforce (CRM), GWRE
-
Thursday AM: Kroger (KR), Hormel (HRL), Dollar General (DG), AI, FIVE, TD, CM, BMO
-
-
Markets & Technicals
-
Volatility continues to contract; ES 5-day ADR down to 68 points.
-
No major whale activity overnight.
-
ES technical levels:
-
Support: 6782/79, 6767 (50-day MA), 6586/91, 6465/60
-
Resistance: 7248/53, 7375/80
-
-
ES remains sideways, holding above key trendline support.
-
Affiliate Disclosure: This newsletter may contain affiliate links, which means we may earn a commission if you click through and make a purchase. This comes at no additional cost to you and helps us continue providing valuable content. We only recommend products or services we genuinely believe in. Thank you for your support!
Disclaimer: Charts and analysis are for discussion and education purposes only. I am not a financial advisor, do not give financial advice and am not recommending the buying or selling of any security.
Remember: Not all setups will trigger. Not all setups will be profitable. Not all setups should be taken. These are simply the setups that I have put together for years on my own and what I watch as part of my own “game plan” coming into each day. Good luck!
This post goes out as an email to our subscribers every day and is posted for free here around 2 PM ET. To get your real-time copy, sign up for the free or premium version here: Opening Print Subscribe.
Comments are closed