This post goes out as an email to our subscribers every day and is posted for free here around 2 PM ET. To get your real-time copy, sign up for the free or premium version here: Opening Print Subscribe.
They’re Selling AI All Day and Buying the Close — Welcome to Quad Witch Week
Follow @MrTopStep on Twitter and please share if you find our work valuable!
Our View
It’s getting harder to overlook the tech AI liquidation. My question is: despite the ES and NQ rally that brought both futures within spitting distance of their all-time highs, was there continued tech and AI selling going on the entire time? It sure looks that way.
According to Dow Jones market data, Broadcom’s about 18% decline over the last three trading sessions marks its worst 3-day stretch since the March 2020 COVID-19 pandemic and has wiped away more than $300 billion in market value—an amount roughly the size of chip rival AMD.
When you throw in all the AI uncertainties, the deluge of delayed economic reports, the increase in the unemployment rate, and all the other unknown data this week, there is no doubt the markets are spooked.
As the ES and NQ fell yesterday, gold and silver settled near their record highs, while Bitcoin dropped over 3% to $85,806, pushing down other cryptocurrencies.
And it’s not just the jobs number that’s a concern—the U.S. Bureau of Labor Statistics (BLS) is set to release the November 2025 CPI data on Thursday, and that will be followed by Friday’s $5 trillion December Quad Witch expiration.
Our Lean
I have tried to maintain a bullish view, but the AI and economic uncertainties are ‘spooking’ the markets. The NQ just traded down to 25,103.50 and is trading at 25,142.75, down 200 points. I know there are risks to this, but I don’t think the selloff is over.
Our Lean: If the ES gaps sharply lower today, I can’t rule out a bounce—but I think the money trade is selling the big dead cat bounces.
Guest Post: Tom Incorvia – Blue Tree Strategies
Over the past 11 trading sessions, the SPY has exhibited pronounced consolidation. Specifically, the total range from intraperiod low to high has been limited to approximately 1.53%, underscoring an unusually compressed volatility environment.
Some market participants may attribute this stagnation to the absence of meaningful macroeconomic catalysts. Like Federal Reserve Chair Powell – lowering interest rates…that would typically prompt repricing of risk assets. But even with that cutting of short-term interest rates the price action was somewhat muted.
From a trading perspective, this type of environment is particularly challenging. Sustained alpha generation is inherently difficult when markets are confined to narrow ranges, as directional conviction is low and follow-through is limited. Under these conditions, opportunity sets tend to bifurcate: traders can either remain patient and await a decisive breakout that reintroduces trend and momentum, or tactically engage in mean-reversion strategies that capitalize on short-term deviations within the established range.
Until volatility expands and a new regime asserts itself, expectations for outsized returns should remain tempered, with risk management and selectivity taking precedence over aggressive positioning.
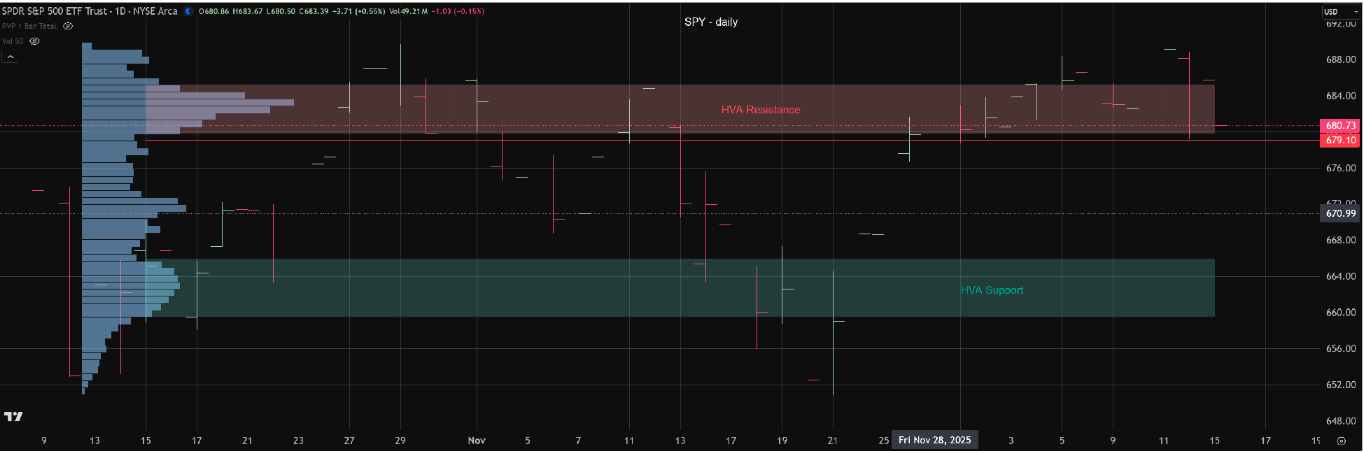
The SPY chart indicates that price action has remained in a balanced, sideways trading regime since October 13. In market profile and auction theory terms, balance reflects a state of uncertainty, where neither buyers nor sellers possess a sustained advantage. Absent a meaningful change in market conditions, this environment suggests the potential for continued range-bound trade.
Notably, prices have spent a disproportionate amount of time near the upper boundary of the balance area. This behavior does not necessarily imply strong supply pressure; rather, it appears to reflect a lack of urgency or follow-through from buyers at higher levels. In other words, upside progress has stalled more from waning demand than from aggressive selling.
Should price break below the 679 level, the probability increases that the market will rotate lower to test the high-volume area (HVA) of demand, currently defined in the 665–660 range. Such a move would be consistent with auction dynamics seeking acceptance at a more active volume node before a new directional bias emerges.
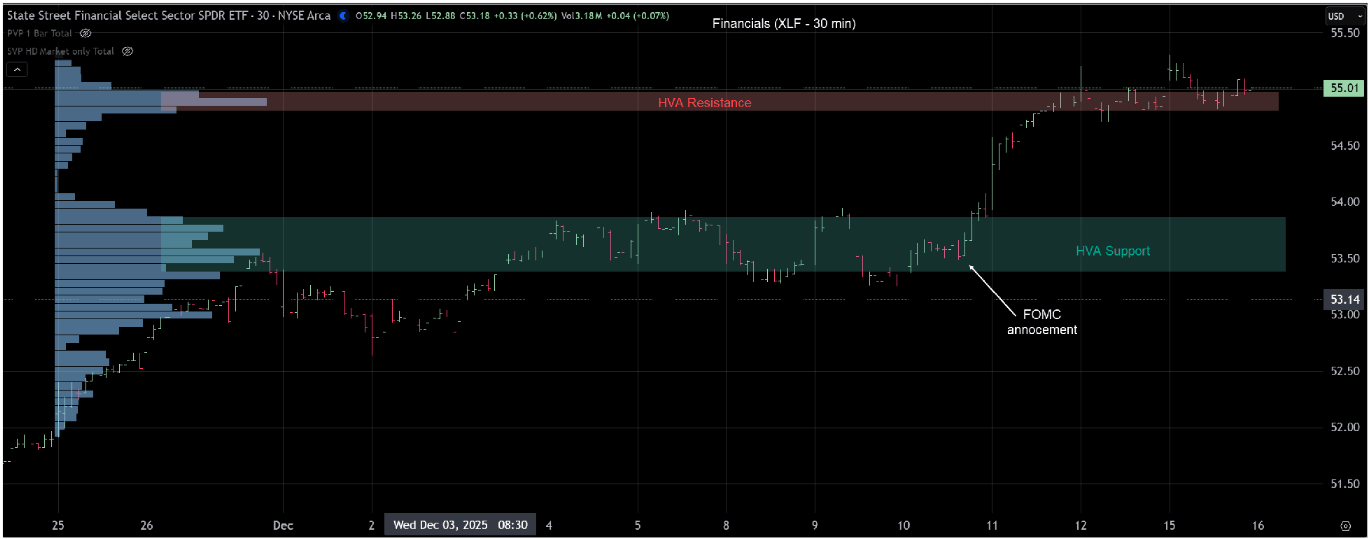
While the broader equity indices remain largely range-bound, sector-level opportunities continue to emerge beneath the surface. Financials, as represented by XLF, recently broke out of a prior balance area, reaching new highs following last Wednesday’s FOMC announcement.
Since the initial breakout, price action has moderated and moved into consolidation. This behavior is typical following an expansion phase, as the market digests gains and evaluates acceptance at higher levels. At this stage, the auction is effectively pausing to determine the next directional impulse.
From here, the focus shifts to whether XLF can build sufficient acceptance to initiate another leg higher, or whether prices will rotate lower to test the high-volume area (HVA) of support. The outcome of this consolidation will likely determine whether the breakout evolves into a sustained trend or resolves into a deeper rotational move.
Tom Incorvia began his career in financial services in 1987 and has amassed over three decades of experience navigating the complexities of the markets. His career spans both the buy-side and sell-side of the trading desks, having served as Vice President of Equity Trading and later as General Partner of a hedge fund. This dual perspective has provided him with a unique and well-rounded understanding of market behavior.
You can purchase Tom’s Course on Volume Profile here.
Market Recap
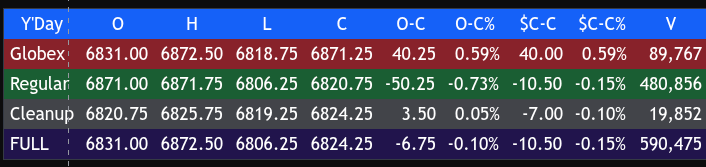
The ES traded up to 6872.50 on Globex, up 40 points or +0.59%, and opened Monday’s regular session at 6871.25. After the open, the ES traded 6872.00, sold off 66 points down to 6806.00 at 10:25, rallied up to 6834.75, pulled back to 6819.00 at 11:00, rallied up to 6844.00 at 11:25, sold off down to 6814.75 at 11:45, traded up to 6831.00 at 11:55, sold off down to 6807.50 at 12:50, rallied up to 6825.25 at 1:15, and traded up to 6829.00 at 2:04.
It then back-and-filled in a 5 to 7-point range for the next 40 minutes, rallied up to 6831.25 at 2:55, pulled back to 6819.00 at 3:40, and traded 6825.75 as the 3:50 imbalance showed a modest $300 million to buy. It then traded up to 6829.75 and sold off down to
6822.75, before trading 6820.25 on the 4:00 cash close.
After 4:00, the ES traded 6819.25, flat-lined, and settled at 6823.00, down 7.75 points or -0.11%. The NQ settled at 25,093.25, down 120.25 points or -0.48%, marking its third straight down session, off -2.75% over that stretch.
The same thing that haunted the markets last Friday showed up again in yesterday’s trade: Broadcom and other AI stocks.
In the end, I’m not quite sure why things slowed so much, but most of the ES’s trading range was between 10 to 15 points. In terms of the ES’s overall tone, the NQ weakness continues to dominate the tape. Dec contracts had just 590K traded and the new April 2026 contracts took volume lead trading 975K.
On Tap
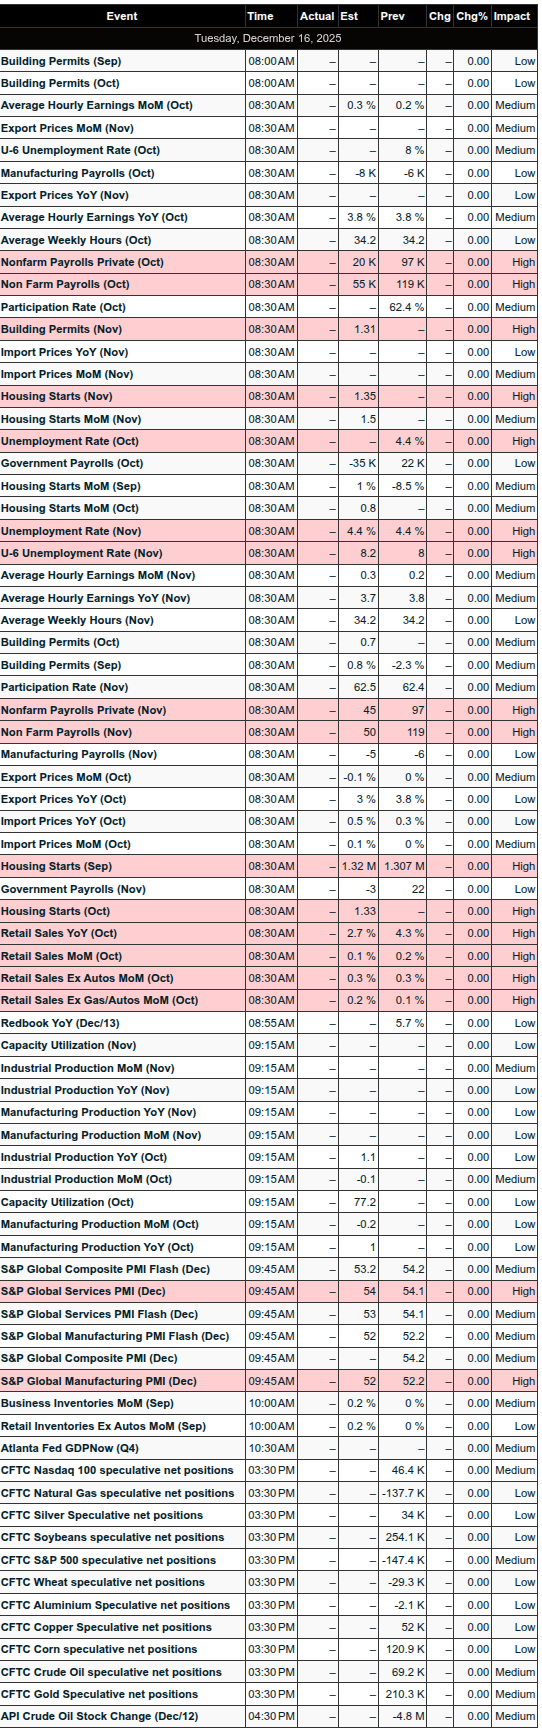
Tuesday, December 16 (High-impact: Delayed labor and retail data)
Time
Event
Period
Forecast
Prior
8:30 AM
Nonfarm Payrolls (delayed)
Nov
+50,000
+119,000
8:30 AM
Unemployment Rate
Nov
4.5%
4.4%
8:30 AM
Hourly Earnings MoM
Nov
+0.3%
+0.25%
8:30 AM
Retail Sales (delayed)
Oct
+0.1%
+0.2%
8:30 AM
Retail Sales ex-Autos
Oct
+0.2%
+0.3%
9:45 AM
S&P Global Services & Manufacturing PMI Flash
Goldman Sachs’ Forecast for the November 2025 BLS Employment Report
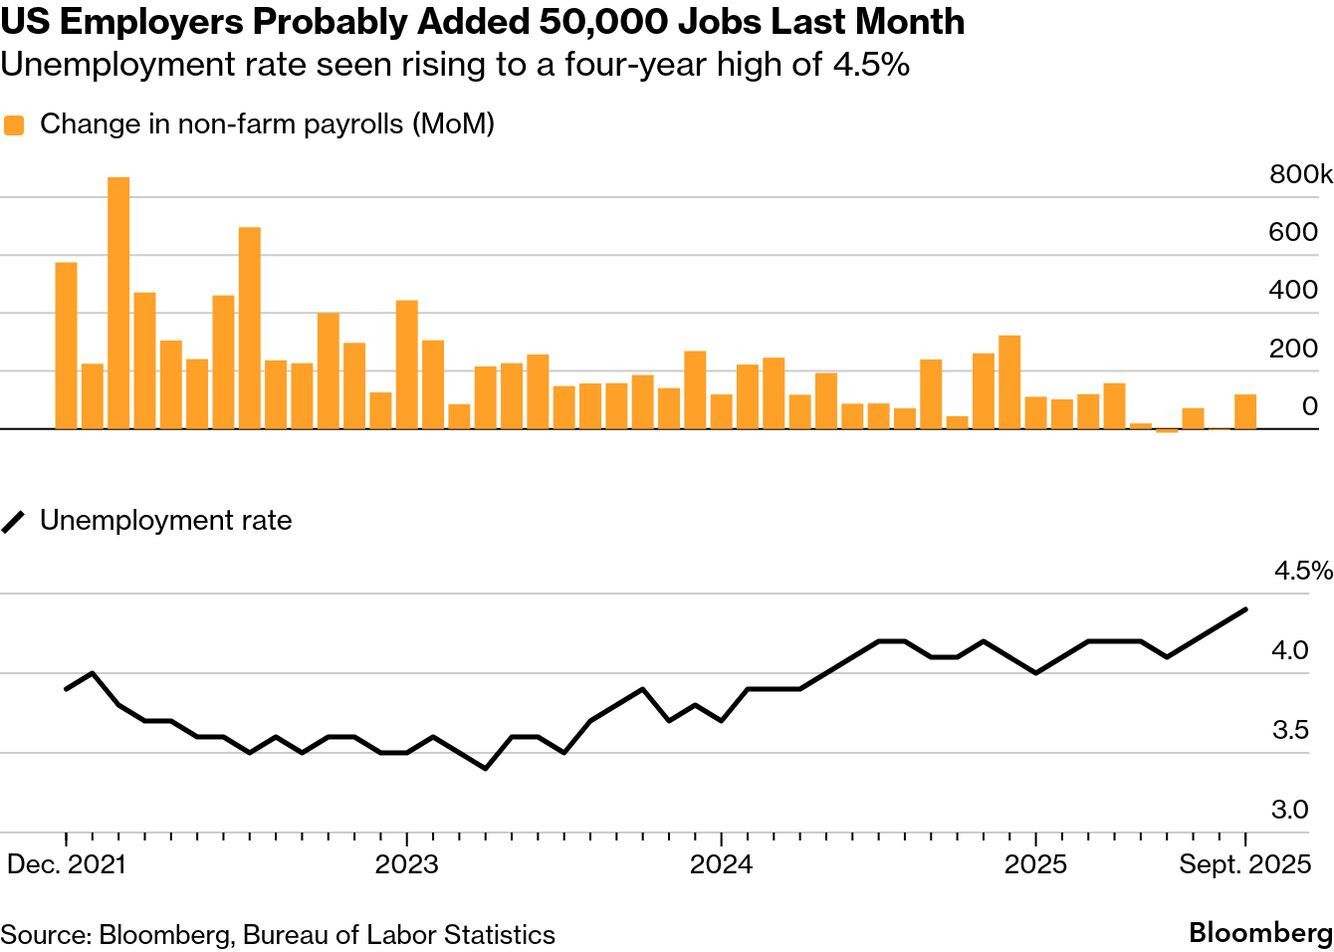
Goldman Sachs economists have forecasted that the U.S. unemployment rate for November 2025 will rise slightly to 4.5%.Key quote from their analysis:
“We estimate that the unemployment rate edged up to 4.5% in November, a low bar from the unrounded 4.44% in September.”
Supporting Details from Their Preview
-
Nonfarm payrolls: +10k in October (private: +70k) and +55k in November (private: +50k).
-
Moderate private-sector growth expected, but offset by drags such as the “DOGE deferred resignation program” (estimated 70k hit in October and additional 10k in November impacting government payrolls).
-
Other factors: Surging layoffs (up 54% YoY through November), declining job openings (7.7 million in October JOLTS, down from prior peaks), and uneven wage growth lagging inflation for lower/middle-income workers (contributing to a “K-shaped” recovery).
Broader Context
-
The unemployment rate has trended upward in 2025, reaching 4.4% (unrounded 4.44%) in September—the highest since 2021.
-
This forecast comes ahead of the BLS Employment Situation report (covering November data, bundled with some October details due to prior disruptions), scheduled for release on December 16, 2025.
-
Goldman views the current labor market softening as temporary, with longer-term optimism: expecting U.S. growth to accelerate to 2–2.5% in 2026 (driven by easing tariffs, tax cuts, and financial conditions), and the unemployment rate stabilizing only modestly above September’s 4.4%.
MiM
Market-on-Close Recap – MiM
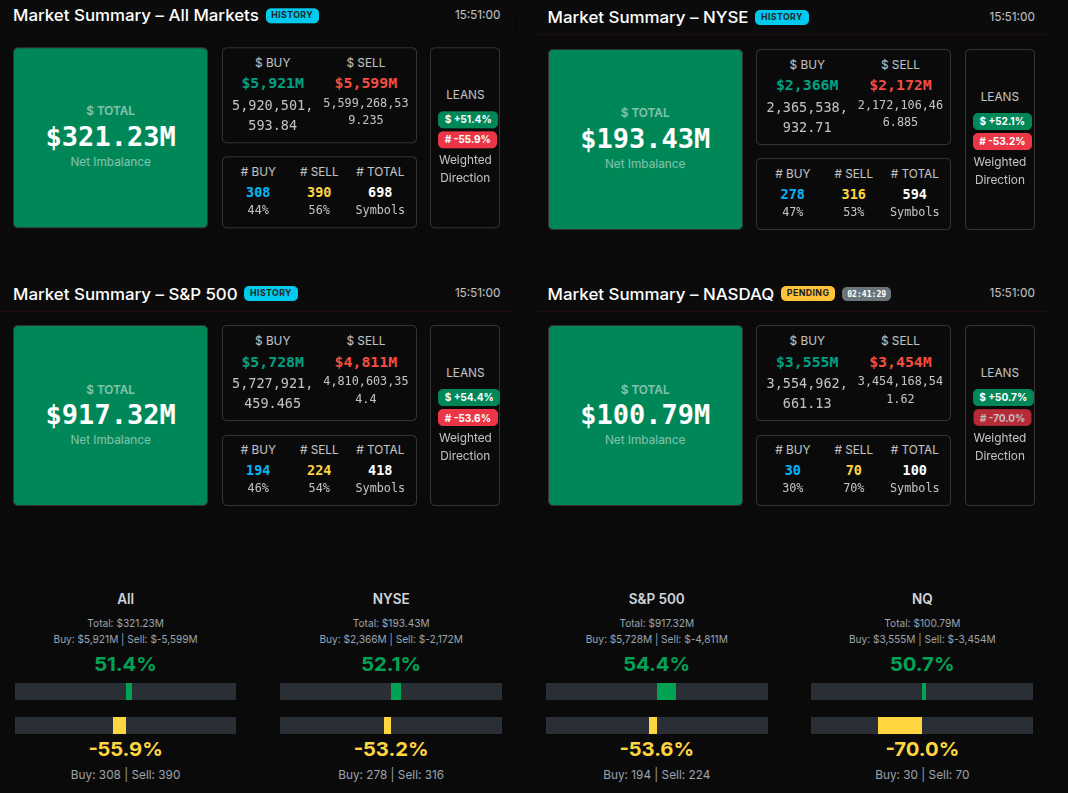
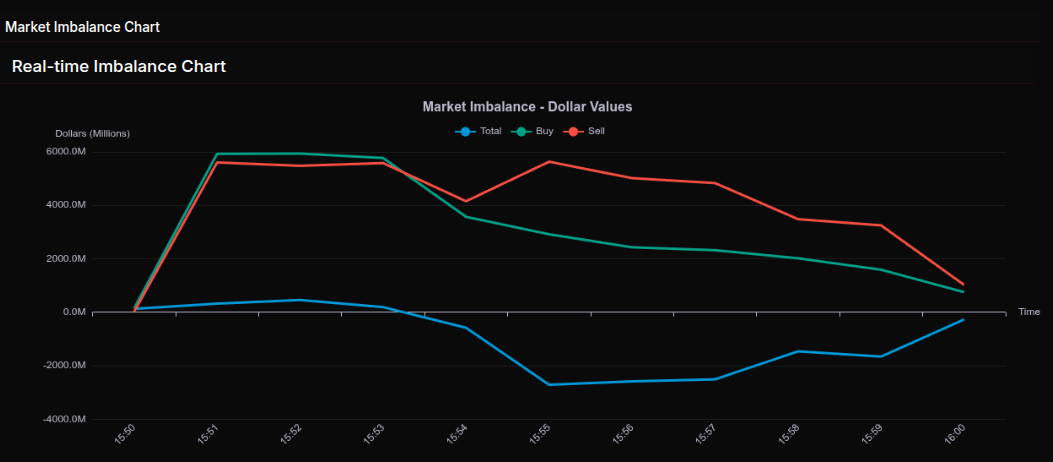
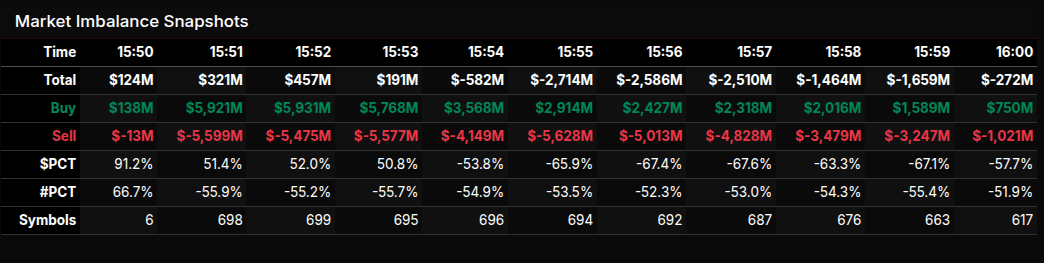
The Market-on-Close auction opened with a modest net buy imbalance and quickly morphed into a highly rotational tape before resolving into broad-based selling pressure. At 15:51, the total imbalance registered +$321M, masking a tug-of-war under the surface: buy dollars were heavy, but sell-side symbol counts already outnumbered buys, a theme that persisted through the remainder of the session.
From 15:52 to 15:53, the market hovered near balance, with dollar flow close to neutral and lean metrics clustering around the 50% level — classic rotation rather than conviction. That changed decisively at 15:54. The imbalance flipped sharply negative, accelerating into wholesale sell programs by 15:55 and 15:56, where dollar imbalances exceeded -$2.7B and sell-side percentage leans pushed beyond -66%. Those readings signalled institutional-scale distribution rather than passive rebalancing.
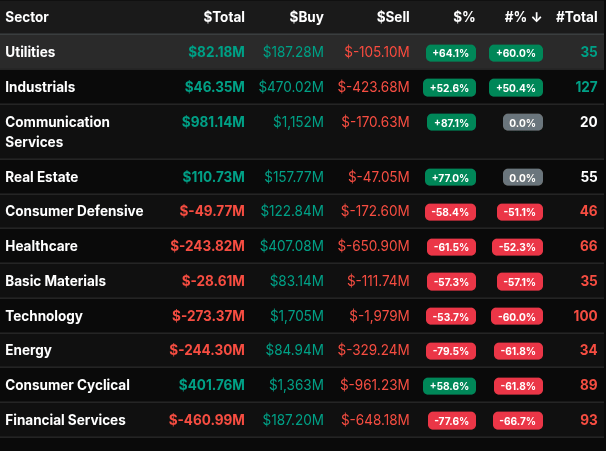
Sector flows reinforced that message. Financial Services, Energy, Technology, Healthcare, and Consumer Defensive all posted deeply negative dollar totals with sell leans between -53% and -78%, highlighting coordinated pressure across both cyclicals and defensives. Technology was particularly notable: despite large gross buy dollars, sell pressure overwhelmed, consistent with continued AI and semiconductor liquidation themes. Financials showed the most aggressive downside skew, suggesting balance-sheet risk reduction into the close.
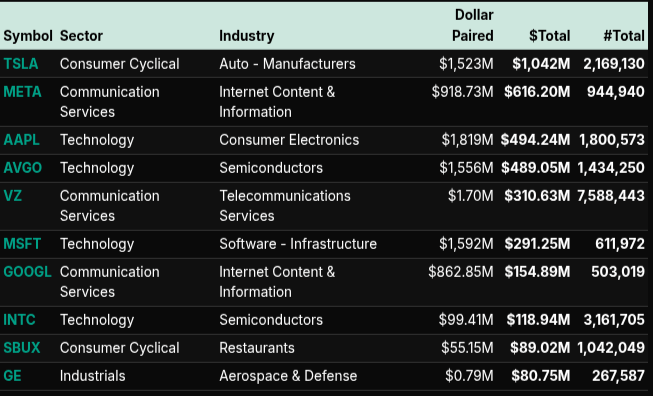
On the buy side, Utilities, Industrials, Communication Services, Real Estate, and Consumer Cyclical absorbed capital, but most of these leaned closer to the +50% range — rotational, not outright accumulation. Communication Services stood out with a strong dollar total, supported by META, GOOGL, and VZ activity, though symbol counts remained thin.
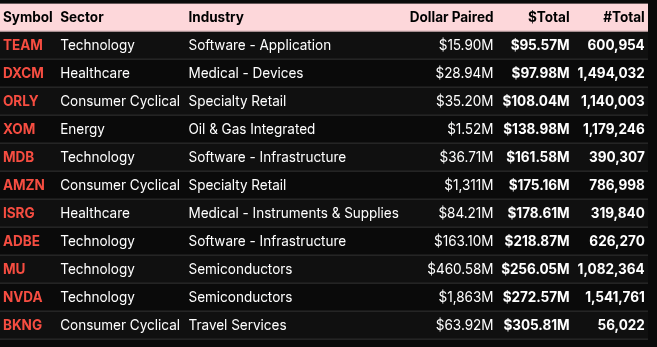
Single-stock flow underscored the bifurcation. NVDA, MU, AVGO, MSFT, and AAPL all traded massive paired dollars, yet the aggregate technology sector still closed net negative — a sign that strength was used to sell into. TSLA and META attracted sizable demand, while energy pressure was concentrated in XOM.
By 16:00, the imbalance compressed back toward neutral, but the damage was done. The MOC told a clear story: early rotation gave way to decisive, programmatic selling, with sector-wide confirmation that sellers controlled the close.
Technical Edge
Fair Values for December 16, 2025:
-
SP: 61.61
-
NQ: 257.91
-
Dow: 390.04
Daily Market Recap 📊
For Monday, December 15, 2025
• NYSE Breadth: 43% Upside Volume
• Nasdaq Breadth: 30% Upside Volume
• Total Breadth: 32% Upside Volume
• NYSE Advance/Decline: 50% Advance
• Nasdaq Advance/Decline: 36% Advance
• Total Advance/Decline: 41% Advance
• NYSE New Highs/New Lows: 117 / 37
• Nasdaq New Highs/New Lows: 176 / 267
• NYSE TRIN: 1.39
• Nasdaq TRIN: 1.27
Weekly Breadth Data 📈
For Week Ending Friday, December 12, 2025
• NYSE Breadth: 53% Upside Volume
• Nasdaq Breadth: 52% Upside Volume
• Total Breadth: 52% Upside Volume
• NYSE Advance/Decline: 56% Advance
• Nasdaq Advance/Decline: 49% Advance
• Total Advance/Decline: 52% Advance
• NYSE New Highs/New Lows: 344 / 76
• Nasdaq New Highs/New Lows: 616 / 306
• NYSE TRIN: 1.05
• Nasdaq TRIN: 0.89
ES & NQ Levels (Premium only)

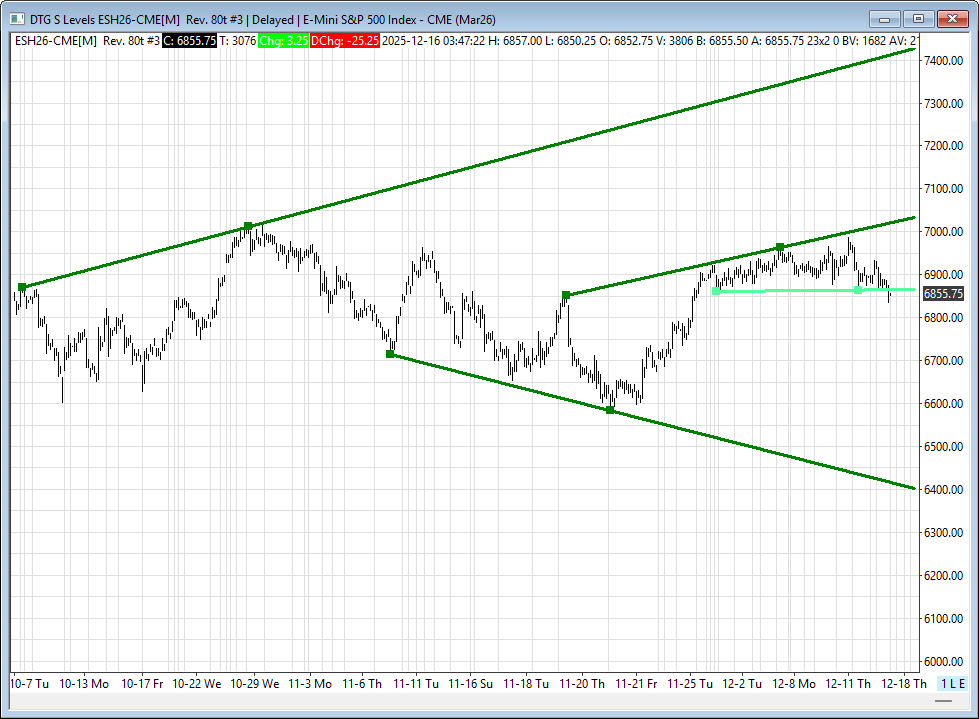
ES – H26 Levels
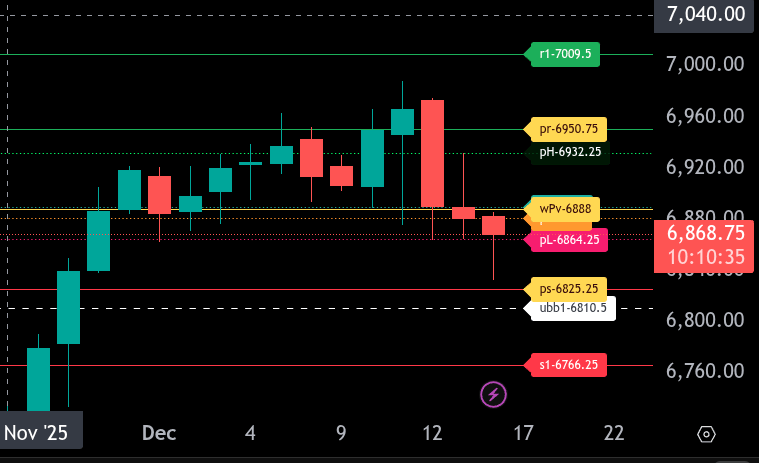
The bull/bear line for ES is at 6888.00. This level defines today’s directional bias. Acceptance below it keeps pressure on the downside, while a reclaim would stabilize conditions.
ES is trading around 6868.50, firmly below the bull/bear line, maintaining a bearish tone early in the session. As long as price holds below 6888.00, sellers remain in control.
The upper range target is 6950.75. Initial resistance comes in at 6932.25, followed by 6950.75. Any rally into these levels below the bull/bear line should be treated as corrective unless 6888.00 is reclaimed and held.
The lower range target is 6825.25. Immediate support sits at 6864.25, then 6825.25. A sustained break below 6825.25 opens the door toward deeper downside at 6810.50 and potentially 6766.25.
Overall, the ES remains bearish below 6888.00. Bulls need a clean reclaim and hold above the bull/bear line to shift the intraday bias higher. Until then, rallies are vulnerable to selling pressure.
NQ – H26 – Levels
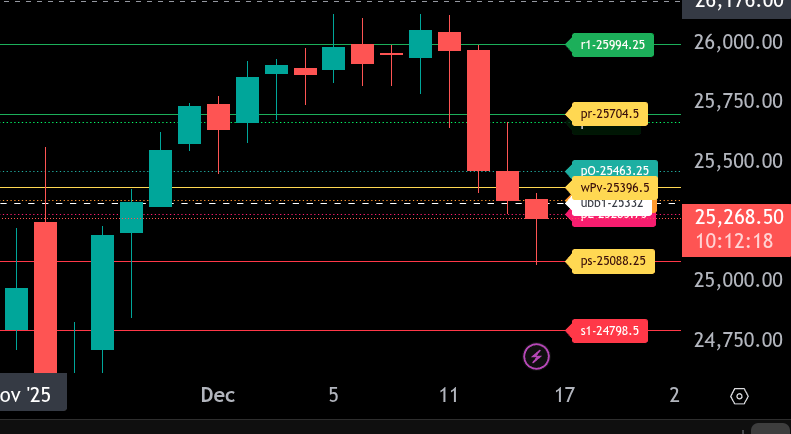
The bull/bear line for the NQ is at 25,396.50. Price is trading well below this level, keeping the broader tone firmly bearish into the session.
NQ is currently trading near 25,268.25 after a sharp downside impulse. While below 25,396.50, rallies are considered corrective. The upper range target sits at 25,704.50. A reclaim and hold above 25,396.50 would be required to open a path back toward 25,463.25 and then 25,704.50.
Immediate resistance levels are 25,332.00, 25,342.75, and 25,396.50. Sellers are likely to defend these areas on any bounce.
On the downside, initial support is at 25,258.75, followed by 25,088.25 which marks the lower range target. A clean break below 25,088.25 puts 24,798.50 in play as the next downside objective.
As long as NQ remains below 25,396.50, the bias stays bearish, favoring selling rallies rather than attempting to fade downside momentum, keeping the tone defensive, while reclaiming it invites a test of the upper areas.
Calendars
Economic Calendar
Today
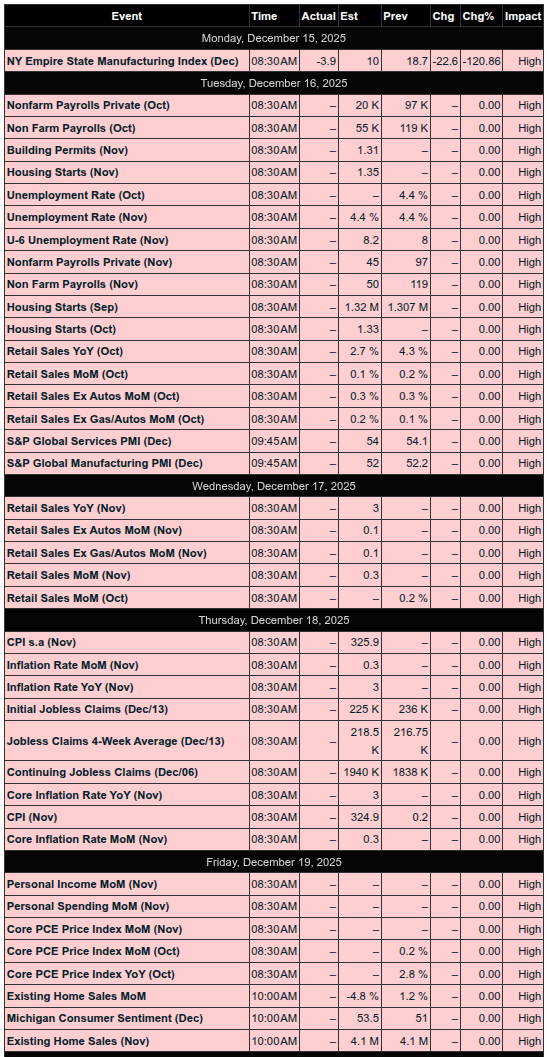
Important Upcoming
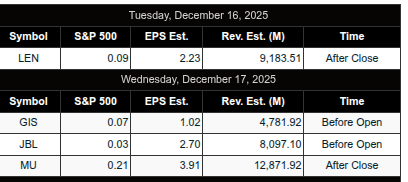
Earnings
Trading Room Summaries
Polaris Trading Group Summary – Monday, December 15, 2025
Yesterday’s session was a textbook example of precise planning and disciplined execution, particularly in the morning session. PTGDavid’s Daily Trade Strategy (DTS) was “spot on,” with both the Bull and Bear scenarios playing out perfectly within the defined levels. Traders who stayed focused on the March (H) contract, honored the 6890 Line in the Sand, and took Triple-A setups had solid opportunities on both sides of the market.
Key Trade Highlights:
Morning Setup & Execution:
-
Overnight Bull Scenario fulfilled early as prices reached the 6915–6930 upper target zone.
-
Gap Fill Trade triggered off the 6893.25 gap, and traders like Manny and others executed planned buys around 6890, capturing solid points.
-
Price reversal off LIS (Line in the Sand at 6890) led to a swift drop, validating the Bear Scenario, with targets of 6875 and 6865 both tagged — clear, measured execution.
-
PTGDavid: “6875 tagged!!!! TYVM!”
-
Then: “6865 target tagged” and “Both upper and lower target zones fulfilled per the DTS Briefing.”
-
Open Range Trifecta:
-
@ES, @NQ, and @CL all hit their Open Range Short targets.
-
A rare and clean Open Range Trifecta confirmed the power of alignment and momentum.
-
David celebrated this with full chart posts showing fulfilled targets.
Notable Trades & Trader Wins:
-
Manny: Scored with multiple trims including +5, +8, and even more down to 6885s.
-
Bosier: Managed adds and fills throughout the morning momentum, with filled levels up to 32.5.
-
Steve9 and others flipped short near the turn and managed their trades into the target zones.
Lessons & Guidance:
-
“Mind your charts. Mind your fills. Mind your ego.” – PTGDavid’s classic reminder to stay grounded and in control.
-
Stay aligned with the Dominant Force: Those who did so today were rewarded with clarity and profits.
-
DTS Levels are for both Targets and Reversals – David reiterated their dual purpose to guide new and seasoned traders.
-
Patience post-lunch: Midday action slowed significantly due to contract rollover mechanics, as expected. Traders who understood rollover behavior likely stepped aside during the chop.
Other Notes:
-
March contract (H) now fully in play with a ~60-point premium over Dec (Z). This rollover impacted structure and required chart updates.
-
The 6890 level proved absolutely critical — acting as a magnet throughout the session.
-
Afternoon saw contract rollover-induced “paint-drying” price action, as David noted MMs were keeping the tape stable.
-
MOC Imbalance Whipsaw: Buy imbalance of $300M flipped to a $2.7B Sell Imbalance — classic end-of-day trickery.
Final Thoughts:
Monday was a masterclass in scenario planning and disciplined execution. Both bull and bear targets were hit cleanly. Traders who respected the DTS, traded around the LIS (6890), and managed risk had the chance to rack up solid wins before the market went into rollover hibernation.
PTG Takeaway Quote of the Day:
“Whichever side owns 6890 owns the tone, the tape, and potentially the final chapter of the year.”
Discovery Trading Group Room Preview – December 16, 2025
Macro Focus:
Markets await the delayed November Jobs Report (8:30am ET), expected to show a modest 50K job gain and a rise in unemployment to 4.5%. This data, along with delayed retail sales and business inventories, will shape Fed expectations heading into early 2026. FedWatch currently reflects expectations for two rate cuts next year.
Corporate & Tech Highlights:
-
Ford (F) surges pre-market after announcing a $19.5B pivot away from full EVs toward hybrids and extended-range EVs. The Lightning pickup is canceled, with a goal of 50% hybrid/EV mix by 2030.
-
Nasdaq seeks SEC approval for a new 9pm–4am ET trading session, expanding trading to 23 hours/day to meet global demand.
-
Global smartphone sales forecast to decline 2.1% in 2026 (Counterpoint), driven by rising chip costs and AI-fueled memory chip shortages. Nvidia is intensifying shortages by using smartphone-style memory in AI servers.
-
Microsoft (MSFT) is seen reaching a $5T market cap by 2026 (Wedbush), as demand for OpenAI’s enterprise AI offerings surges.
Earnings Watch:
After-hours: Lennar (LEN)
Pre-market Wednesday: General Mills (GIS), Jabil (JBL)
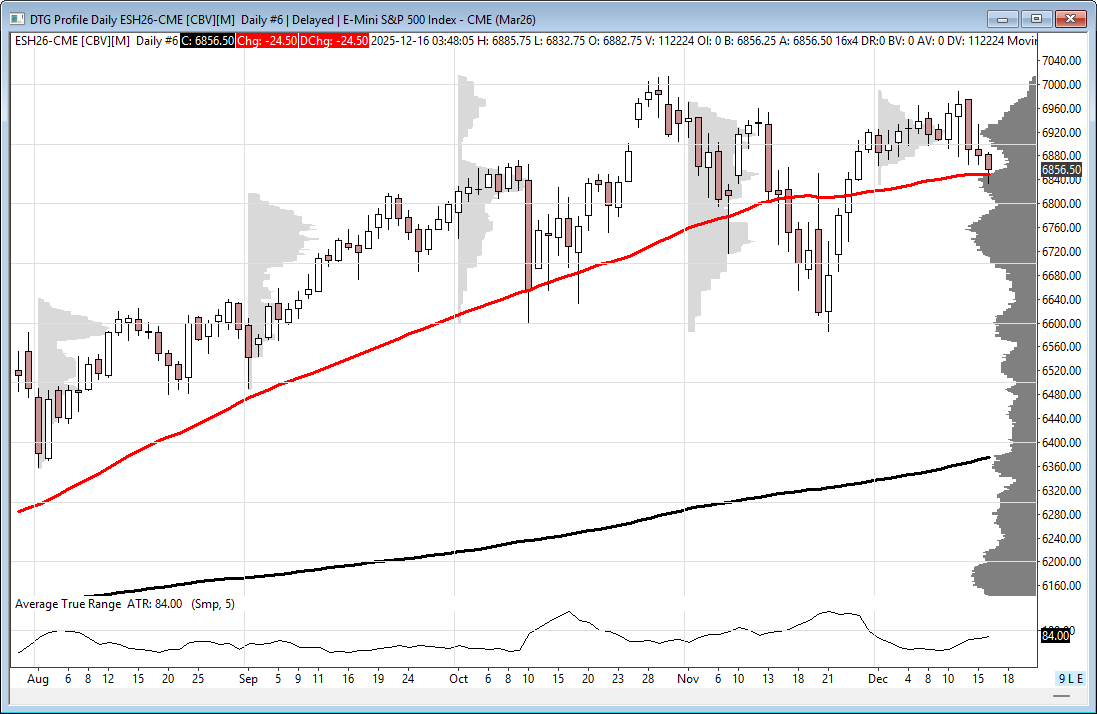
Market Technicals:
-
ES 5-day ADR: 79.25 points; volatility remains moderately high.
-
Key Support: 50-day MA at 6849.50 held overnight; failure could spark a deeper move.
-
Watch Levels: Resistance – 6868/71, 7026/31, 7430/35; Support – 6395/90.
-
No significant overnight large trader bias.
Affiliate Disclosure: This newsletter may contain affiliate links, which means we may earn a commission if you click through and make a purchase. This comes at no additional cost to you and helps us continue providing valuable content. We only recommend products or services we genuinely believe in. Thank you for your support!
Disclaimer: Charts and analysis are for discussion and education purposes only. I am not a financial advisor, do not give financial advice and am not recommending the buying or selling of any security.
Remember: Not all setups will trigger. Not all setups will be profitable. Not all setups should be taken. These are simply the setups that I have put together for years on my own and what I watch as part of my own “game plan” coming into each day. Good luck!
This post goes out as an email to our subscribers every day and is posted for free here around 2 PM ET. To get your real-time copy, sign up for the free or premium version here: Opening Print Subscribe.
Comments are closed