This post goes out as an email to our subscribers every day and is posted for free here around 2 PM ET. To get your real-time copy, sign up for the free or premium version here: Opening Print Subscribe.
April 28, 2026 | Read online
Thin to Win Meets Digital Spin — Markets Rip Higher While Tokenization Loads the Next Cannon
Follow @MrTopStep on Twitter and please share if you find our work valuable!


I think we all know that we live in an ever-evolving world, and that goes with just about everything. Tokenization is coming whether you like it or not, and the Nasdaq is moving fast.
Nasdaq CEO Adena Friedman recently declared that the stock market is on the verge of a fundamental transformation driven by tokenization. At a conference in Boca Raton, Florida, she outlined Nasdaq’s SEC-approved framework to trade tokenized versions of Russell 1000 stocks and major ETFs alongside traditional shares on the same order book, preserving identical tickers, CUSIP numbers, and economic rights. This blockchain-based approach promises near real-time settlement (versus current T+1), significantly lower costs by reducing intermediaries and inefficiencies, extended trading hours, including the planned 23/5 model launching in December 2026, and stronger direct issuer-investor connections. First tokenized trades could begin before the end of 2026, with a broader rollout in 2027, positioning tokenization as the next major innovation layer in securities markets while maintaining regulatory oversight and issuer control.
Key Benefits
Here are the main advantages highlighted by Nasdaq CEO Adena Friedman and industry analyses:
• Faster Settlement: Traditional trades settle in T+1 (one business day). Tokenization enables near real-time or atomic settlement (instant exchange of asset and payment). This reduces counterparty risk, frees up capital quicker, and minimizes the time money is locked during processing.
• Lower Costs and Reduced Inefficiencies: Blockchain cuts out layers of intermediaries, manual reconciliation, and post-trade friction. This lowers operational expenses (industry-wide costs run into tens of billions), streamlines corporate actions (e.g., dividends, proxies), and improves overall capital efficiency.
• Extended Trading Hours / Always-On Access: Tokenized assets align with Nasdaq’s push for 23/5 trading (nearly round-the-clock, launching December 2026). Investors gain more flexibility, especially globally, without being limited to regular market hours.
• Improved Liquidity and Collateral Mobility: Tokens can be used more fluidly as collateral across platforms. Combined with faster settlement, this reduces trapped capital and enables better use of assets in lending, margin, or cross-border flows.
• Stronger Issuer-Investor Connections: Issuers (companies) retain control and gain better visibility into shareholders. This modernizes governance, transparency, proxy voting, and direct engagement, while issuers decide whether and how to tokenize their securities.
• Fractional Ownership and Broader Access: Tokens make it easier to divide shares into smaller units, lowering barriers for retail and global investors. This can increase participation and liquidity, though Nasdaq’s initial framework focuses on regulated public markets.
• Programmability and Automation: Smart contracts can automate compliance, payments, and complex processes, adding transparency and reducing errors.
In Nasdaq’s approach, this is an evolutionary step (not a full crypto overhaul) that maintains regulatory protections while modernizing infrastructure. While transformative for efficiency, widespread adoption depends on brokers, clearinghouses, and market participants.
While “tokenization” probably won’t literally pay your bills for you, the technology is on track to fundamentally change how everything is paid for and settled.
In the financial world, tokenization is the process of turning a physical or digital asset (like a stock, a house, or even a bar of gold) into a digital “token” on a blockchain.
Here is a link from the World Economic Forum—I know it’s dated August 8, 2025, but it’s a good source and worth the read. And yes, I used AI, but I took the original story and rewrote it.

I want you to think about this. Since 03/31/26: The ES has rallied 774.25 points, or +11.53%, still down 0.06% YTD; the NQ has gained 4,854.00, or 19.50%, still down 0.29% YTD; the YM gained 3,338 points, or +7%, still down 3.01% YTD; and RTY has gained 341.30 points, or +13.06%, still down 0.79% YTD.
What happens when there is an actual agreement with Iran? Like anything, there comes a time when you “sell the news,” and I am not saying we are there now, but when you look at how much the index markets have gone in 20 days, you have to ask: Can the Magnificent 7 just keep going up without any hiccups? Since the end of March, it has gained $3.7 trillion, and its combined market cap is now $22.5 trillion. If you want to figure it out yourself, go to Slickcharts.com.
Look, I don’t know the answer. Is the ES going to 7500.00 first? I really don’t know, but I think when you have extended rallies like we are seeing, with little to no down days, the risk goes up, not down. The primary ETF tracking the “Magnificent Seven” companies—Apple, Microsoft, Alphabet, Amazon, Nvidia, Meta, and Tesla—is the Roundhill Magnificent Seven ETF (MAGS). It provides concentrated exposure to these technology leaders with a 0.29% expense ratio. Other options include leveraged funds like the Direxion Daily Magnificent 7 Bull 2X ETF (QQQU).
As I have always said, I’m a bull guy, and while I did switch to a pessimistic bull during the decline, I also have a saying that we are not here to fight city hall, and if the ES and NQ are going up, we want to go for the ride. I also have another saying… There is reason to be concerned.
Our Lean
When the volume in the ES drops from 1.9 to 2.2 million down to 1 million—and it’s not just the futures, the NYSE volume has been really low—this creates one of my own trading ruses called “thin to win,” and it’s been working for several days as the volumes continue to drop.
Our lean: I’m not trying to scare you out; I’m just pointing out that the markets are extended. You can sell the early rallies, especially if there is a big gap up, and buy the pullbacks, or just be patient and buy the pullbacks.
Below are my Claude ES AI levels.
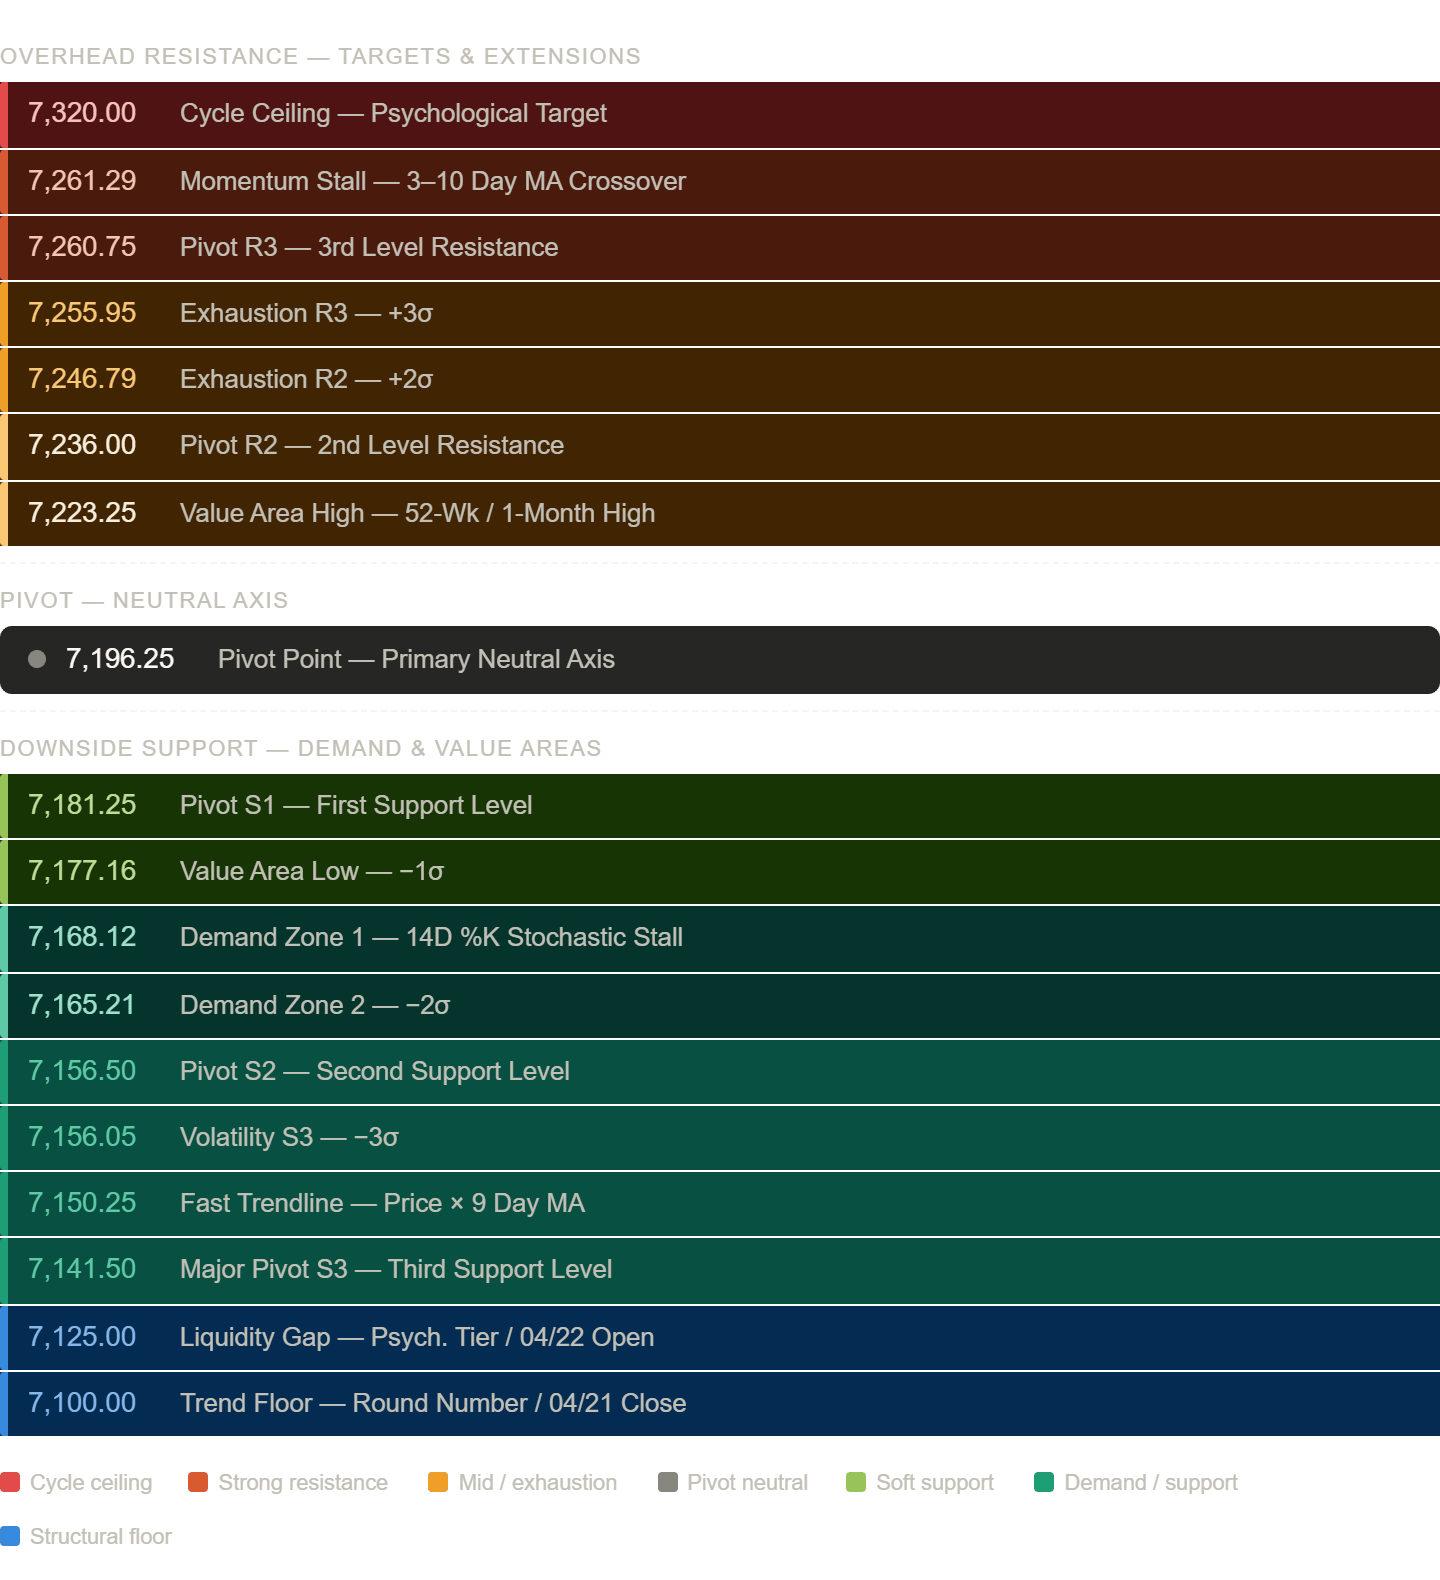
The E-mini S&P 500 June contract opens today with price anchored just above the Pivot Point at 7196.25, which currently serves as the primary neutral axis and the line in the sand between a bullish and bearish session structure. The overnight profile has yet to establish a clear directional conviction, leaving the market in a balanced, two-sided condition as participants await a catalyst to define the day’s range.
Structure & Value Area
The Value Area from the prior session spans 7177.16 (VAL) to 7223.25 (VAH) — a 46-point range that captures the bulk of accepted business. Price opening and remaining within this zone favors a range-bound, mean-reverting day, where fading the extremes is the higher-probability trade. The Point of Control sits in close proximity to the pivot, reinforcing 7,196 as the most heavily traded and agreed-upon fair value. Any sustained trade above the VAH or below the VAL should be respected as a potential breakout signal, not faded.
Upside Scenario
A confirmed acceptance above 7223.25 (VAH) shifts the profile bullish and opens a measured move toward the Pivot R2 at 7236, followed by the dense resistance cluster between 7255 and 7261 — where Exhaustion R3 (+3σ), Pivot R3, and the Momentum Stall MA crossover all converge within 6 points of each other. This zone represents the highest-probability intraday fade opportunity on any impulsive push higher. Only a clean, high-volume breakout through 7261 puts the Cycle Ceiling at 7320 in play, which would signal an institutional-driven extension rather than a rotational move.
Downside Scenario
Failure to hold the pivot brings 7181.25 (Pivot S1) and the VAL at 7177.16 into immediate focus — a cluster that should attract responsive buyers on the first test. A breach of this demand zone on expanding volume is a more serious development, pointing toward the dual support shelf at 7156–7156.50, where Pivot S2 and the −3σ volatility band nearly overlap. This is the last structural defense before the tape enters the liquidity gap at 7125 — the April 22nd open — and ultimately the Trend Floor at 7100, the round number coinciding with the April 21st close.
Initial Balance & TPO Watch
The first hour’s range will be critical. A narrow Initial Balance signals latent energy and increases the probability of a range extension — watch for a directional IB breakout to commit the session bias. Single prints left on any aggressive push should be treated as unfinished business; price has a strong tendency to return and fill those thin TPO zones before resuming trend.


Tom Incorvia – Blue Tree Strategies
4-27-2026
The general climate in the refining stocks appears constructive but still rotational. Both VLO and PSX are trading within well-defined balance distributions after prior upside moves and subsequent pullbacks. Importantly, neither stock has shown meaningful acceptance below its lower distribution boundary. Recent price action suggests sellers have lost momentum, while buyers are beginning to reassert control. The group is not yet in a clean upside auction, but the current behavior points to potential rotation back toward the upper end of their respective ranges.
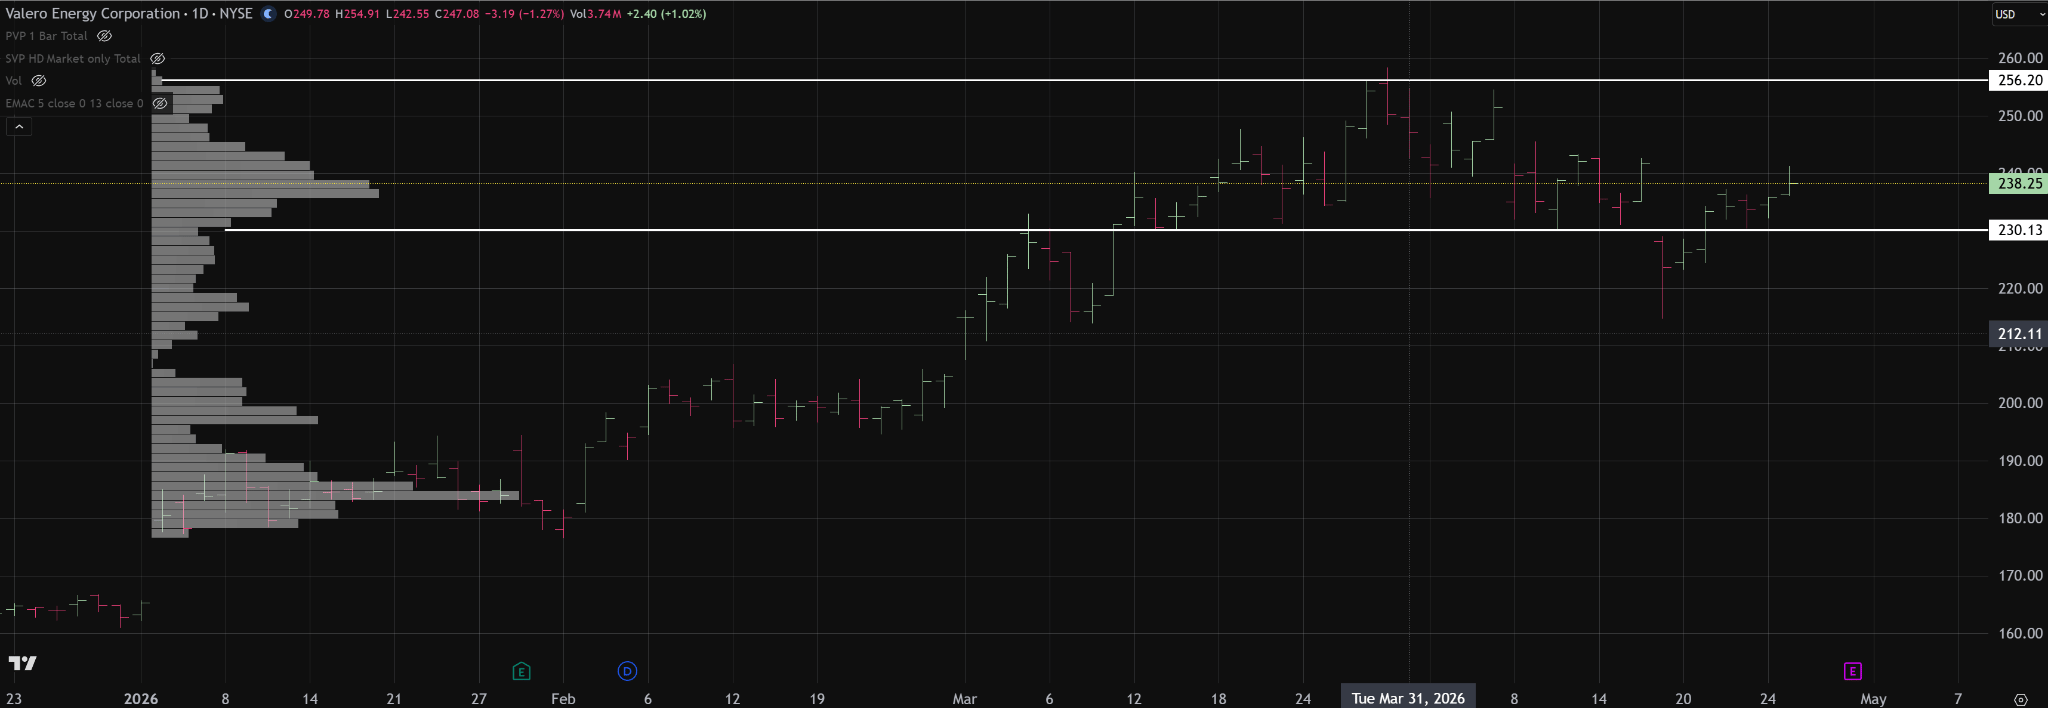
Valero Energy (VLO) is in a clearly defined distribution that the market is acknowledging between roughly 230 and 256. Price briefly closed below the 230 level, but that breakdown was quickly rejected. Over the last five trading days, price has re-established acceptance back inside the balance area.
This action suggests the lower boundary has been successfully tested and defended. As long as price remains accepted above 230, the auction appears positioned for a potential rotation back toward the upper end of the distribution near 256.
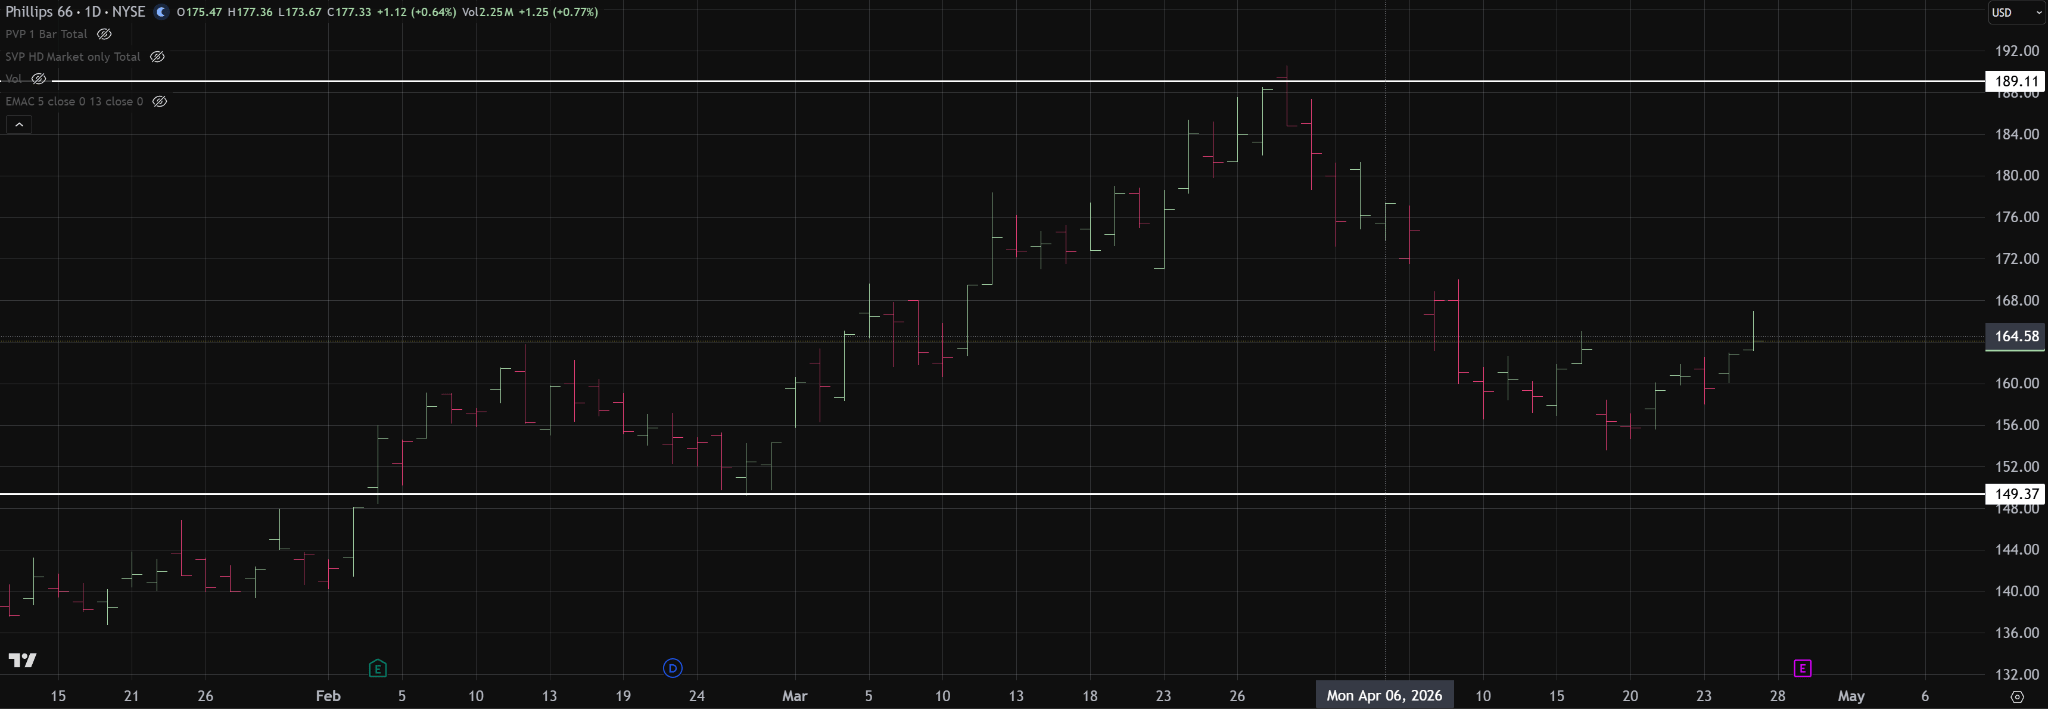
Since February, Phillips 66 (PSX) has been trading within a clearly defined distribution between roughly 149 and 189. After reaching the upper end of that range in March, price rotated lower, but the recent action suggests that downside pressure has begun to stabilize.
Today’s trade produced a new short-term swing high, which is an early indication that buyers may be regaining control inside the distribution. If price can continue to accept above the recent balance area, the auction may be beginning a rotation back toward the upper boundary near 189.
You can purchase Tom’s Course on Volume Profile here

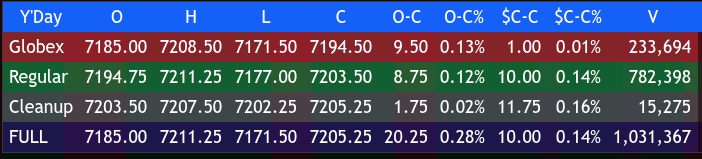
The ES made a low on Globex at 7181.50, rallied up to 7208.50, and opened Monday’s regular session at 7186.25, down 8.50 points or -0.12%, with 178k contracts traded.
After the open, the ES traded down to 7183.25, rallied up to 7198.50, and sold off down to 7180.25. As the NQ sold off, the ES rallied up to a lower high at 7178.50. It then rallied up to a new high at 7199.00 at 10:35, sold off 22.00 points down to 7177.00 at 11:20, and then did a sideways-to-up “back and fill” that pushed the ES up to 7207.25 at 1:35.
It pulled back 6.00 points down to 7201.25, traded back up to 7207.25 at 2:20, pulled back to 7205.50 at 3:10, and traded up to 7210.00 at 3:55 (reaching 7210.00 during the 3:50 cash imbalance). It traded as high as 7211.25 and eventually traded 7207.25 on the 4:00 cash close.
After 4:00, the ES didn’t move much and settled at 7206.00, up 11 points or +0.16%. The NQ settled at 27,487.75, up 47.25 points or +0.17%; the YM settled at 49,396, up 54 points or +0.11%; and the RTY settled at 2,799.60, up 3.50 points or +0.13% on the day.
In the end, it was a Monday “thin to win” trade. After some early weakness/pullback, both the ES and NQ rallied to new highs. In terms of the ES’s overall tone, it was fine despite being up 16 of the last 20 sessions. In terms of the ES’s overall trade, volume was the lowest since December 31st, 2025: 178k ES contracts traded on Globex and 852k traded during the day session, for a total of 1.03 million contracts traded.
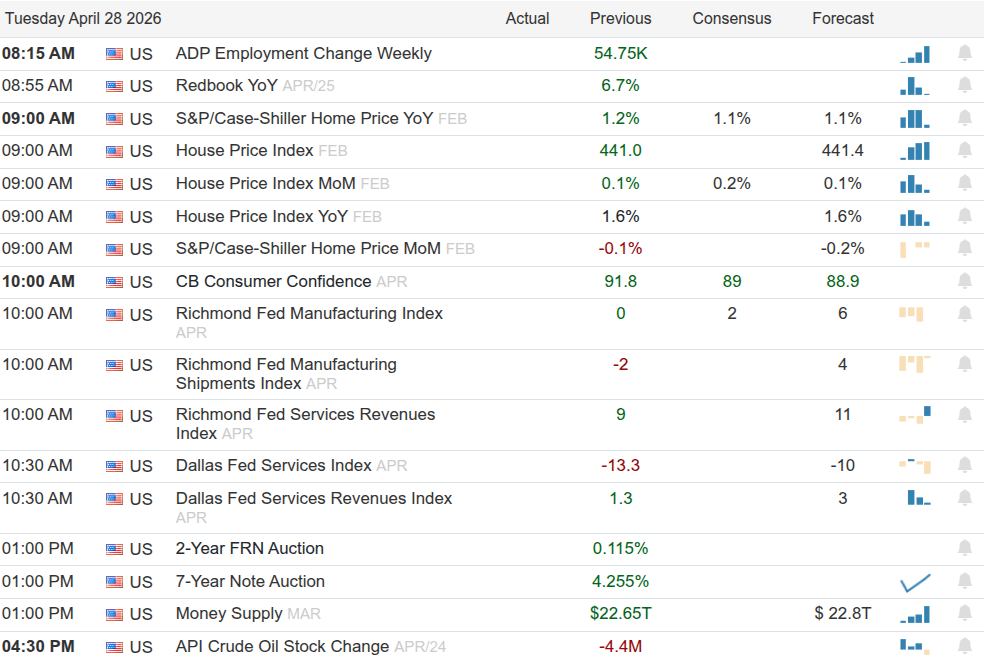
Economic Calendar
Tuesday: 9:00 S&P Case-Shiller Home Price Index; 10:00 Consumer Confidence.
Wednesday: Durable Goods, Housing Starts and Permits, Advanced U.S. Trade Balance; 2:00 FOMC Meeting; 2:30 Fed Chair Powell press conference.
Thursday: 8:30 Initial Jobless Claims, Employment Cost Index, GDP, Personal Income, PCE; 9:45 Chicago Business Barometer (PMI); 1:00 Leading Indicators.
Friday: PMI, ISM.

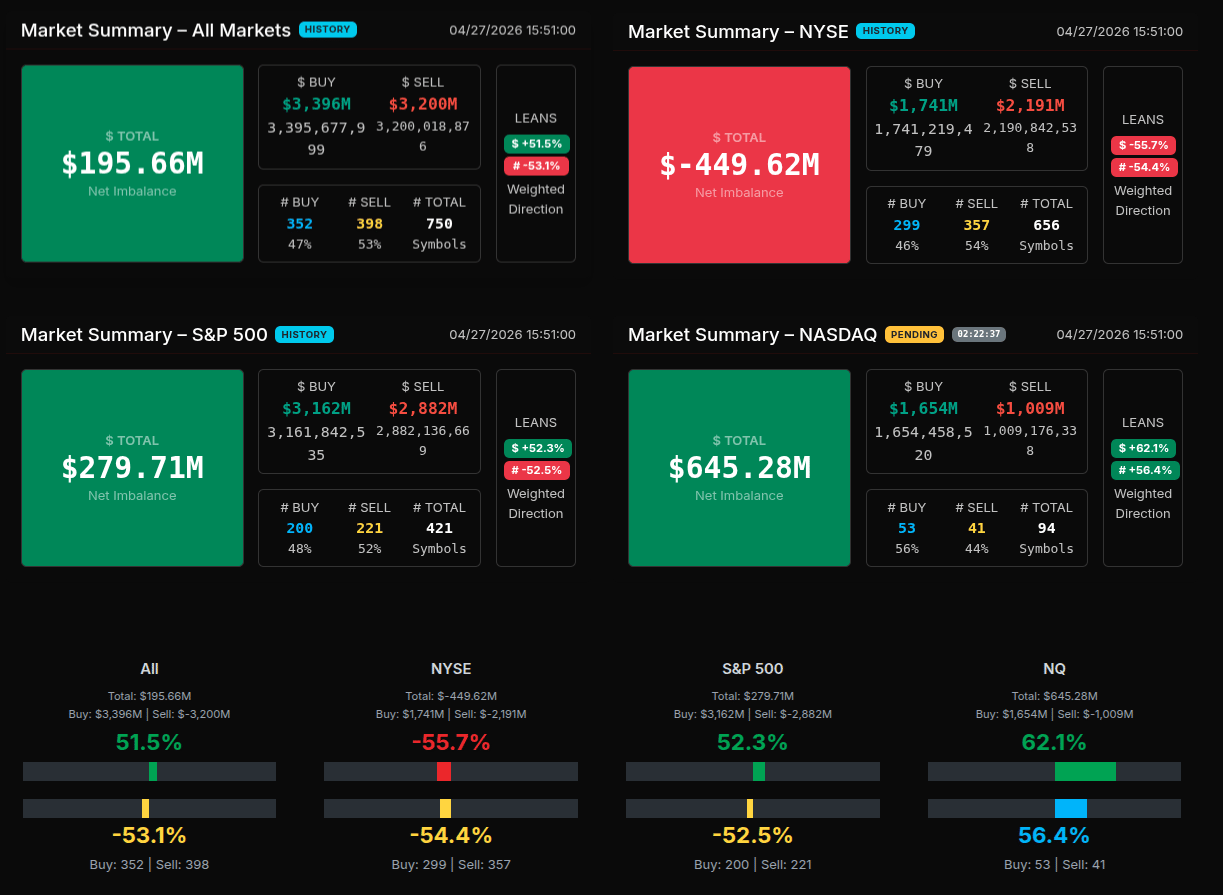
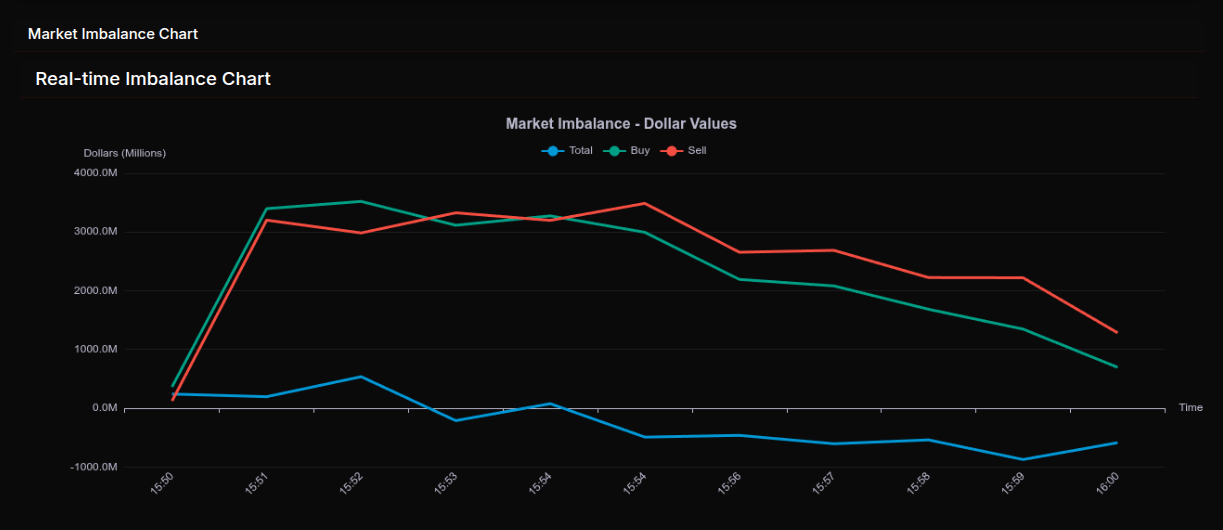
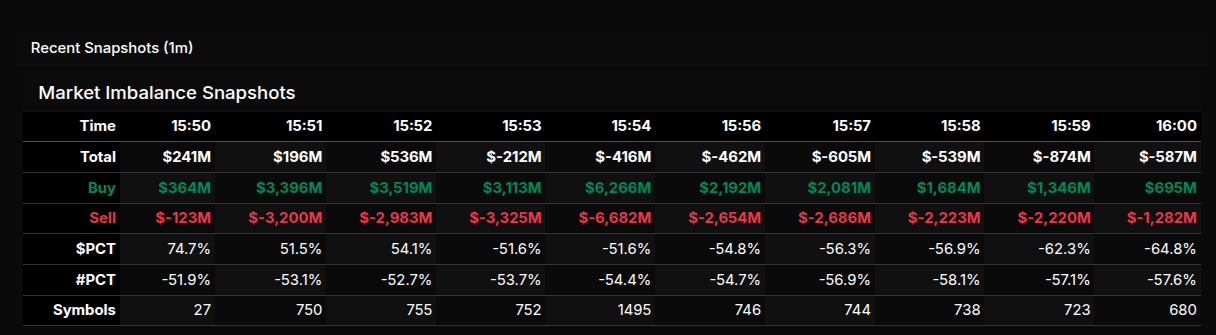
Market-on-Close Recap
The MOC session opened with a modest buy-side tilt, but the early strength quickly proved unstable as the imbalance rotated aggressively before sellers ultimately took control into the close. At 15:50, the market showed a +$241M net imbalance with a strong +74.7% buy skew, signaling early demand. However, this strength peaked at 15:52 at +$536M before sharply reversing. By 15:53, the tape flipped to -$212M and never recovered, with selling pressure accelerating into the bell and closing near -$587M and a -64.8% sell skew. This progression reflects a classic transition from early accumulation into broad distribution.
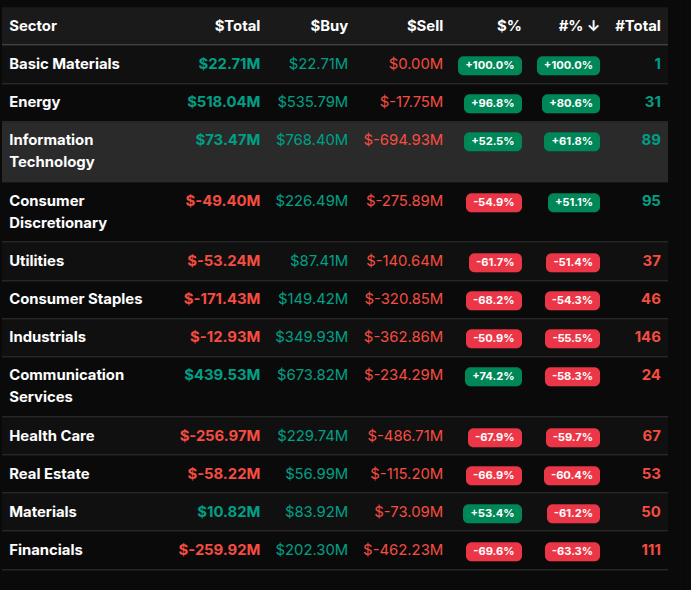
Sector flows reinforced this shift. Energy (+96.8%) and Basic Materials (+100%) showed near wholesale buying, with Energy in particular seeing over $500M in total flow. Communication Services (+74.2%) also leaned heavily bid. On the sell side, several sectors approached or exceeded the -66% threshold, highlighting institutional distribution. Financials (-69.6%), Real Estate (-66.9%), and Health Care (-67.9%) all registered strong sell programs, while Consumer Staples (-68.2%) and Utilities (-61.7%) added to the defensive unwind. This created a clear divide between cyclical inflows and defensive liquidation.
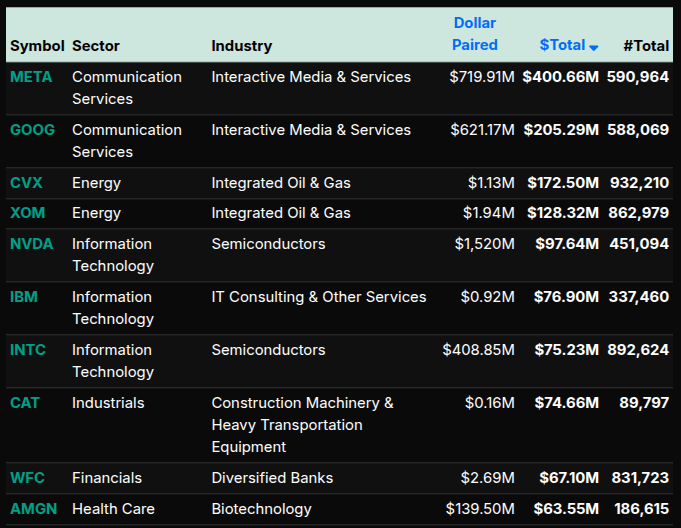
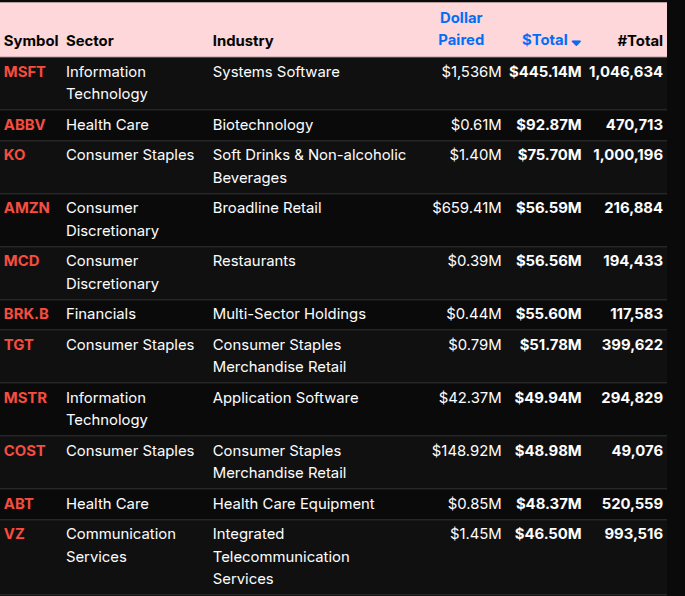
At the symbol level, the activity was concentrated in large-cap leaders. MSFT (+$445M), META (+$400M), and GOOG (+$205M) drove much of the buy-side flow, alongside energy names like CVX and XOM. NVDA and INTC also contributed to tech demand. Conversely, selling pressure was evident in names like AMZN, MCD, and BRK.B, reflecting broader consumer and financial weakness.
Overall, this was not a balanced rotation but a decisive late-day sell program. While some sectors and mega caps saw strong buying, the breadth and persistence of sell imbalances into the close suggest institutions were actively reducing exposure rather than simply reallocating capital.
Technical Edge
Fair Values for April 28, 2026:
-
SP: 30.16
-
NQ: 135.51
-
Dow: 143.63
Daily Market Recap 📊
For Monday, April 27, 2026
• NYSE Breadth: 57% Upside Volume
• Nasdaq Breadth: 47% Upside Volume
• Total Breadth: 51% Upside Volume
• NYSE Advance/Decline: 53% Advance
• Nasdaq Advance/Decline: 47% Advance
• Total Advance/Decline: 49% Advance
• NYSE New Highs/New Lows: 116 / 16
• Nasdaq New Highs/New Lows: 264 / 124
• NYSE TRIN: 0.84
• Nasdaq TRIN: 0.99
Weekly Breadth Data 📈
For Week Ending Friday, April 24, 2026
• NYSE Breadth: 45% Upside Volume
• Nasdaq Breadth: 52% Upside Volume
• Total Breadth: 49% Upside Volume
• NYSE Advance/Decline: 41% Advance
• Nasdaq Advance/Decline: 42% Advance
• Total Advance/Decline: 42% Advance
• NYSE New Highs/New Lows: 307 / 56
• Nasdaq New Highs/New Lows: 677 / 266
• NYSE TRIN: 0.86
• Nasdaq TRIN: 0.68
ES & NQ Levels (Premium only)

ES – M26 Levels
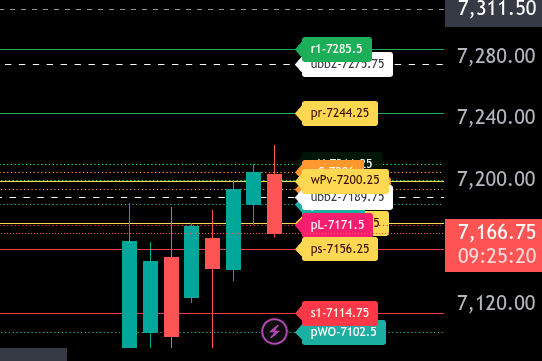
The bull/bear line for the ES is at 7200.25. This remains the key pivot for today’s session. Holding below this level keeps the market in a bearish posture, while acceptance back above it would signal a shift toward bullish control.
ES is currently trading around 7166.75, firmly below the bull/bear line, indicating continued weakness in the overnight session. As long as price remains below 7200.25, sellers are in control and downside continuation is favored.
On the downside, the first key support comes in at 7171.50, followed by 7156.25, which is the lower range target for today. A break and acceptance below 7156.25 opens the door for further downside toward 7114.75, with an extended move potentially reaching 7102.50.
On the upside, resistance is layered starting at 7189.75, then 7200.25 at the bull/bear line. If buyers can reclaim and hold above 7200.25, we can look for a move into 7211.25, followed by 7244.25, which is the upper range target. Continued strength above 7244.25 would shift momentum more decisively in favor of bulls and open the door for a test of 7275.75 and potentially 7285.50.
Overall, the market remains bearish below 7200.25. Any rallies into resistance are likely to be sold unless bulls can reclaim and hold above the bull/bear line. Focus on downside targets while below, and only shift bias if price regains acceptance above 7200.25.
NQ – M26 – Levels
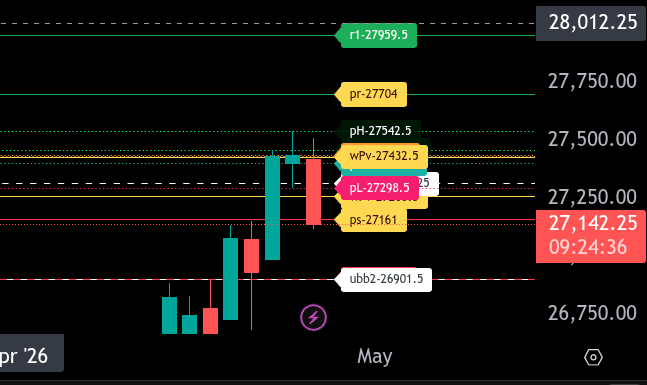
The bull/bear line for the NQ is at 27432.50. This is the key level that must be reclaimed to shift momentum back to the upside. Acceptance above this level would signal a return to bullish control.
Currently, NQ is trading around 27151.50, well below the bull/bear line, indicating clear weakness in the overnight session. As long as price remains below 27432.50, sellers are in control and rallies into resistance should be treated with caution.
On the downside, the lower range target sits at 27161.00, which is actively being tested. A clean break and acceptance below this level opens the door for further downside continuation toward 26901.50. If selling accelerates, that level becomes a key magnet.
On the upside, initial resistance comes in at 27260.50, followed by 27318.25 and then the bull/bear line at 27432.50. Above that, 27462.50 and 27542.50 are additional resistance levels. The upper range target for today is 27704.00, which would require a strong reversal and sustained buying.
Overall, the trend remains bearish below 27432.50. Any bounce into resistance that fails to reclaim the bull/bear line is likely to be sold. Bulls need to reclaim and hold above 27432.50 to shift momentum and target higher levels.

Economic Calendar
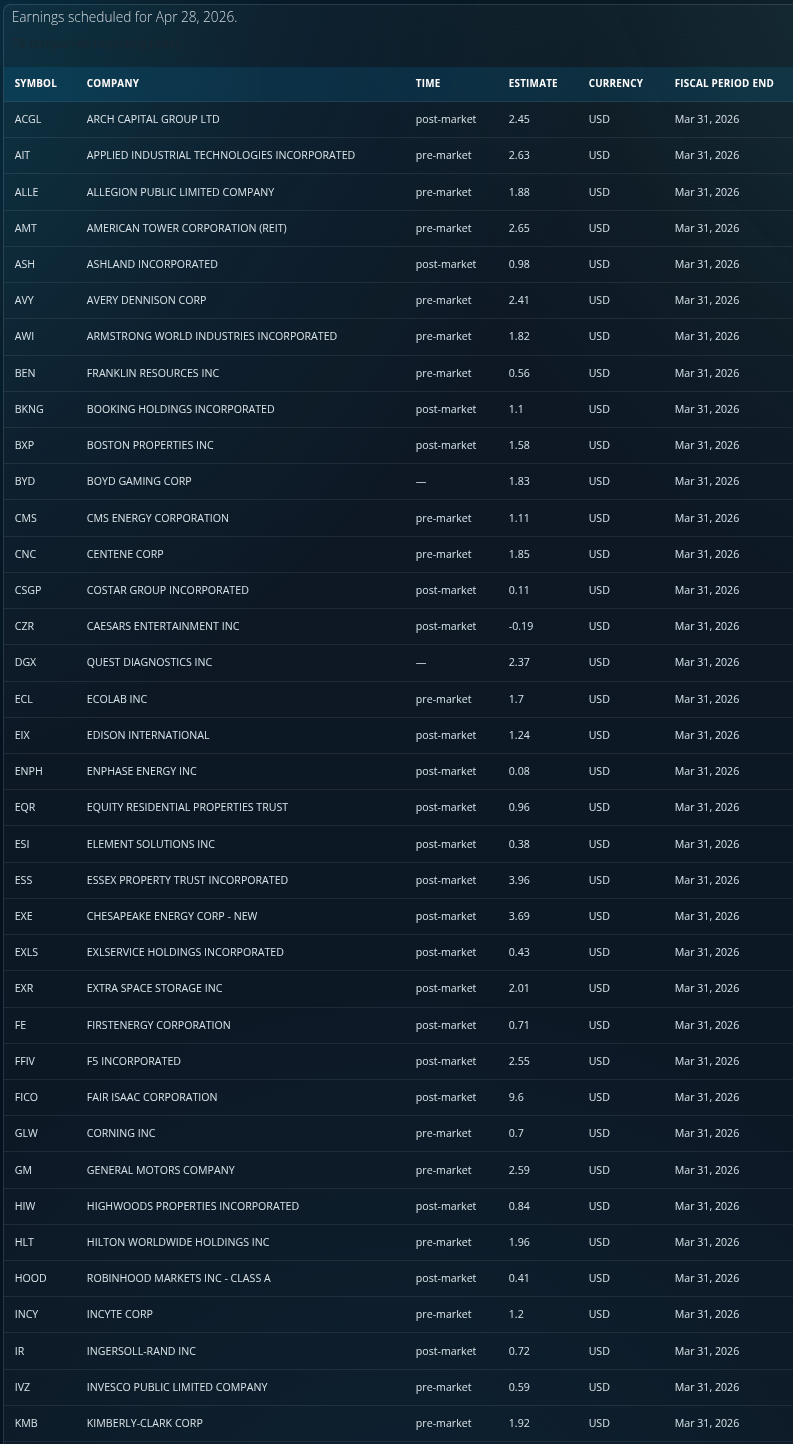
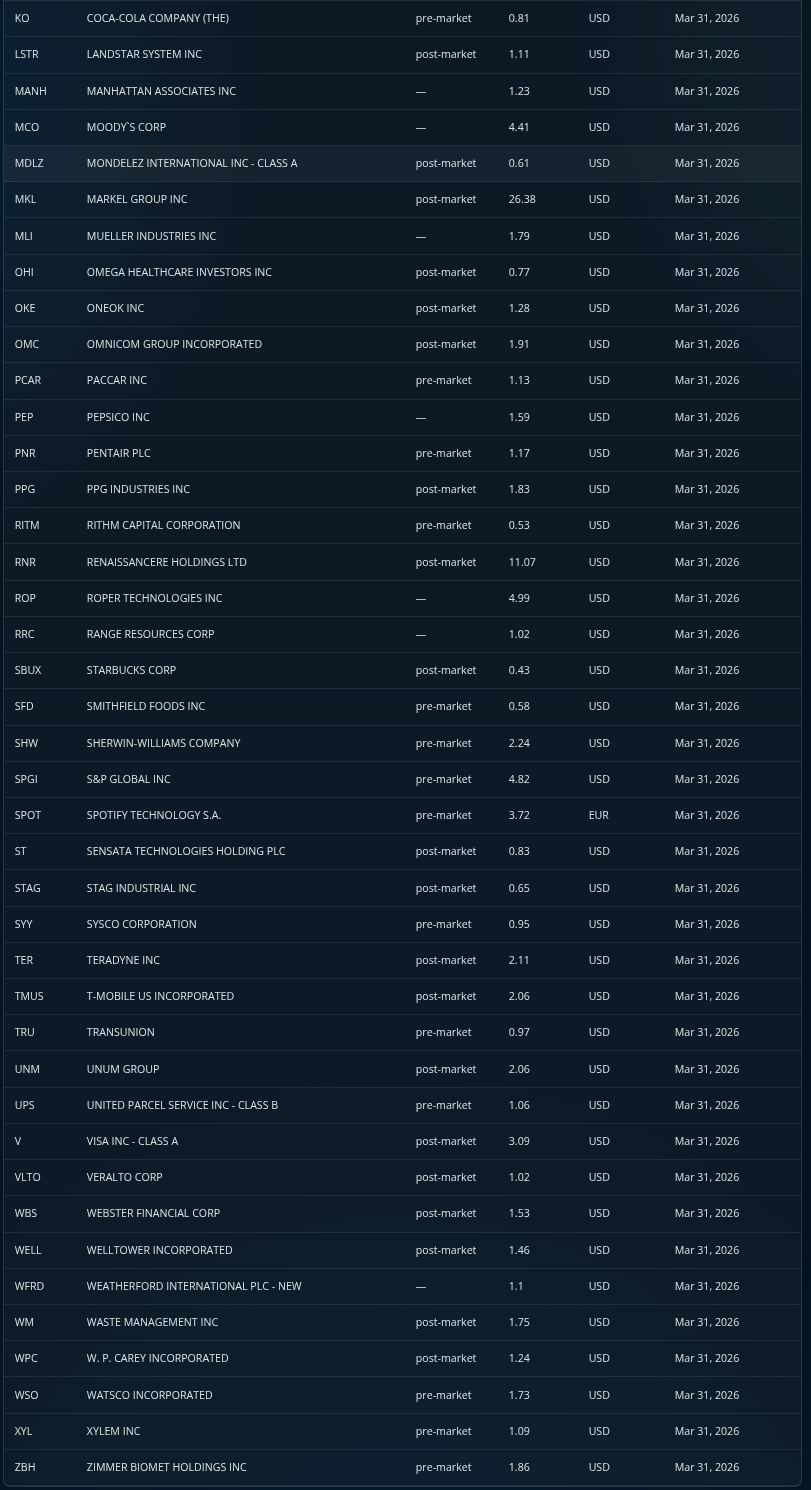
Today’s S&P500 Earnings: (78!)

Polaris Trading Group Summary – Monday, April 27, 2026
The session unfolded very much in line with expectations, reinforcing confidence in the PTG framework and Cycle Day structure.
Pre-Market Context
David set the tone early, noting that overnight upside targets had already been fulfilled, with a classic Globex gap down followed by recovery. The day was identified as Cycle Day 2, and importantly, price action was already aligning with MATD rhythmic expectations. The key reference point was clearly defined:
-
Line in the Sand: 7170
This gave the room a strong directional bias and structure before the open.
Morning Session
The market respected the Cycle Day 2 script well:
-
Early price action stayed within anticipated rhythms
-
Traders began identifying opportunities around reversal setups and structure
There was good engagement and learning:
-
Discussion around valid vs. invalid signals (blue arrow question) helped clarify execution rules
-
A member executed a short off an A-7 Bear RSPR, showing active application of PTG setups
-
Reinforcement of tools like ATR charts and chartbook customization supported trader development
David reaffirmed that the early session behavior matched Cycle Day 2 expectations, which is key—recognition leads to confidence and better execution.
Midday Structure
The market settled into a well-defined range:
-
“Sandbox” identified between 7180 – 7195/98
-
This range held consistently, validating the Cycle Day 2 consolidation theme
This is a classic PTG lesson:
-
Cycle Day 2 often produces balance/consolidation
-
Patience and trading the edges of the range are key
Afternoon / Close
The session closed strong:
-
Price closed near highs
-
Maintained an upward lean throughout consolidation
-
A small MOC sell imbalance (~$700M) was noted but easily absorbed, reinforcing underlying strength
Key Takeaways & Lessons
-
Market adherence to Cycle Day structure was excellent — a textbook Cycle Day 2
-
Preparation matters: Overnight analysis (gap recovery, targets) gave a clear edge
-
Defined levels (7170, 7180–7195) provided actionable structure
-
Consolidation is not noise — it’s opportunity when framed correctly
-
Order flow confirmation (imbalance absorption) supported bullish bias into the close
Looking Ahead To Today
-
Transition to Cycle Day 3
-
Price holding well above Cycle Day 1 low
-
Strong bullish stat in play: 92.42% probability of a positive 3-day cycle
Discovery Trading Group Room Preview – Tuesday, April 28, 2026
Markets are being driven by three key themes: escalating US–Iran tensions, the upcoming Fed decision, and a heavy slate of earnings—especially from major AI players.
Macro / Geopolitics
-
Oil remains elevated (WTI ~$100, Brent ~$110) as flows through the Strait of Hormuz are largely halted amid US–Iran tensions.
-
Negotiations are ongoing, but the US is holding firm on nuclear conditions despite Iran signaling flexibility.
-
Iran is strengthening ties with Russia, adding another geopolitical layer.
Macro / Policy
-
USMCA uncertainty is creating pressure, with foreign automakers warning they may pull low-cost models if tariffs remain high.
Earnings / AI Theme
-
5 of the Mag 7 report this week, with focus on AI capex trends (currently projected ~$670B into 2026).
-
Key question: are hyperscalers slowing, maintaining, or accelerating AI spend?
-
Microsoft and Meta are cutting workforce to fund AI.
-
Google secured a $200M DoD AI contract, highlighting continued government integration into AI.
Today’s Earnings
-
Heavy premarket and after-hours slate across industrials, consumer, tech, and financials.
-
Notable: GM, KO, UPS, SPOT, BP (AM) and SBUX, V, BKNG, HOOD (PM).
Tomorrow
-
Even bigger earnings wave + Fed decision = likely volatility catalyst.
Data Today
-
ADP Employment, Home Prices, Consumer Confidence, Richmond Fed.
Market Structure (ES)
-
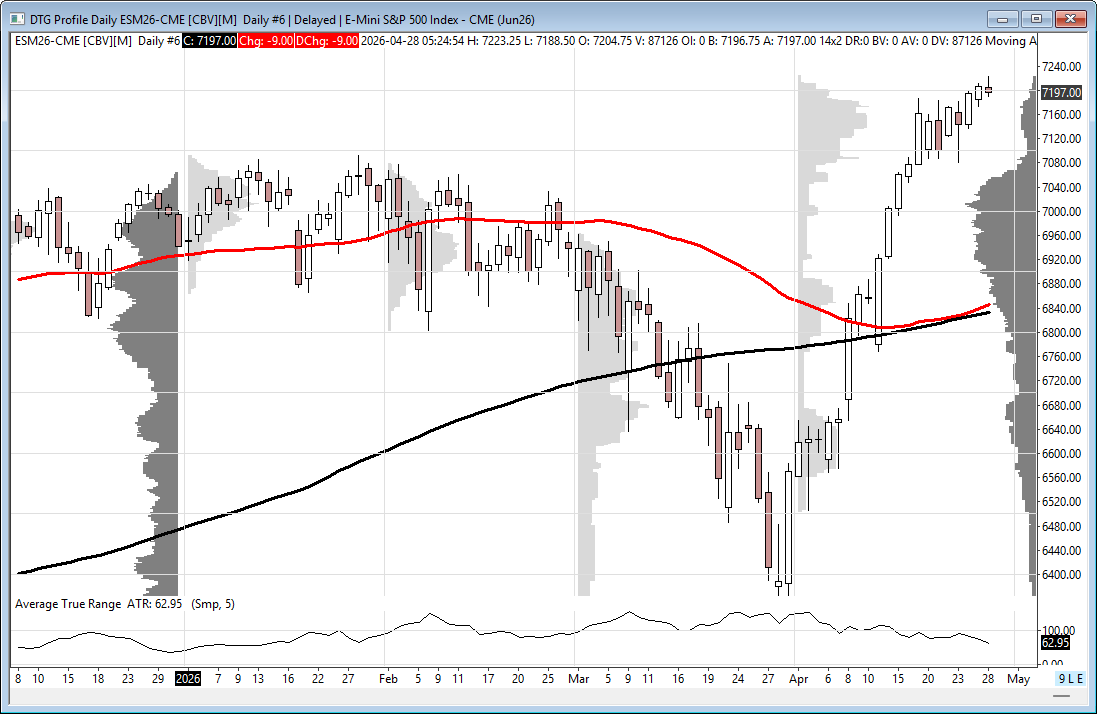
Volatility still elevated (5-day ADR ~75).
-
No strong overnight positioning (light/mixed volume).
-
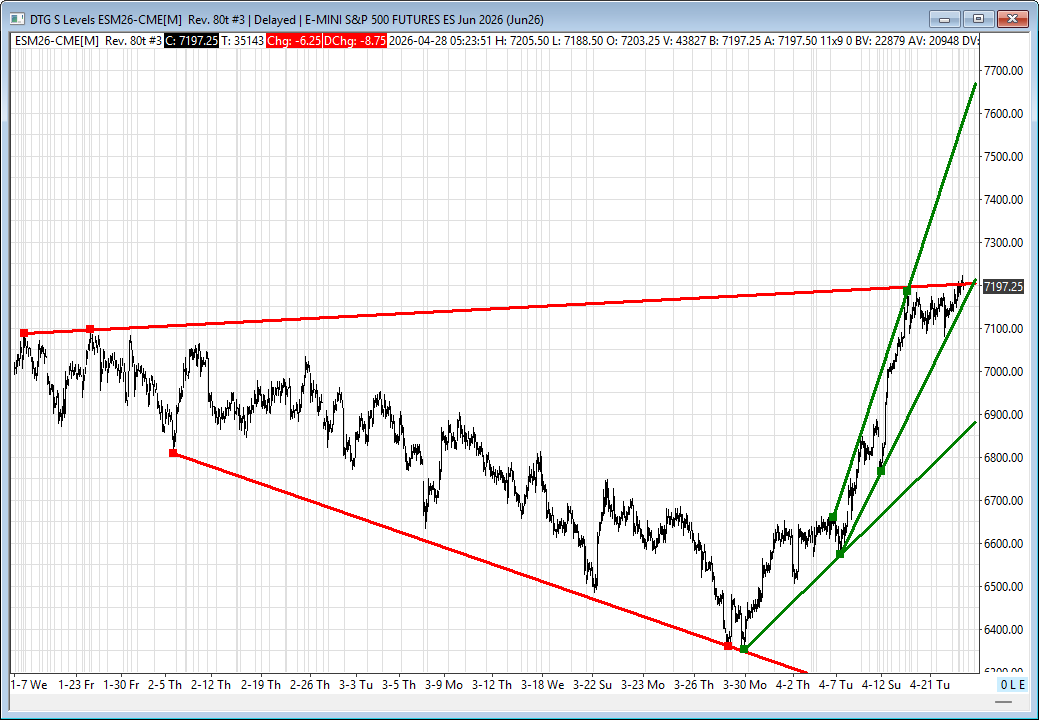
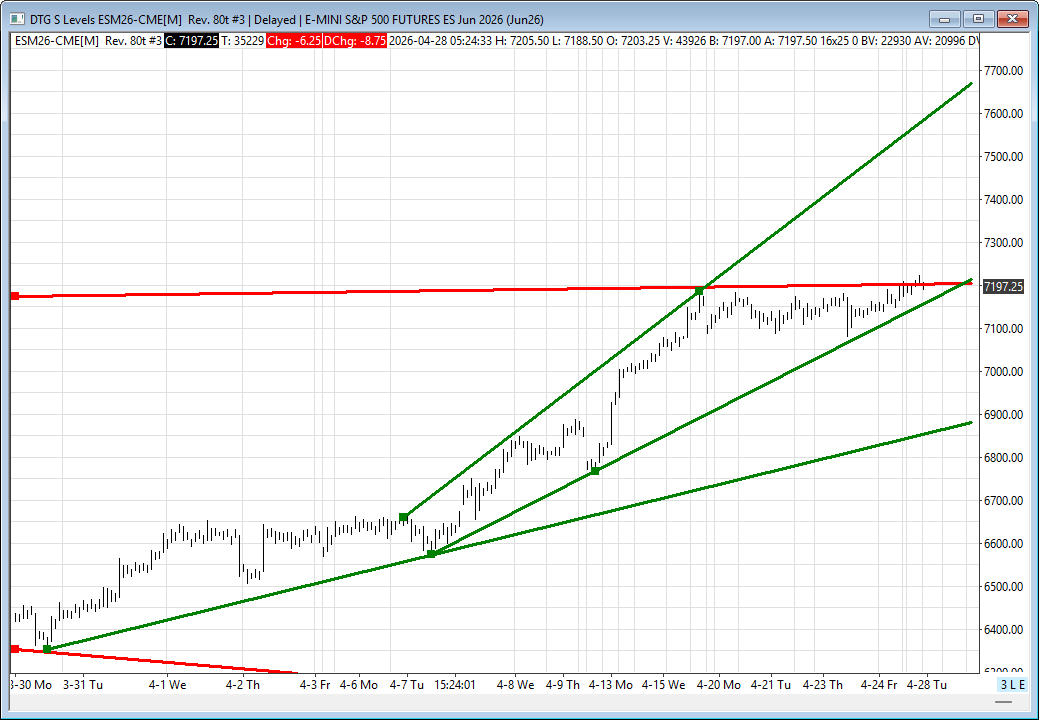
ES is compressing between key trendlines → breakout likely within days.
Key Levels
-
Resistance: 7204–7207 (near-term pivot), 7660–7665
-
Support: 7158–7163, 6874–6879, 6165–6160
-
Trend: Bullish MA structure (50D > 200D), but short-term range tightening
Bottom Line
Market is coiled for a move, with the Fed and Big Tech earnings likely to determine direction.
Affiliate Disclosure: This newsletter may contain affiliate links, which means we may earn a commission if you click through and make a purchase. This comes at no additional cost to you and helps us continue providing valuable content. We only recommend products or services we genuinely believe in. Thank you for your support!
Disclaimer: Charts and analysis are for discussion and education purposes only. I am not a financial advisor, do not give financial advice and am not recommending the buying or selling of any security.
Remember: Not all setups will trigger. Not all setups will be profitable. Not all setups should be taken. These are simply the setups that I have put together for years on my own and what I watch as part of my own “game plan” coming into each day. Good luck!
This post goes out as an email to our subscribers every day and is posted for free here around 2 PM ET. To get your real-time copy, sign up for the free or premium version here: Opening Print Subscribe.
Comments are closed