Today’s Action Will Come Down to Volume. Here’s Why
Follow @MrTopStep on Twitter and please share if you find our work valuable!
Every week, MrTopStep invites traders to an “Own the Close” contest where the closest guesstimate where the SPX will settle on Friday’s 4:00 cash close.
The winners get a free week’s access to the MrTopStep Chat and trading tools. Enter your guess now!
Our View
Friday was not the day I thought it would be.
Markets struggled all day as the red-hot S&P and Nasdaq took a rest. Friday’s mixed bag saw the Dow Jones futures fall 379 points or -0.94% — although it had its best week since mid-December — while the late-day drop pushed the ES into the red, down 22.75 points or -0.24% on the day. The NQ closed up 0.01% and at a new record high.
Two Fridays ago, the ES and NQ were trading lower but the markets reversed to new highs pushed by hopes that the era of high borrowing costs is coming to an end. That was reiterated by Federal Reserve Chair Jerome Powell last week, indicating that the central bank was still on pace to trim interest rates three times this year.
The way I see it, the jury is not out yet on the rate cuts, but the data will dictate that.
Our Lean
The week ahead starts today with the new home sale numbers and three Fed officials speaking. The rest of the week includes 11 additional economic releases, one Fed governor speaking and Powell speaking at the Federal Reserve Bank of San Francisco Macroeconomics and Monetary Policy Conference, San Francisco, Calif.
Remember, it’s a short week with markets closed on Friday. That’s also when we’ll get the PCE report (despite the market closure).
Friday was not a great close for the ES. What I didn’t add to my lean on Friday was that a lot of buying had been used up going into the expiration. Meaning traders were forced to liquidate, roll higher, or put out more cash. All of these are bullish, but all the buying power was used up there and after some big big moves, it was all a low-volume chop, with only 855k ES traded on the day session.
According to the Stock Trader’s Almanac, the last trading day of March (or the end of the quarter) has the Dow down 21 of the last 33 occasions, Russell 2000 up 25 of the last 34, and the Nasdaq up 21 of the last 33 days before Good Friday when the markets are closed. More from the Almanac in a minute.
Our lean is two-fold: 1. If the volume is low like Friday, then at some point we will drift higher. 2. However, if volume is steady, then I went to sell the rallies, meaning any 15 to 30 point rips.
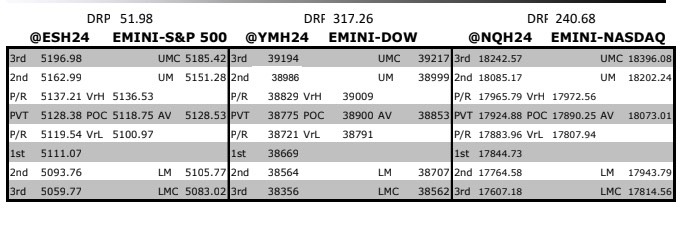
MrTopStep Levels:
MiM and Daily Recap
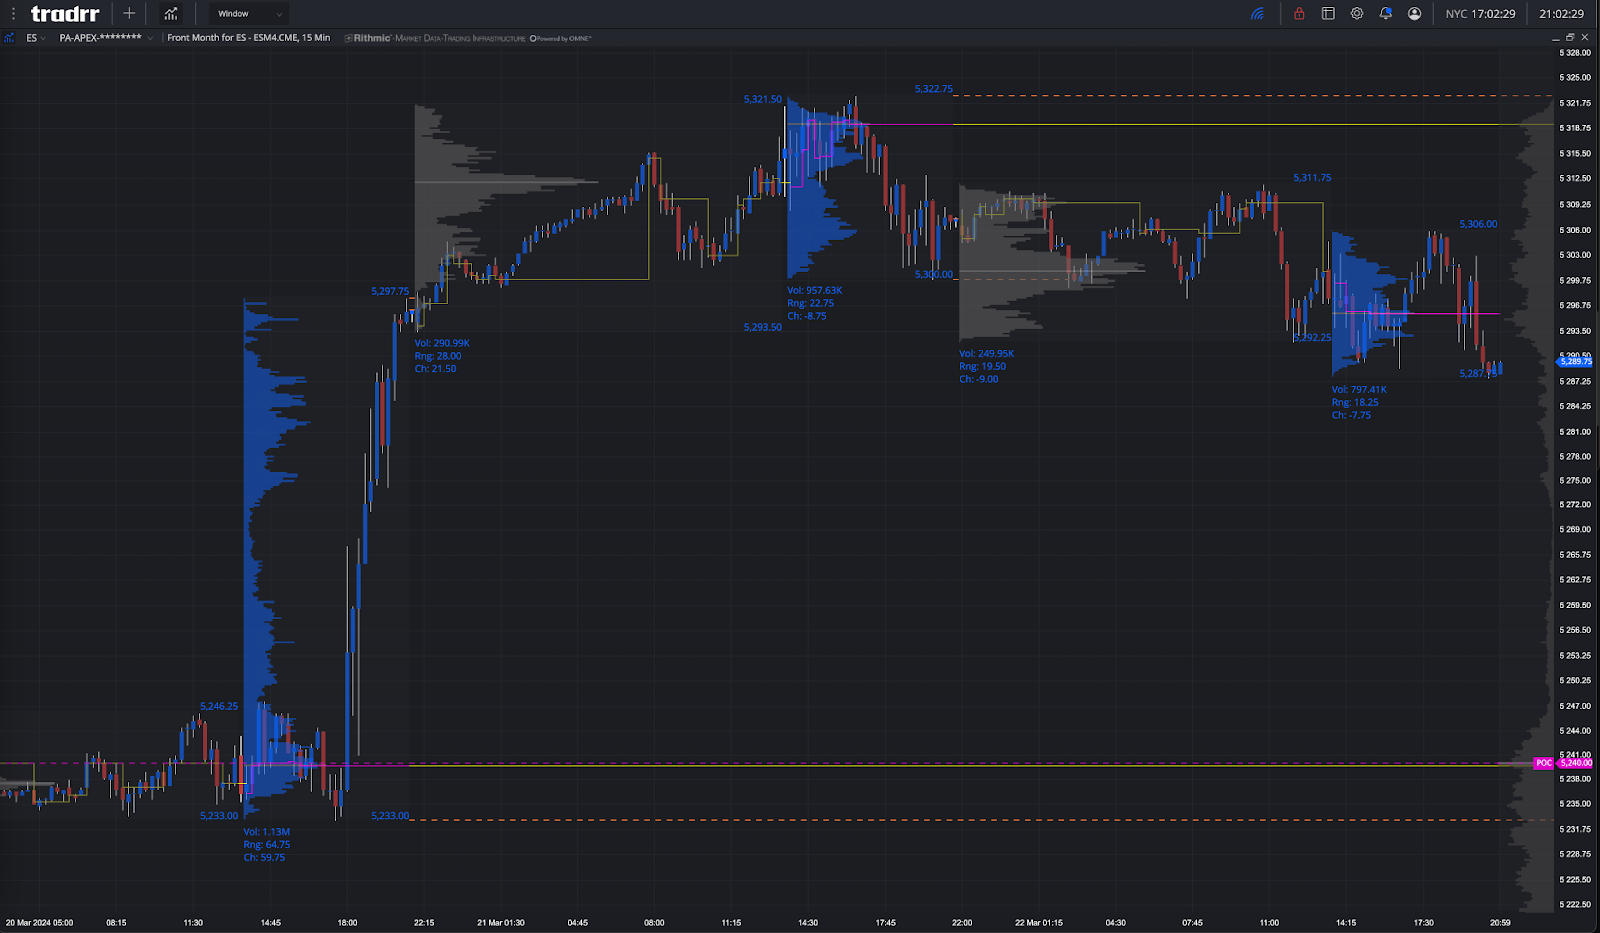
ES recap
The ES sold off down to 5292.25 on Globex the ES traded 5300.75. After the open… well not a lot happened and there was no busy first hour and a half. The ES traded 5304.75 at 9:41, rallied up to 5303.25, and then sold off down to the low of the day at 5289.75 at 11:02, and then did a sideways-to-up back-and-fill up to a lower high at 5298.25 at 11:37. Exactly one hour later it sold off down to a new session low by 3 ticks at 5289.00 and it was that low that set up a push up to a new high at 5306.00 at 2:09.
After the high, the ES pulled back down to 5291.25 at 3:18 as the NQ went up. After the down-tick, the ES rallied back up to 5300.50 at 3:45 and traded 5299.75 as the 3:50 imbalance showed $5.3 billion to buy, sold off down to 5297.00 and traded 5292 on the 4:00 cash close.
In the end, it was an extremely quiet day and I think that’s because the ES went up so much this week and many of the big options/futures accounts either covered or already rolled higher. In terms of the ES’s overall tone, it was “follow the leader” — the Nasdaq. In terms of the ES’s overall trade, volume was extremely low: 185k ES traded on Globex and 855k traded on the day session for a total of 1.040 million contracts traded.
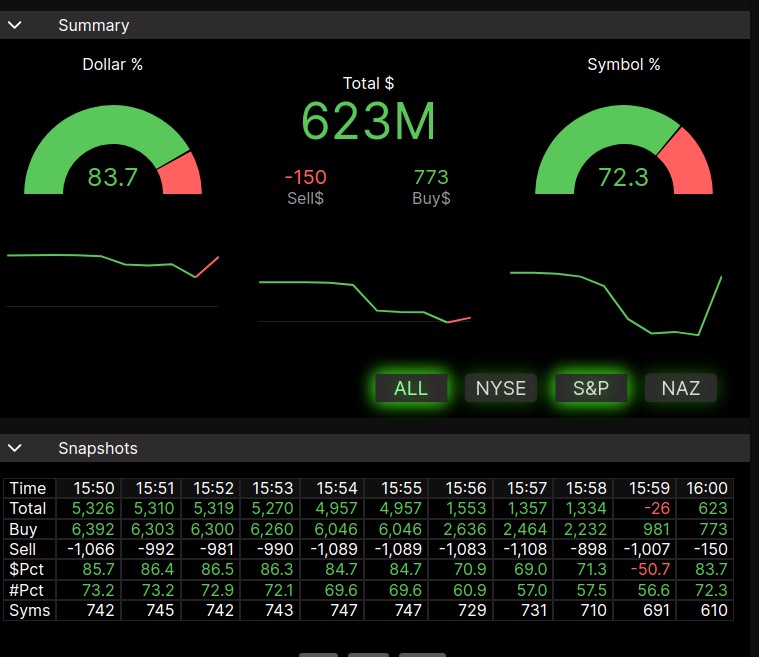
Friday’s MIM — notice how the big reveal trailed off by 4:00
Guest Post — Almanac Trader
The full post can be found here: Best Six Months Ends in April
From the post:
“After 5 months of solid gains, are markets ready for a pause?
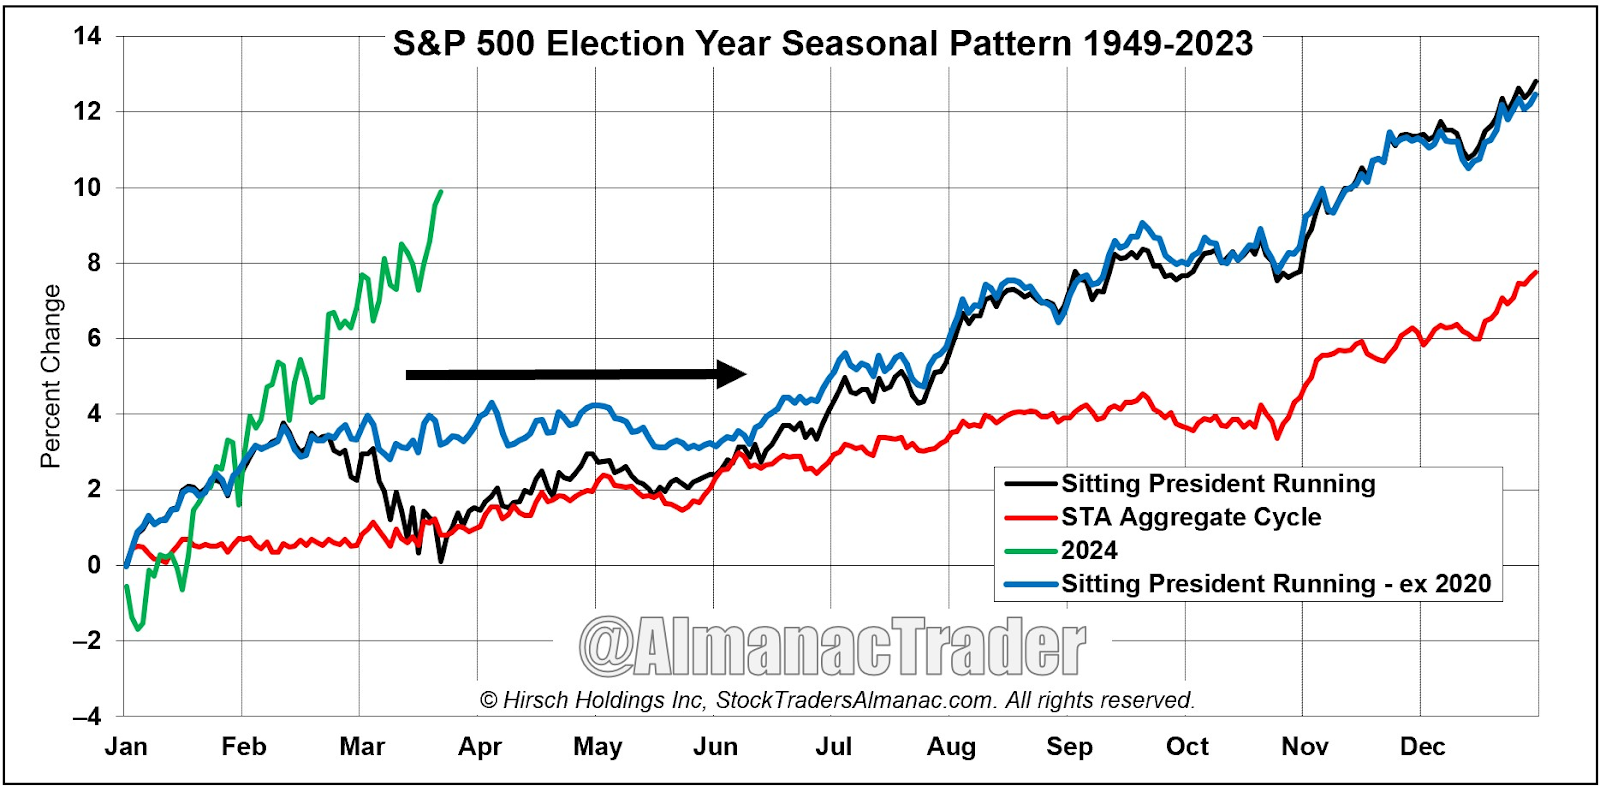
Bullish Presidential Cycle Sitting President Pattern flattens out the mid-February to late-March seasonal retreat considerably without 2020 in the average.
April is the final month of the “Best Six Months” for DJIA and the S&P 500. From our Seasonal MACD Buy Signal on October 9, 2023, through (March 21, 2024), DJIA is up 18.4% and S&P 500 is up 20.9%. Fueled by interest rate cut expectations and AI speculation, these gains are approximately double the historical average already and could continue to increase before the “Best Months” come to an end.
This AI-fueled bull market has enjoyed solid gains since last October and will likely continue to push higher in the near term, but momentum does appear to be waning with the pace of gains slowing. With April and the end of DJIA’s and S&P 500’s “Best Six Months” quickly approaching we are going to begin shifting to a more cautious stance. We maintain our bullish stance for 2024, but that does not preclude the possibility of some weakness during spring and summer.”
Economic Calendar
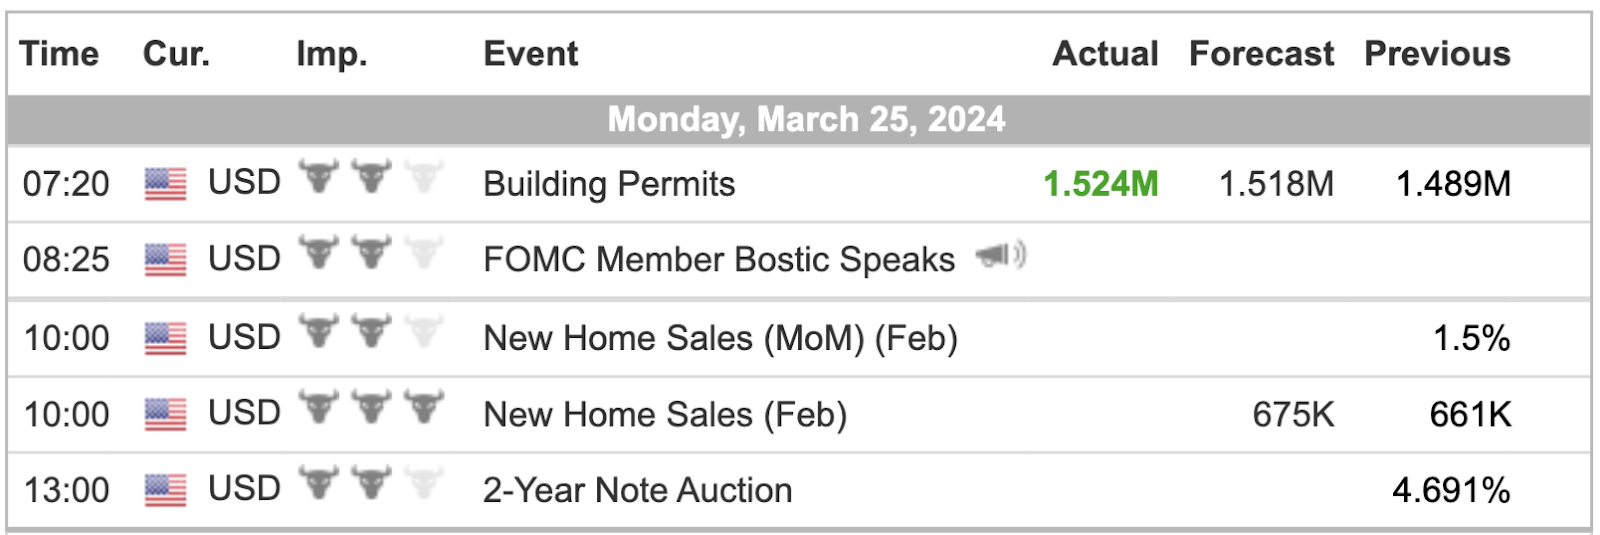
For a more complete Economic Calendar see: https://mrtopstep.com/economic-calendar/
Comments are closed