This post goes out as an email to our subscribers every day and is posted for free here around 2 PM ET. To get your real-time copy, sign up for the free or premium version here: Opening Print Subscribe.
Trend Is Your Friend—Until Seasonality Says Otherwise
Follow @MrTopStep on Twitter and please share if you find our work valuable!
Our View
Global Markets
Nikkei 225: +3.51%
Japan’s Nikkei 225 jumped to its highest close in around a year.
CAC 40: +1.06%
DAX: +0.83%
FTSE 100: +0.42%
European and other Asian indexes posted gains, with the FTSE 100 notching a record high.
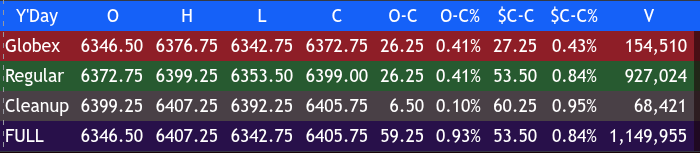
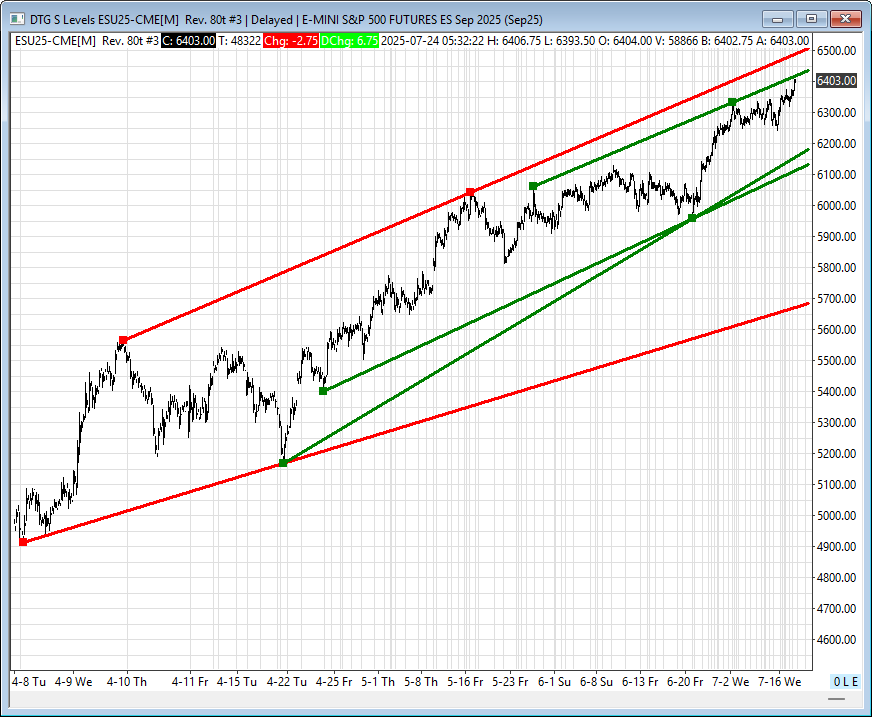
ESU25 (S&P 500 September Futures)
-
Globex high: 6376.75
-
Day session open: 6372.75
-
Day session high: 5407.25 (This looks incorrect – possibly a typo? Please verify)
-
Day session low: 6342.75
-
3:50 Cash Imbalance: Sell $250 million and widened to $1.7 billion to sell
-
4:00 Cash Close: 6399.25
-
5:00 Settlement: 6405.75, up 59 points or +0.93%
-
Total volume: 1.15 million contracts (low relative to the range size)
I think what we are seeing can be described in two words: irrational exuberance.
We can see how the bullish seasonals are playing out. The VIX sits at 16.40. The ‘fear and greed’ index is showing a high level of greed. And 83% of companies in the S&P have reported above analyst estimates, which is above the 5-year average of 78% and the 10-year average of 75%. Yet the data—particularly the inflation gauges—continues to paint a different picture.
Yesterday, the ES reached its 12th record close of the year, and the NQ has now made 14 new highs year-to-date as of July 23. It has also gone 62 days without crossing below its 20-day moving average, which marks the second-longest streak on record, after a 77-day run in 1999.
When looking at the seasonal trends, August’s net changes over the last 10 years are mixed: 2 unchanged, 4 up, and 4 down. It was up 2.35% in 2024, but down 1.7% in 2023 and down 4.2% in 2022. Total net gains over the 10-year period are +15.4%, while total losses are -13.9%, which makes it a slightly positive month overall.
September tells a different story. It’s been down in 7 of the last 10 years, with some large drops: down 4.9% in 2023, down 9.3% in 2022, down 4.8% in 2021, and down 3.9% in 2020. It was up 2.0% in 2024 and 1.9% in 2019. Most other Septembers flatlined, except for 2015 when the S&P fell 2.6%. When you total it up, the gains are +6% and the losses -25.6%, an average loss of 19.6%.
October has been split—5 up and 5 down—over the last decade. Notable moves include: down 0.91% in 2024, down 2.10% in 2023, up 8.10% in 2022, up 7.01% in 2021, down 2.77% in 2020, up 2.04% in 2019, down -6.48% in 2018, up 2.33% in 2017, down 1.94% in 2016, and up 8.44% in 2015. In total, October’s gains come to +27.92% and losses -14.56%, giving us a positive net of 13.36%, which supports the old trading adage that October is the bear killer.
If the S&P makes a high in July, I think the next two months could see some selling. August tends to post minimal gains, while September clearly leans bearish. Combined, August and September have had a total gain of +21.4% and a total loss of 39.5%, for a net of -18.1%.
Don’t get me wrong, I’m still a bull. But remember that when the bull market started in 2023, we did see a selloff of 5% or more. According to the Stock Trader’s Almanac, the week after July expiration is prone to wild swings. The last trading day of July has seen the Nasdaq and S&P down 12 of the last 19 years, and the Dow down 13 of the last 19.
The first trading day of August has the Dow down 18 of the last 27, with the first 9 days of August tending to be weak. Historically, August is the second-worst month for both the Dow and S&P from 1988 to 2023.
In the end, the ES and NQ both made new all-time highs. In terms of tone, they were firm on Tuesday’s close and stayed firm all day Wednesday. Volume on the ES was steady at 1.1 million contracts traded.
Our Lean
As I said in yesterday’s OP: the number one rule in trading is the simplest one—the trend is your friend. Don’t forget it.
But as we approach weaker seasonality, I think we could see a pullback soon.
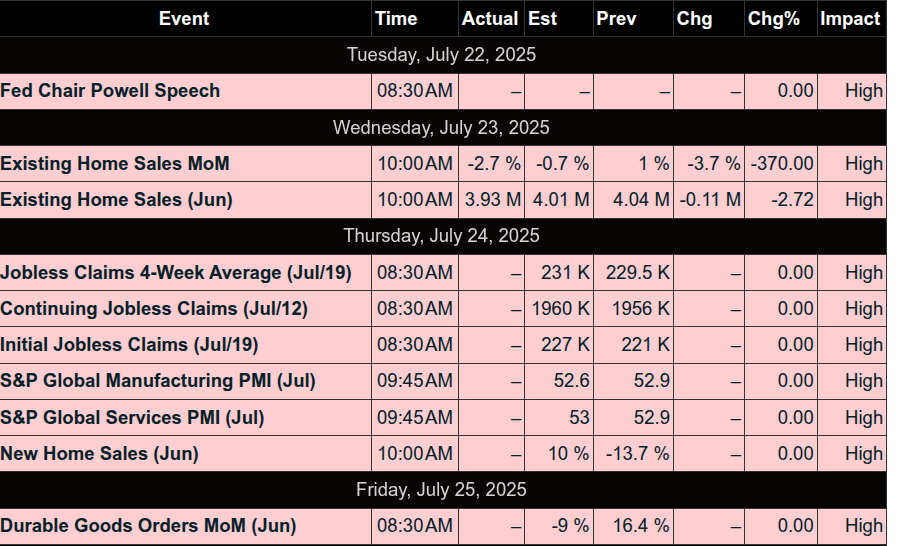
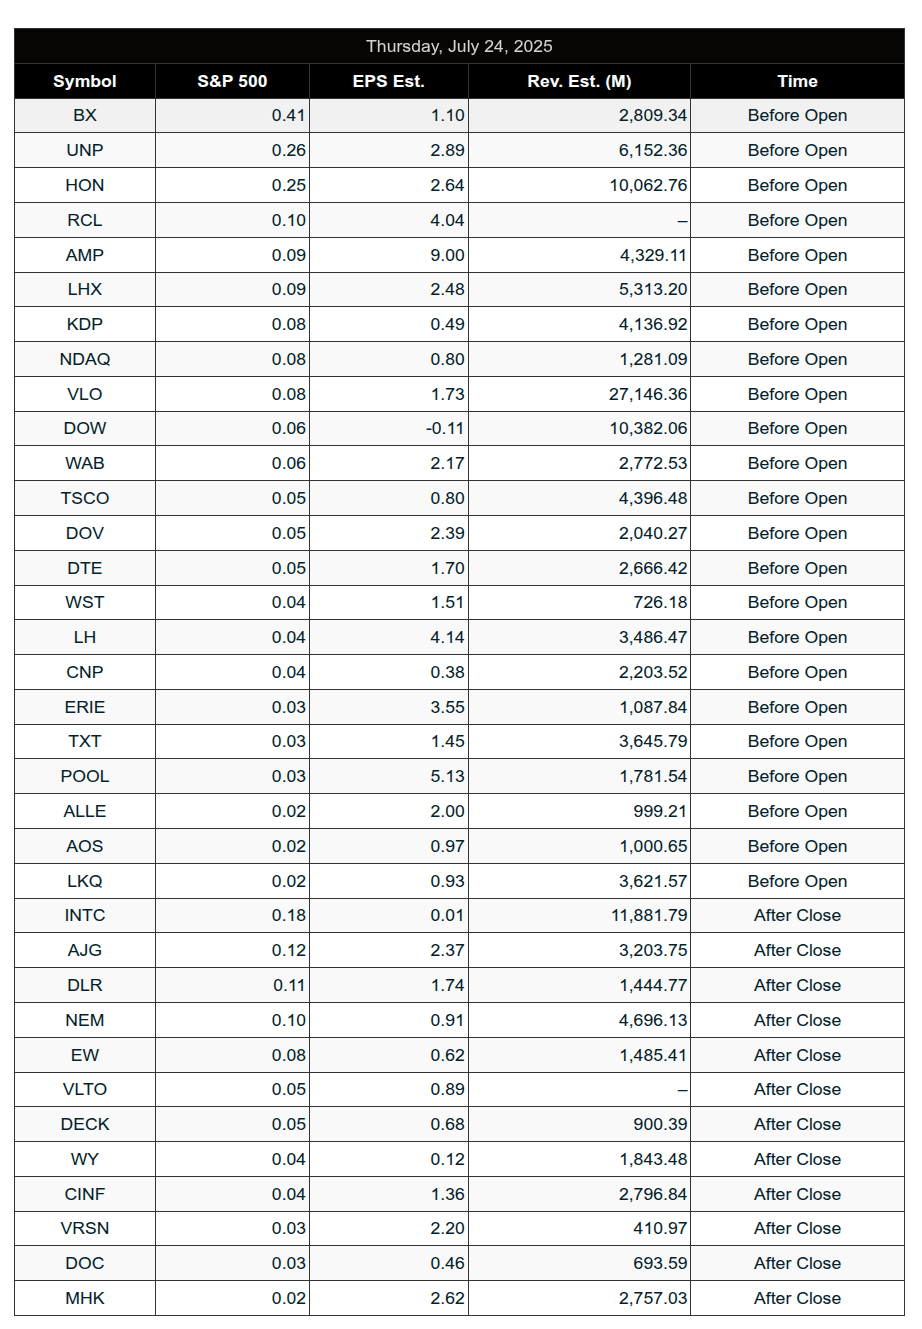
Today’s economic calendar includes Initial Jobless Claims at 8:30, S&P PMI at 9:45, and New Home Sales at 10:00. On the earnings front we have BX,UNP and HON. The notional value of Friday’s options expiration is $3.4 trillion. All I can say is: welcome to the DOG DAYS OF SUMMER—and to tech earnings season.
Our lean: The ES and NQ are overdue for a pullback, but they’re showing no signs of retreating yet. I expect a two-way trade early in the day and will look for the PitBull’s Thursday low ahead of Friday’s expiration.
Levels I’m watching:
-
To the upside: 6408, 6420, 6438, and 6453
-
To the downside: 6400, 6390, 6373, and 6350
From Jeff Hirsch of the Stock Trader’s Almanac (@AlmanacTrader):

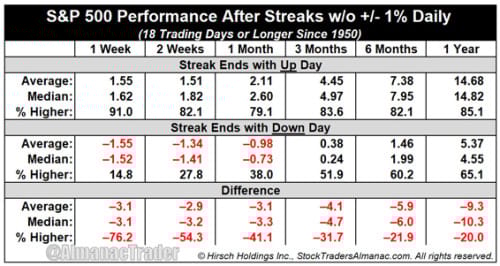
How Low Volatility Streaks End Matter!
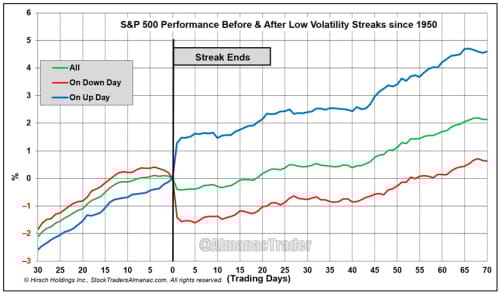
Of 175 past S&P 500 low volatility streaks (closing with less than +/- 1%) since 1950, 108 ended with the S&P 500 declining 1% or more. This is 61.7% of the total and explains why, on average, all streaks tended to be followed by S&P 500 weakness. However, when the 175 past streaks are separated by how they ended, the difference in S&P 500 performance is eye-popping. Streaks that ended with a gain were bullish while those that ended with a loss were generally bearish.
MiM and Daily Recap
Intraday Recap:
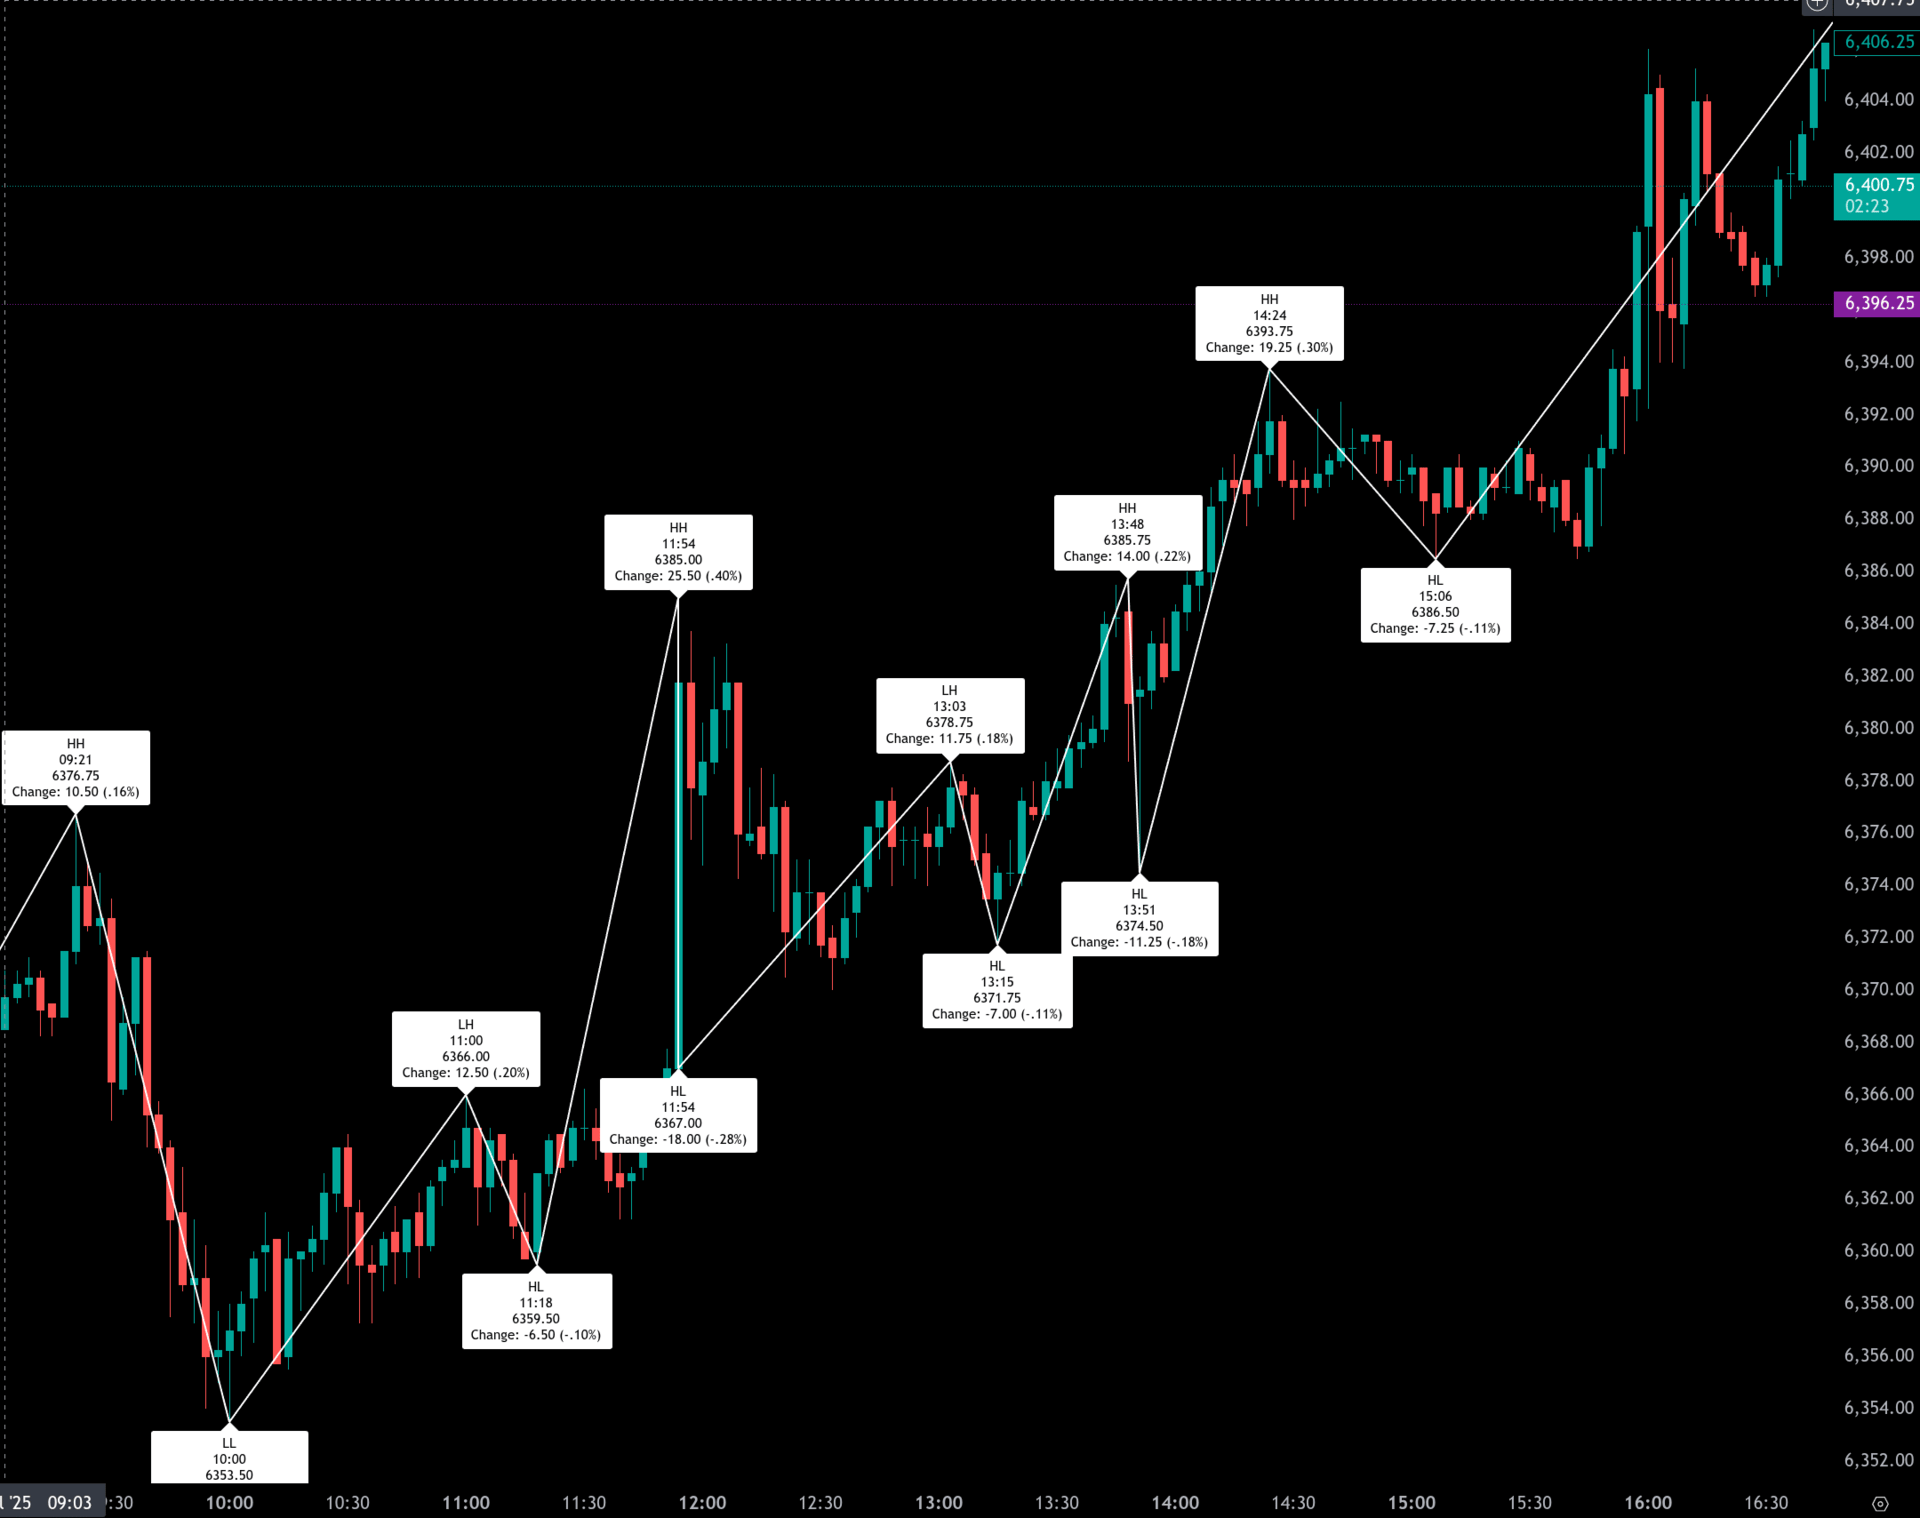
The overnight Globex session saw a modest upward grind off early weakness. Price initially pulled back to 6342.75 at 18:45, marking the session low, before rallying sharply into 19:45 where it peaked at 6364.25. A pullback to 6349.00 at 21:00 was followed by steady accumulation through the early morning hours. The ES climbed to 6367.50 at 03:15, retreated briefly to 6360.50 at 03:45, and then extended again to 6374.25 by 06:15. A final dip to 6363.00 at 07:00 preceded the Globex high of 6376.75 at 09:15, setting the tone for the cash open.
The regular session began at 6372.75 and dropped to a morning low of 6335.50 by 10:00, completing a 19-point decline from the open. A strong rebound followed, lifting the ES to 6366.00 at 11:00 and then pulling back modestly to 6359.50 by 11:18. Buyers returned in force, sparking a vertical rally to 6385.00 at 11:54 based on tariff news. A mild retracement to 6371.50 at 13:15 was met with dip-buying strength that pushed price up to 6393.75 at 14:24.
From there, price eased to 6385.00 at 15:06 before launching higher once more in the final hour. The ES rallied 21.25 points into the regular session close, printing 6399 at 16:00,
Volume was heaviest during the cash session, with 927,024 contracts traded versus 154,510 during Globex. The full session logged 1,149,955 contracts.
On the full day, the ES gained 59.25 points (+0.93%) from the open and 53.50 from the previous day’s cash close. The regular session alone advanced 53.50 points (+0.84%) from the previous cash close, with both the Globex and cash segments contributing equally (+26.25 each).
Market Tone & Notable Factors:
The tone was bullish throughout, with an initial dip quickly reversed and strength building into the close. The rally was steady and stair-stepped, suggesting broad participation and strong intraday demand. Price showed resilience through midday pullbacks and ultimately pushed through prior resistance into fresh closing highs.
Market-on-Close (MOC) data revealed a strong bearish imbalance, with -$1.022B to sell and a -71.1% symbol skew favoring the sell side in the NASDAQ. Despite this, the ES held firm into settlement, suggesting the imbalance was either anticipated or absorbed without derailing the upward move.
Overall, the day concluded on a bullish note, with ES closing at session highs and continuing the broader trend higher. The price action reflects continued upward momentum despite late-session selling pressure, hinting at sustained buying interest heading into the next session.
Guest Posts:
Dan @ GTC Traders
The Quiet Discipline of a Robust Quantitative Trading Program
True quantitative trading isn’t a race for headlines or a chase for the next big score.
It’s a grind.
Methodical, deliberate, and, frankly, a bit unglamorous. At pir private proprietary firm, we’ve spent years honing programs behind the ironclad walls of non-disclosure agreements. I can’t spill every detail. NDAs are what they are. But I can pull back the curtain just enough to share the philosophy that keeps our process steady. And demonstrate a process that is kept away and separate from that Private Proprietary firm. Something designed specifically for GTC Traders.
Why “Robust” Matters
Robustness isn’t about crafting a system that dazzles with past performance or promises the moon. It’s about building something that holds up when markets throw curveballs, regime shifts, data anomalies, or those “where did that come from?” moments. Our Quad Trading Program, now live in the Short-Term Trading Account portion of the Sample Portfolio, is a case study in this. It’s posted a modest gain north of 1.38% in its first few weeks, with drawdowns so minimal they barely ripple the surface.
But returns aren’t the story here. Discipline is.
No Chasing, No Wandering
“Method-hunting” is any traders cardinal sin. tweaking a system to hug historical data like a glove. And when that fails, going to hunt up something else. We don’t play that game. Our team gathers weekly, not to overhaul parameters or chase shiny new edges, but to ask disciplined questions:
-
Are market correlations drifting in ways that challenge our assumptions?
-
Has volatility skew nudged our risk procedures off course?
-
Do our P&L trajectories still align with our mandate for steady, incremental gains?
When adjustments are needed, they’re surgical. Deliberate, documented, and rigorously tested. No knee-jerk rewrites, no ego-fueled “look at my genius” pivots. Think of it as pruning a hedge, not redesigning the garden.
The Reality of Running a Program
The truth of the matter is that a well-built trading program should feel routine. Not thrilling, not nerve-wracking. Just consistent. Signals fire, positions size, risk limits hold the line. If you’re white-knuckling every trade, something’s off.
Our Quad Program leans on four uncorrelated strategies. Equity momentum, Periodicity ‘Shifts’ to Rate Momentum (or lack thereof) and Volatility overlays. Each designed to contribute small, steady edges. It’s not about fireworks; it’s about doing the same thing, day in and day out, with relentless precision.
Come and Watch the Systemic Repetitive Nature
We’re opening a way for aspiring traders to peek into how a prop desk runs, without crossing our proprietary lines. We are sharing a dashboard tracking our Quad Program’s live P&L and risk metrics, post weekly research notes on market shifts and small tweaks. It’s a window into this process, plain and simple.
This isn’t a never-ending upsell. It’s a coaching model: once you’ve seen how a private prop desk conducts ongoing research and maintains rigor, our goal is for you to run your own programs without perpetual hand-holding. We’re not here to keep you tethered; we’re here to help you build your own process.
Why Consistency Trumps Flash
As of late, indices as benchmarks flirt with nosebleed valuations and it seems every other month has a new ‘tape-bomb’, chasing blockbuster returns is a trap. Our Quad Program is built for resilience, not attempting the impossible task of trying to predict the next macro shock. If one market stumbles, another is quietly supporting it. If rates rally or they fall, there are methods designed to take advantage of either scenario. The goal isn’t to outsmart the market. It’s to stay disciplined, stay within statistical bounds, and keep showing up every day.
Running a robust quantitative program isn’t about riding the wave of macro drama or outguessing the next headline. It’s about disciplined research, cautious iteration, and execution that hums along like a well-oiled machine. At GTC Traders, we want to show you what that looks like. Not to make you dependent on our calls, but to empower you to develop your own. The market will always surprise, but a robust system doesn’t flinch. It just keeps doing the work.
Until next time, stay safe and trade well …
Technical Edge
Fair Values for July 24, 2025
-
S&P: 35.76
-
NQ: 149.98
-
Dow: 196.61
Daily Breadth Data 📊
For Wednesday, July 23, 2025
• NYSE Breadth: 74% Upside Volume
• Nasdaq Breadth: 65% Upside Volume
• Total Breadth: 66% Upside Volume
• NYSE Advance/Decline: 68% Advance
• Nasdaq Advance/Decline: 69% Advance
• Total Advance/Decline: 68% Advance
• NYSE New Highs/New Lows: 146 / 15
• Nasdaq New Highs/New Lows: 303 / 32
• NYSE TRIN: 0.70
• Nasdaq TRIN: 1.18
Weekly Breadth Data 📈
For the Week Ending Friday, July 18, 2025
• NYSE Breadth: 53% Upside Volume
• Nasdaq Breadth: 64% Upside Volume
• Total Breadth: 60% Upside Volume
• NYSE Advance/Decline: 42% Advance
• Nasdaq Advance/Decline: 54% Advance
• Total Advance/Decline: 49% Advance
• NYSE New Highs/New Lows: 207 / 76
• Nasdaq New Highs/New Lows: 473 / 177
• NYSE TRIN: 0.62
• Nasdaq TRIN: 0.64
BTS Levels:
ESU2025
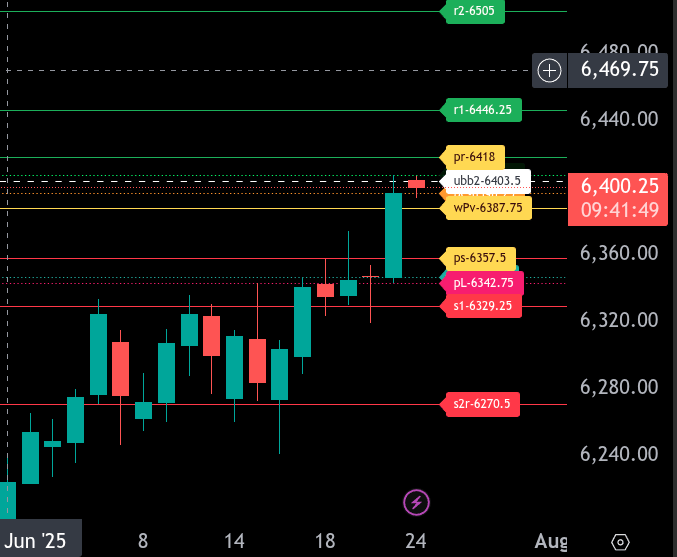
The bull/bear line for the ES is at 6387.75. This level defines the line in the sand for today’s session. Currently, ES is trading above it at 6400.50, indicating a bullish stance in the pre-market.
If buyers maintain control above 6387.75, the upside targets are 6418.00, the upper range target for today, followed by resistance at 6446.25. A breakout above that level could stretch to 6454.75.
On the downside, if ES slips back below 6387.75, support sits at 6357.50, which is today’s lower range target. Below that, the next key levels are 6342.75 and 6329.25.
NQU2025
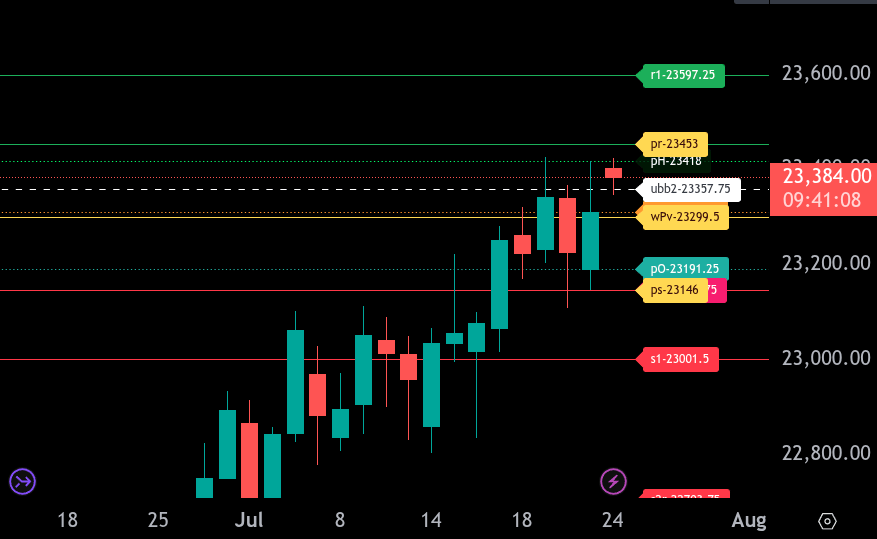
The bull/bear line for the NQ is at 23,299.50. This is the key level to watch for directional bias. Currently, NQ is trading above it at 23,383.75, indicating a bullish lean in the pre-market session. If price holds above 23,299.50, the upper range target for today is 23,453.00. A continued move higher could test 23,597.25, which stands as the next major resistance level. The double highs at the 23,418 area are proving a tough nut to crack. Watch that level for bullish progression.
If NQ falls back below the bull/bear line, watch for support at 23,191 and 23,146.75, the lower range target. A breakdown through that zone could open the door to further selling down to 23,001.50. For now, bulls control the tape as long as price remains above 23,299.50.
Calendars
Economic Calendar Today
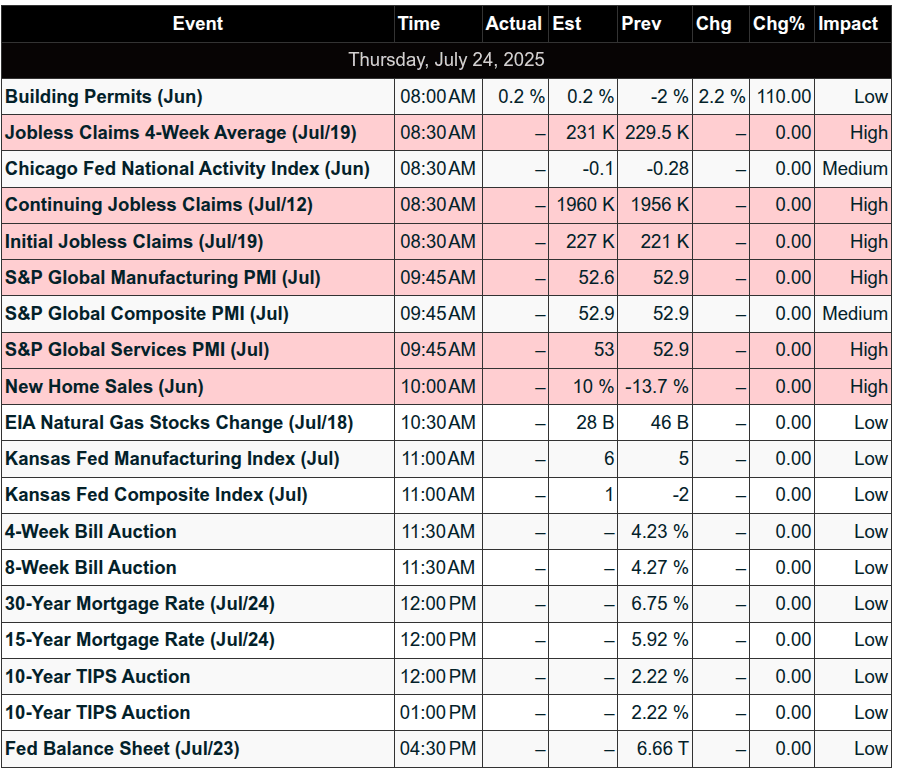
This Week’s High Importance
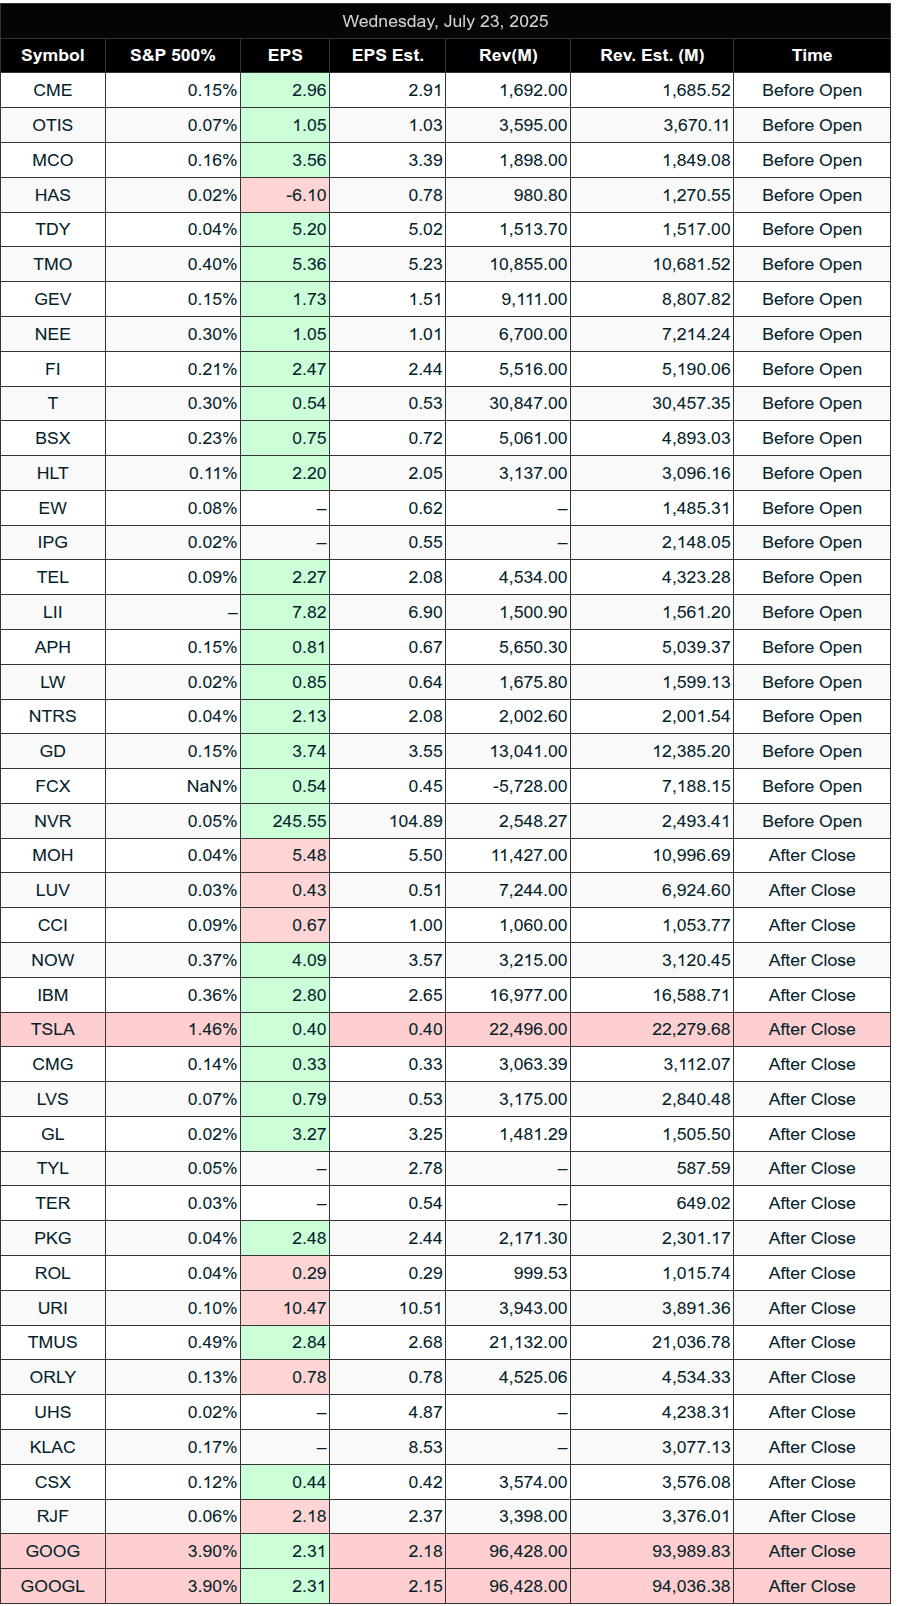
Earnings:
Released
Trading Room News:
Polaris Trading Group Summary: Wednesday, July 23, 2025
Overview:
A classic Cycle Day 1 unfolded with bullish control from the overnight session through the close. Despite a slow, low-volume start, price action confirmed key levels, leading to a trend-up day that fulfilled multiple upside targets and ultimately broke out to new all-time highs above 6400.
Positive Trade Highlights:
-
Price held above the DTS Line in the Sand at 6345 overnight and rallied past the 6360 target early in the session.
-
Both Cycle Day 1 targets, 6368 and 6374, were achieved in the morning session.
-
Initial opening sandbox was defined between 6360–6375, with early control held by buyers above VWAP at 6365.
-
A temporary fade below VWAP triggered aggressive selling, but bulls successfully defended the prior high at 6353.75, which became a key support zone.
-
Following a midday consolidation period, a news-driven spike (EU tariff update) gave the market renewed momentum.
-
The afternoon session saw the 6389 Cycle Day 1 target fulfilled, followed by a surge to new all-time highs through the 6400 round number.
-
Despite a growing MOC sell imbalance into the close ($1.7B), the market continued to push higher, indicating strong institutional demand.
Lessons and Takeaways:
-
The session confirmed a key PTG principle: Cycle Day 1s with shallow or no early decline often produce strong upside trends.
-
VWAP and prior session highs acted as important technical markers for judging buyer control and entry opportunities.
-
PTGDavid demonstrated patience, staying flat during choppy mid-morning action and waiting for high-probability setups.
-
Traders were reminded to listen to subtle market clues — as PTGDavid said, “Mr. Market speaks softly… but are you listening?”
-
Even during slow volume environments, the structural integrity of the market can foreshadow significant moves later in the session.
Closing Notes:
-
The A4, A10, and Discount levels paid late in the day, confirming strong buyer engagement into the close.
-
The day ended on a high note with the market printing new all-time highs above 6400, reinforcing the importance of staying aligned with dominant market structure.
Affiliate Disclosure: This newsletter may contain affiliate links, which means we may earn a commission if you click through and make a purchase. This comes at no additional cost to you and helps us continue providing valuable content. We only recommend products or services we genuinely believe in. Thank you for your support!
Disclaimer: Charts and analysis are for discussion and education purposes only. I am not a financial advisor, do not give financial advice and am not recommending the buying or selling of any security.
Remember: Not all setups will trigger. Not all setups will be profitable. Not all setups should be taken. These are simply the setups that I have put together for years on my own and what I watch as part of my own “game plan” coming into each day. Good luck!
This post goes out as an email to our subscribers every day and is posted for free here around 2 PM ET. To get your real-time copy, sign up for the free or premium version here: Opening Print Subscribe.
Comments are closed