Volatility Can Remain High Into Election
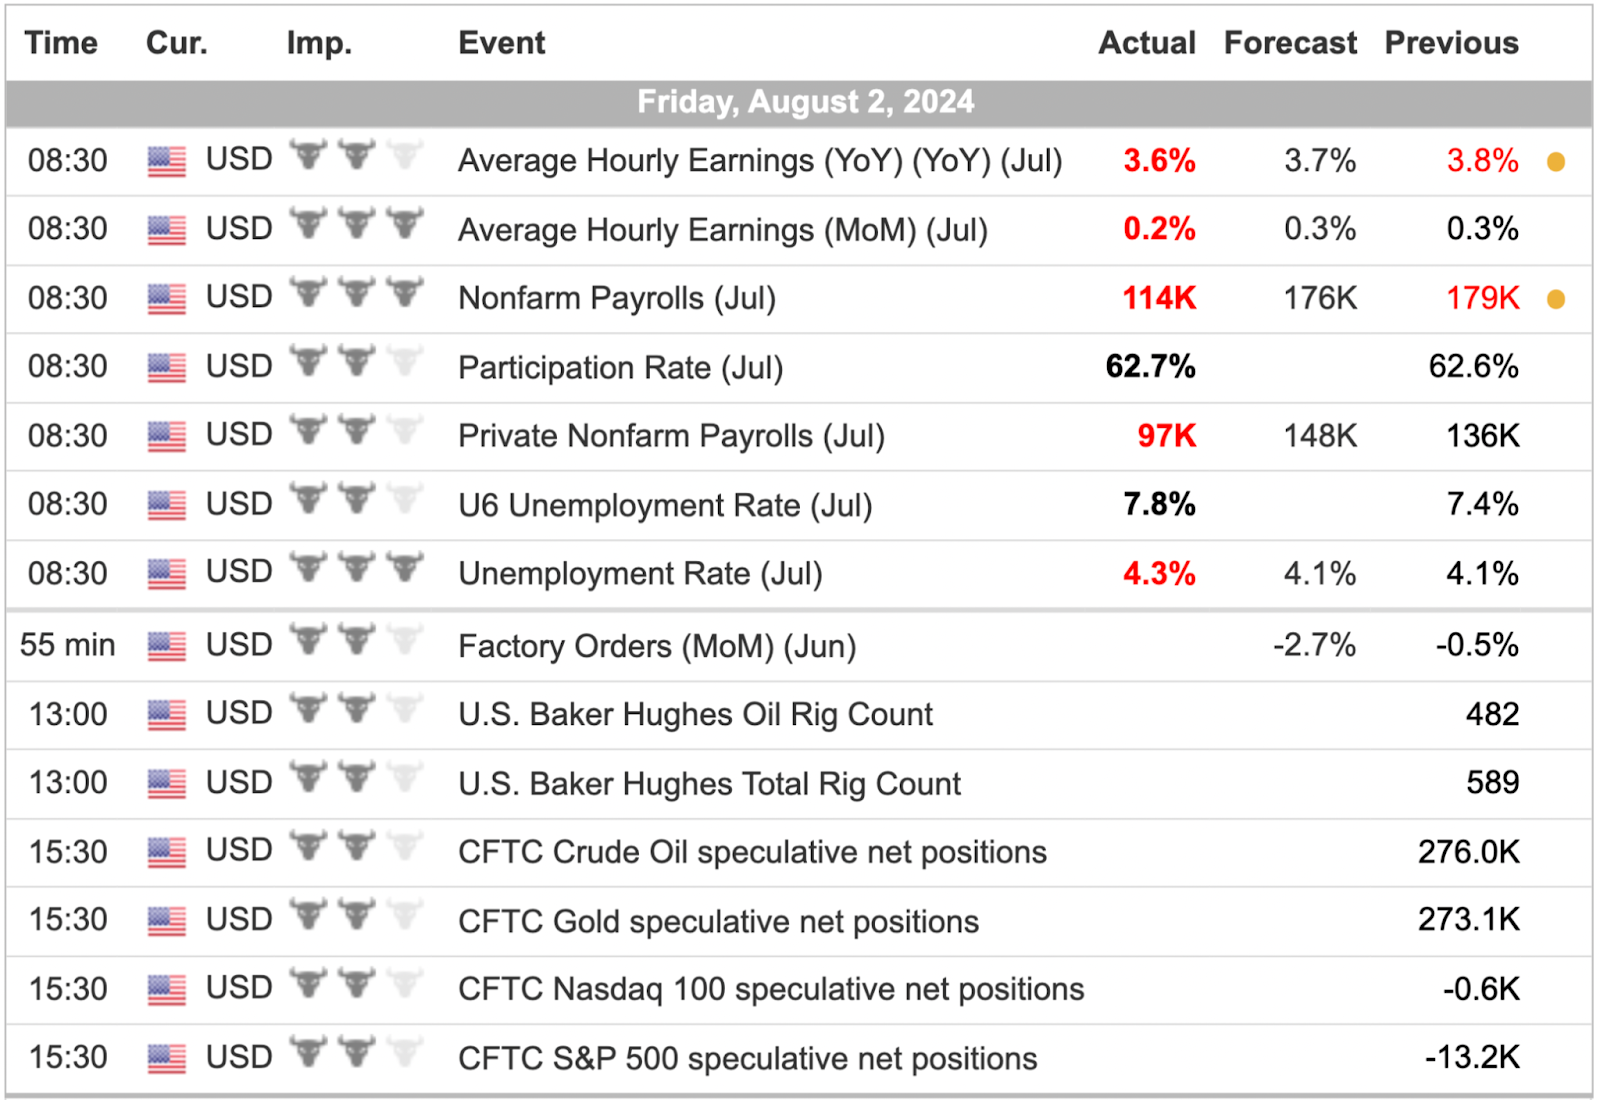
Jobs report badly misses estimates
Follow @MrTopStep on Twitter and please share if you find our work valuable.
Our View
As you are learning, I don’t always say “buy” or “sell.”
Instead, I describe movements like the NQ rallying 930 points in 24 hours and reference the MrTopStep trading rule, which notes that the ES and NQ “tend to go sideways to down after a big rally.” Yesterday was an example of this, with a significant early rise followed by a much larger decline. As I’ve mentioned many times, volatility will likely remain high right into the election and beyond.
When I spoke to the PitBull, he was upset. Do you know what he was mad about? That he’s not short! He described the situation as “silly” and believes the market will go back down. According to his analysis, the period from the last week of July to the end of the third week of August is typically weak, and he thinks the ongoing conflict in the Middle East is about to escalate, with the election not helping matters.
As you know, I am generally a bull market guy, and while I might fade the bull on occasion, I’m uncertain about doing so in this case. The Nasdaq rotation showed its ugly side yesterday (ES down 1.78% and Nasdaq down 3.12%).
As I mentioned yesterday, and while I’m not sure this is a good thing, I haven’t seen more 100+ point swings since March 2020. The Nasdaq had its largest intraday swing since November 2022 and ended down 1.4%. The NQ hit a high of 19,717.00 after the open, then sold off to 18,854.00, marking an 863-point drop after a 927-point range on Wednesday. The ES reached a high of 5600.75 at 9:50 and sold off to 5444.75 just after 4:00, a 156-point drop in 6 hours and 10 minutes, averaging a loss of 25.5 points every 61.5 minutes.
Our Lean
The only thing I can say is… expect the unexpected. Today is a double whammy. It’s the first August Friday options expiration and the July jobs report. Powell for the most part kept the September rate cut on track but today’s jobs report could be pivotal.
Our lean is if the ES gaps lower sharply lower, I want to buy the open or the first drop after the lower open using a tight stop if there is 300k to 400k ES traded on Globex. The trend is still down and the ES and NQ are still in a “sell all rallies” mode and I would sell a higher open or the first rally above the gap up but I really think there will be some kind of pop up today.
If not and the ES breaks down through the 5432 level it could be a quick trip down to 5400 and then 5375-5380. It doesn’t look good and with Iran and its proxies preparing to attack Israel it’s probably not a good idea to be long over the weekend. The PitBull keeps talking 5200-5300.
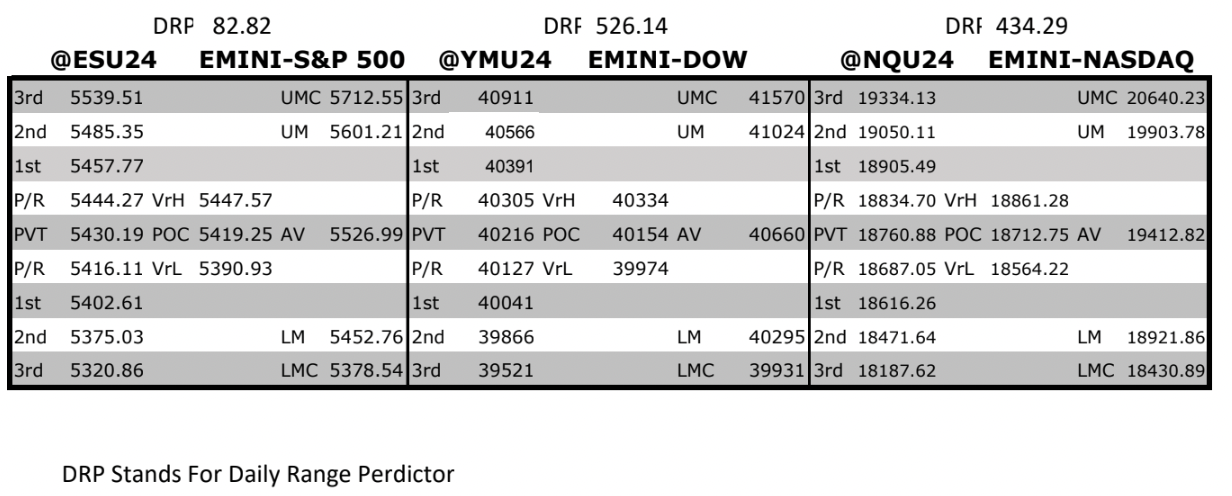
MrTopStep Levels:
MiM and Daily Recap
ES Recap
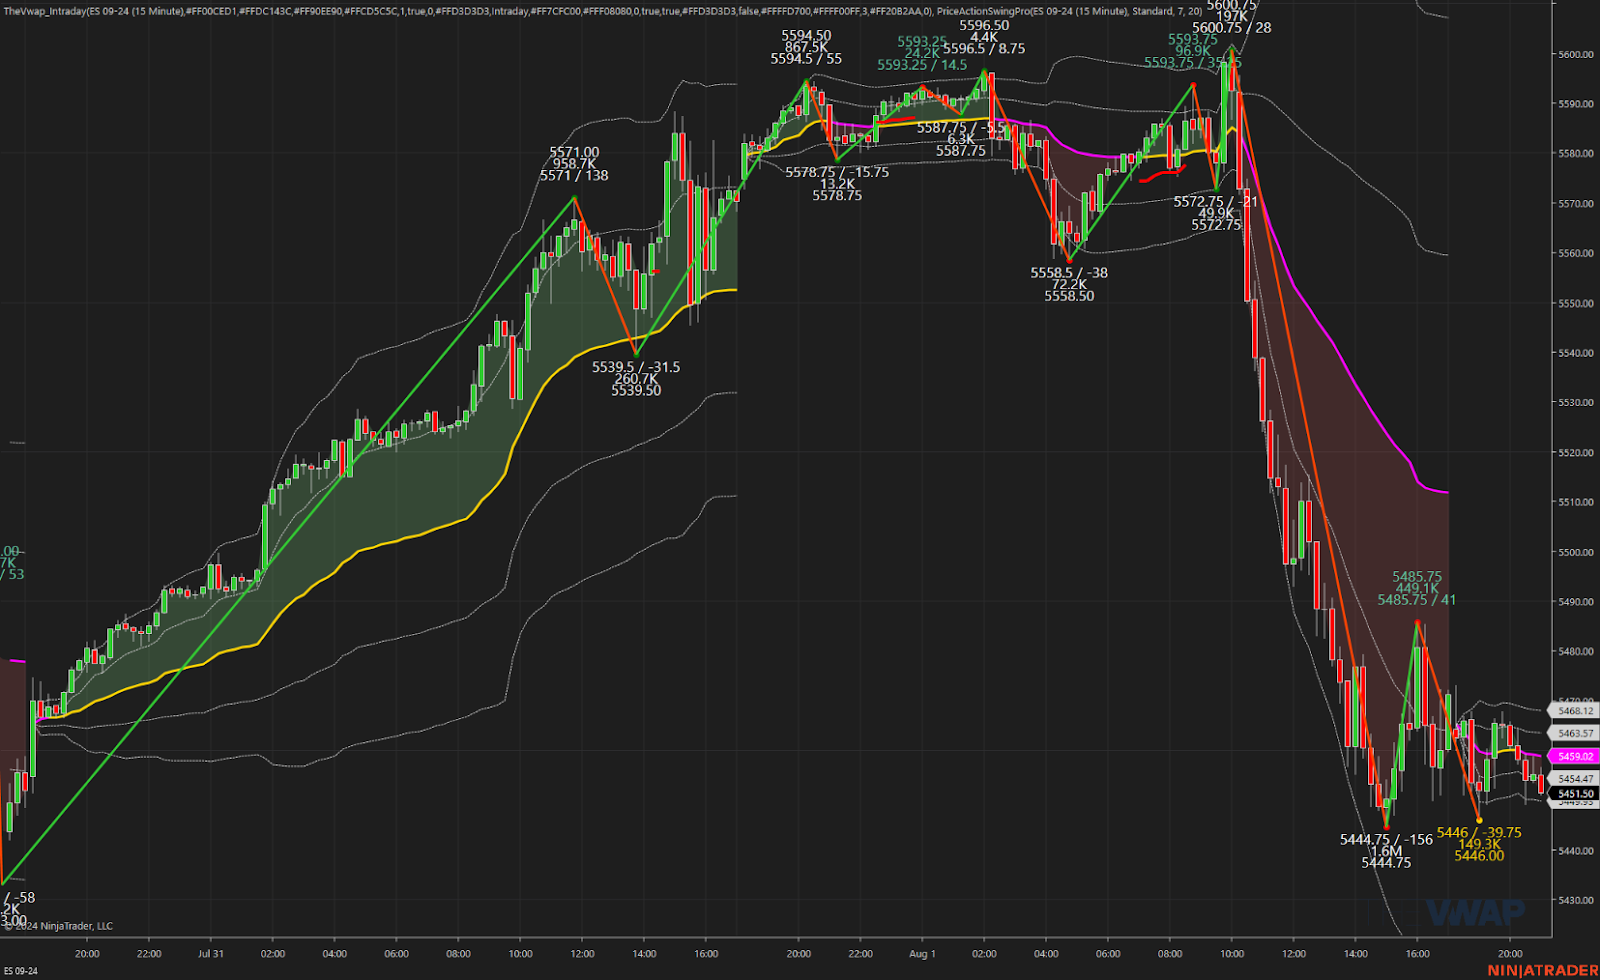
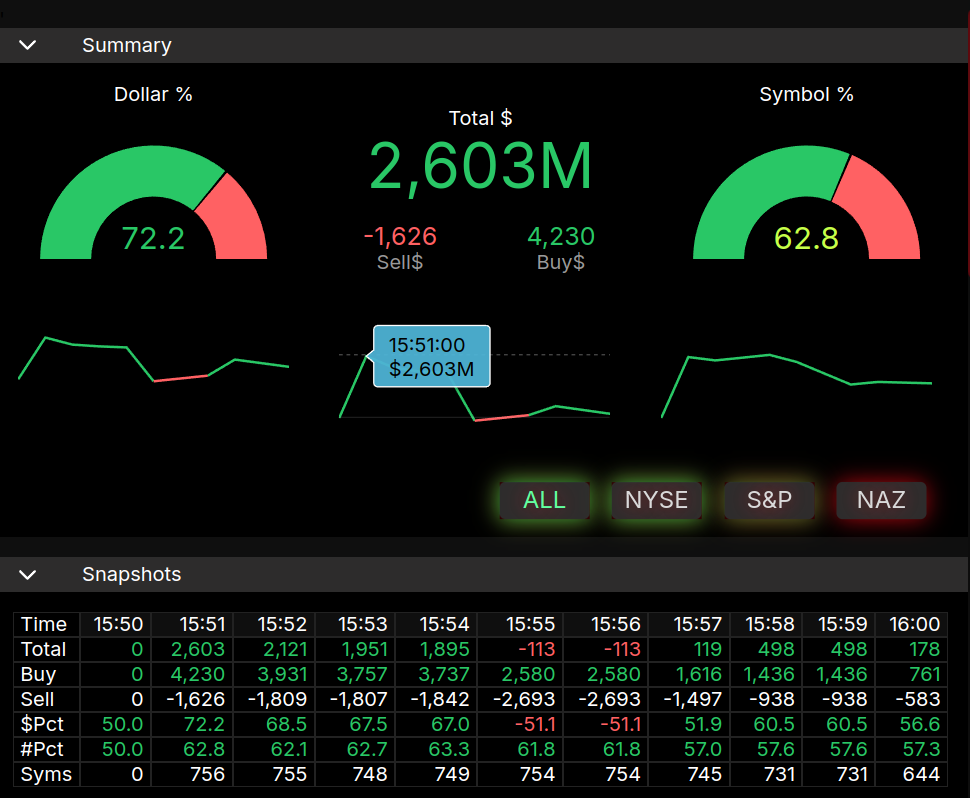
The ES traded up to 5596.50 on Globex at 2:00 AM and opened Thursday’s regular session at 5578.00. After the open, the ES traded 5576.25, then rallied to 5600.75 before selling off 107 points to 5493.00 at 11:44. It’s easier to track when both the ES and NQ experience a crash. After this low, the ES rallied to 5515.50, then dropped to 5455.25 at 1:54. It rallied to 5479.50 and then fell to a new low of 5448.25, down 121.75 points or -2.15% at 2:33. After a small bounce, the ES traded down to the low of the day at 5444.75, then moved up to 5475.25 at 3:40, dropped to 5462.00 at 3:44, and jumped to 5475.50. It traded at 5484 as the 3:50 cash imbalance showed $2.6 billion to buy, rallied to 5485.75, then reversed to 5464.50 at 3:55, and rallied back to 5481.00 at 3:58:30. It settled at 5480.50 on the 4:00 cash close.
After 4:00, the ES rallied to 5485.50, then fell to 5457.25, and rallied to 5475.00 after Amazon reported weaker-than-expected revenue for the second quarter and issued disappointing guidance. Intel dropped 17% after announcing job cuts and suspending its dividend, and Apple slid after reporting weaker iPhone sales. The ES sold off to 5450 at 4:27 and settled at 5471.25, down 99 points or -1.78%. The NQ settled at 18,967.75, down 611.75 points or -3.12%, erasing most of Wednesday’s 2.6% gain.
December gold settled at 2490.90, up 17.90 points or +0.72%. The 10-year note (ZNU4) settled at 112’245, up 30.5 points or +0.85%, with yields falling below 4% for the first time since February and marking the largest one-day yield decline since December 2013 for both the 2-year and 10-year notes. The 30-year bond (ZBU4) settled at 122’15, up 1.22 points or +1.40%. The Russell 2000 (RTYU4) settled at 2197.50, down 75.80 points or -3.32%, and crude futures lost $1.60 a barrel to end at $76.31.
In the end, it was another big rally and larger failure. In terms of the ES’s overall tone it acted weak but not as weak as the NQ. In terms of the ES’s overall trade, volume was high at 2.661 million contracts traded. The highest volume during the selloff was on July 25 at 2.888 million.
Technical Edge
-
NYSE Breadth: 24% Upside Volume
-
Nasdaq Breadth: 29% Upside Volume
-
Advance/Decline: 32% Advance
-
VIX: ~20.50
Guest Post — “MadHatter”
This is from a friend of mine I’ve known a long time, but wishes to remain anonymous:
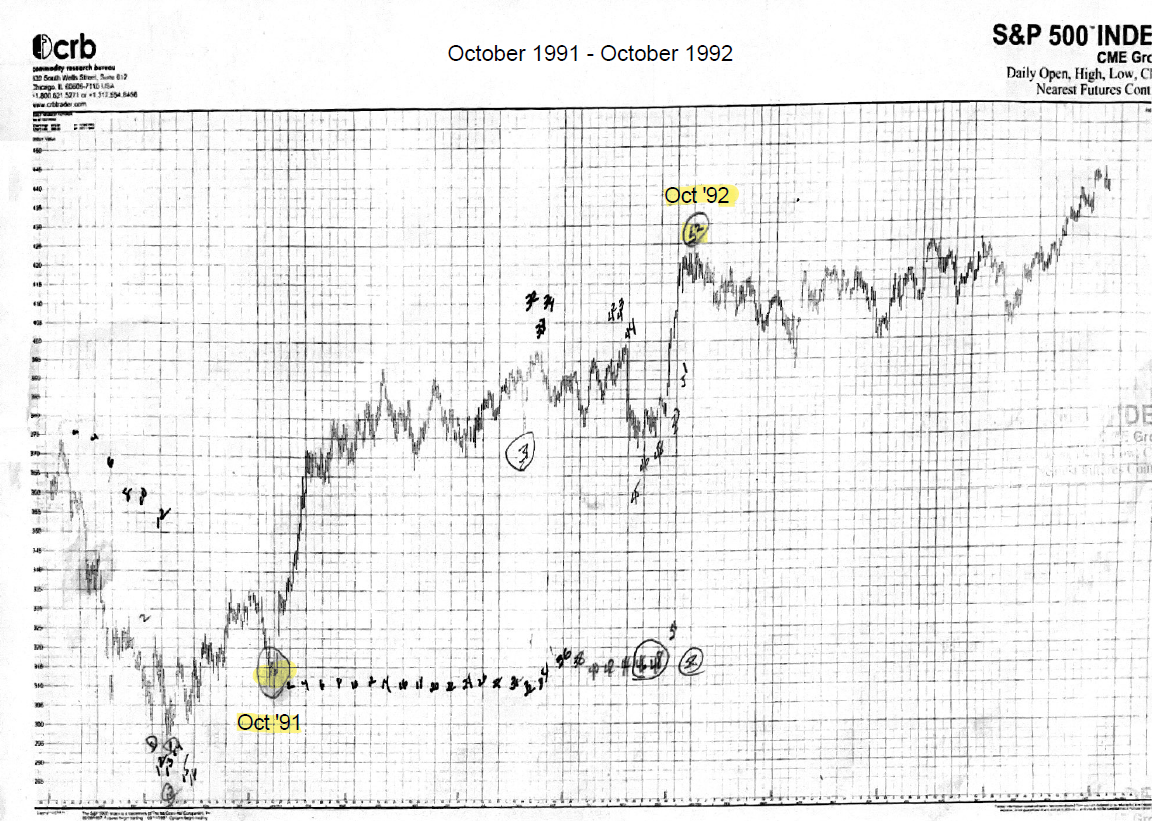
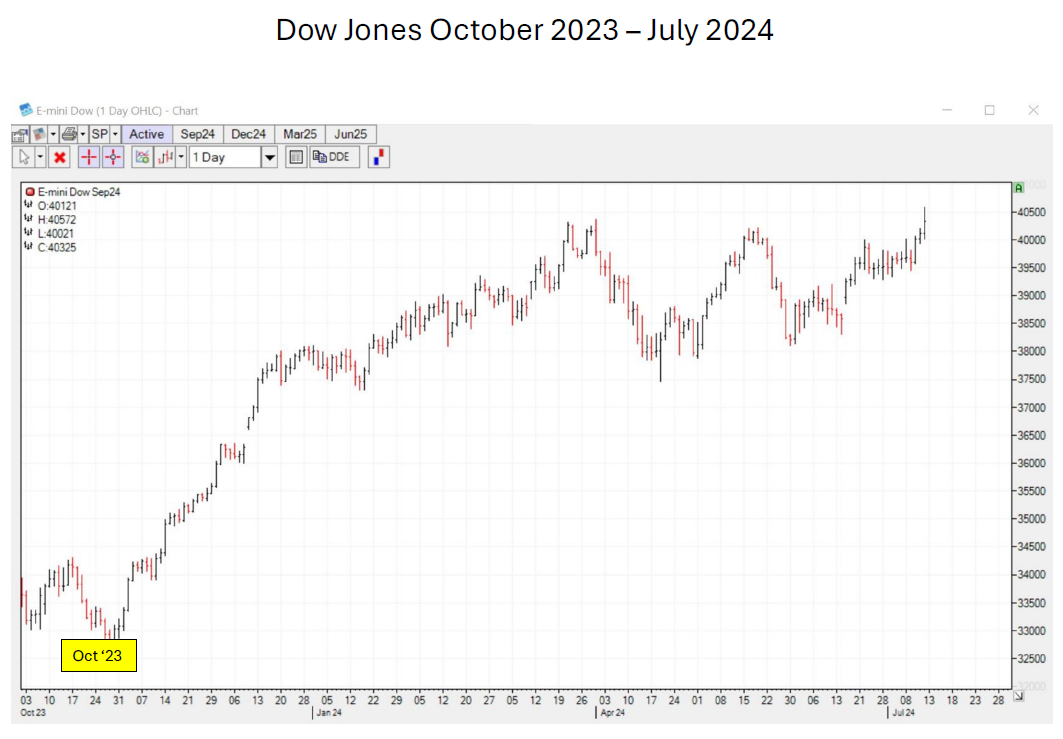
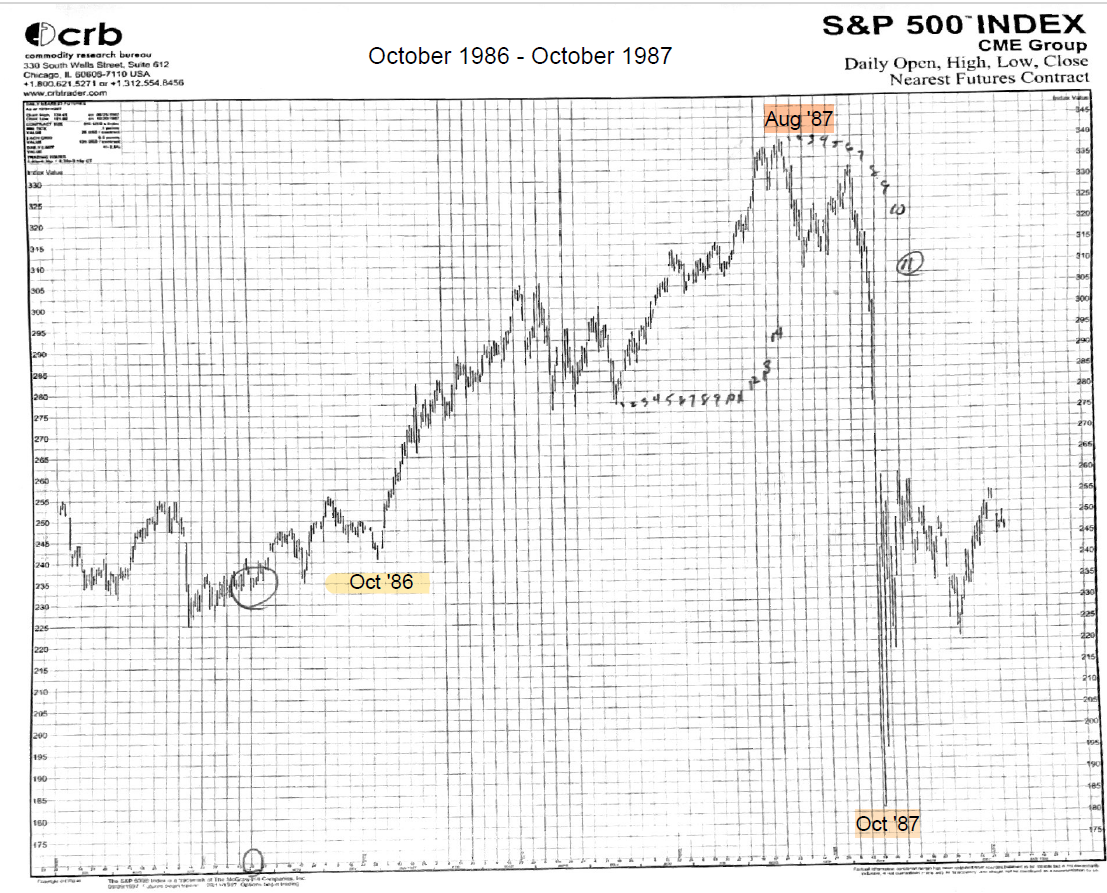
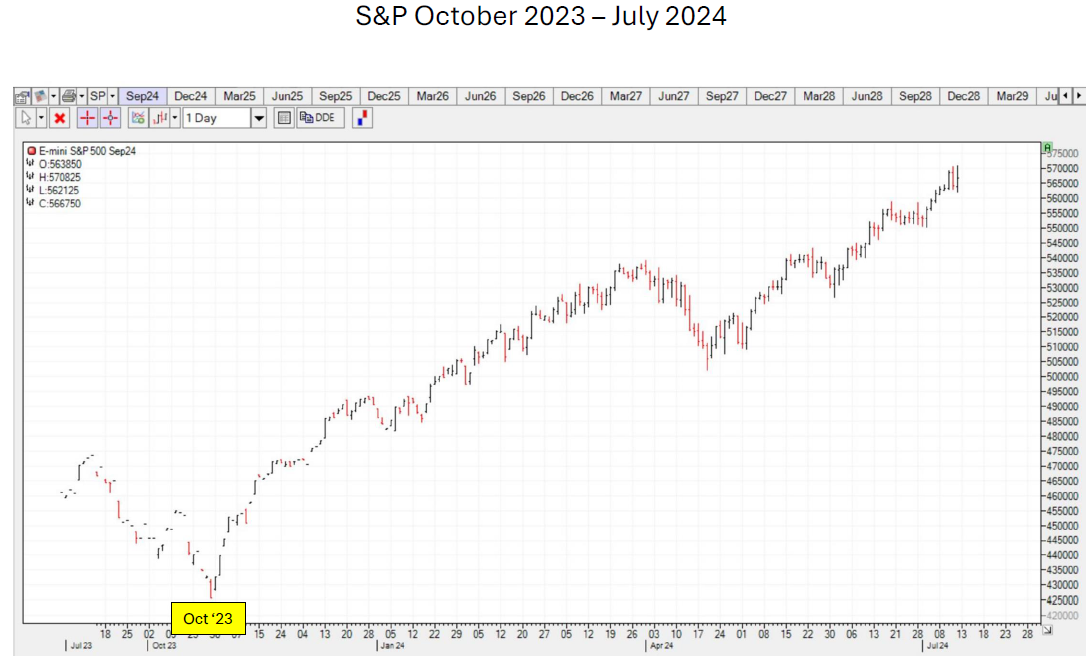
The similarities between today’s S&P/Dow futures and the market during 1991-1992 (Gulf war) and 1987 are undeniable. Based on past markets, we are looking at a big trade opportunity.
Currently, the Dow Jones is following the market in 1991-1992 during the Gulf war. Additionally, the S&P is mirroring the market but also could be projecting a high seen in August of 1987. In both instances, the markets hit their lows in October of the prior year and rose until either October the following year or in 1987, made trading high in August.
The key here is to see how the market reacts in July and the first 2 weeks of August. If we are at a high, the markets should fall into the end of October. However, if we’re at a trading low in mid-August, we’ll rally into week 52 (end of Oct), both of which correspond with the election.
Economic Calendar
For a more complete Economic Calendar see: https://mrtopstep.com/economic-calendar/
Comments are closed