Volatility Explosion
The VIX is up 170% right now
Follow @MrTopStep on Twitter and please share if you find our work valuable!
Every week, MrTopStep invites traders to an “Own the Close” contest where the closest guesstimate where the SPX will settle on Friday’s 4:00 cash close.
The winners get a free week’s access to the MrTopStep Chat and trading tools. Enter your guess now!
Our View
I said I didn’t think the ES could fall 5%, and I was wrong. As of the recent low, the ES is now 9% off its all-time contract high and the NQ is down 17% from its all-time high. The NQ is still up about 4% YTD, and from the 2024 low, it is still up 8.5%, while the ES is up 8.3% and 11%, respectively. The NQ and ES are still up 15.5% and 16%, respectively, over the last 12 months.
So why am I posting this? It’s to highlight that despite the recent declines, the indices are still up and over longer stretches, they are still up significantly.
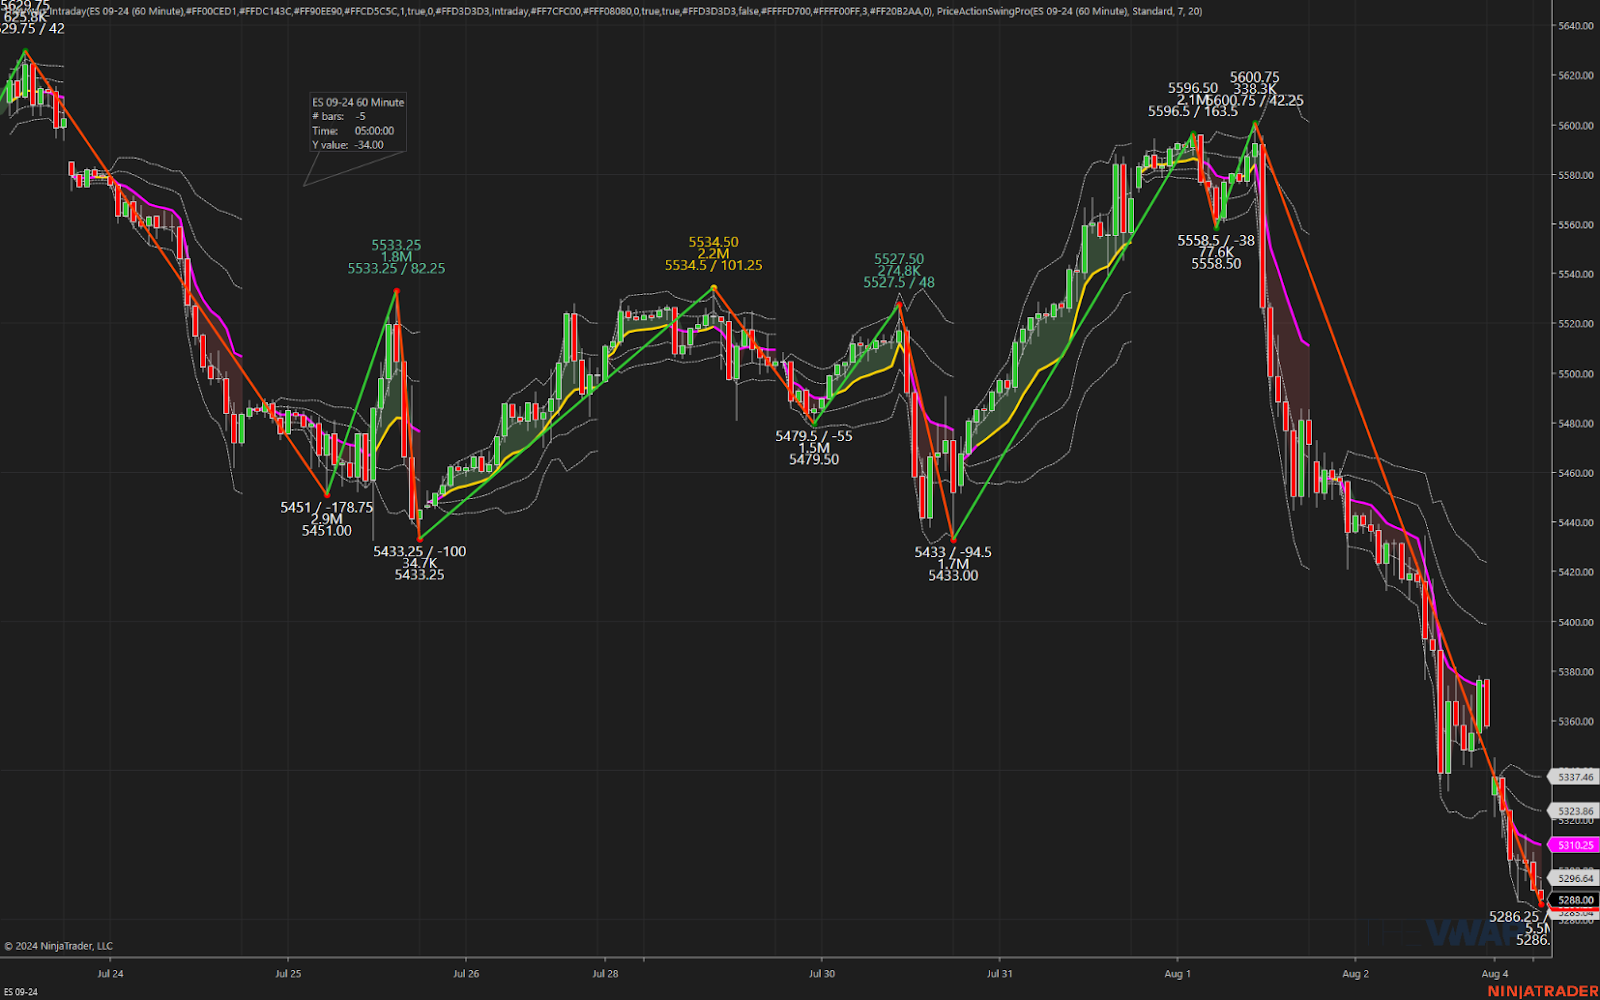
The markets performed poorly last week, with a particularly negative Friday and close. One pattern I have noticed is the recurring 50-point dead-cat bounces in the ES. Adding to the current weakness in the Magnificent 7 stocks and the broader tech rotation.
A story over the weekend revealed that Nvidia’s Blackwell GPU architecture, unveiled in March, has a flaw. This flaw will delay the launch of Nvidia’s latest AI chips by at least three months. Not surprisingly, NVDA is down about 10% this morning (with a key gap-fill at the $96 level). The delivery delay will also impact other Magnificent 7 stocks such as Meta, Google, and Microsoft, which collectively have ordered tens of billions of dollars’ worth of these chips.
Our Lean
It’s a quiet week on the economic front, with only 6 economic releases and one Fed speaker on tap, and a lot of big earnings out this week. The ES is falling 100+ points a day and until the NQ firms up, it’s a “sell every rip” kinda market.
It’s a quiet week on the economic front, with only 6 economic releases and one Fed speaker on tap, and a lot of big earnings out this week. The ES is falling 100+ points a day and until the NQ firms up, it’s a “sell every rip” kinda market.
A hard break below 5265 to 5300 gets real slippery — and we’re seeing that pan out now. If you are or want to be short, remember the ES made a high at 5721.25 on July 16th. To the current low, the ES is down about 600 points. From Thursday’s high, it’s down about 475 points.
The S&P always goes down fast then it goes up and while I think lower, I can’t rule on a dead-cat bounce. If the ES keeps going, 5100 (or lower) could be on the table.
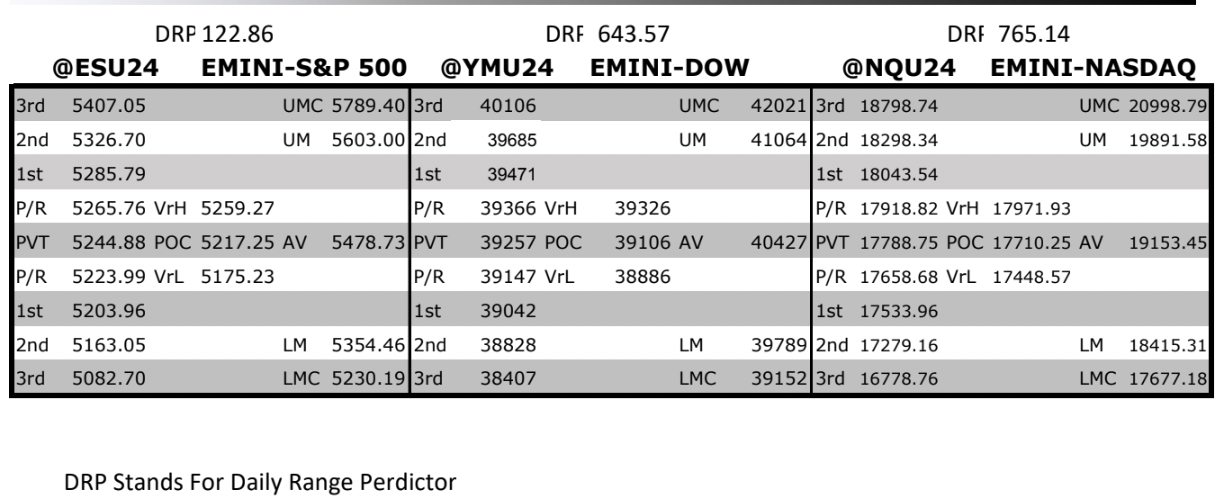
MrTopStep Levels:
From our good friend Jeff Hirsch at AlmanacTrader
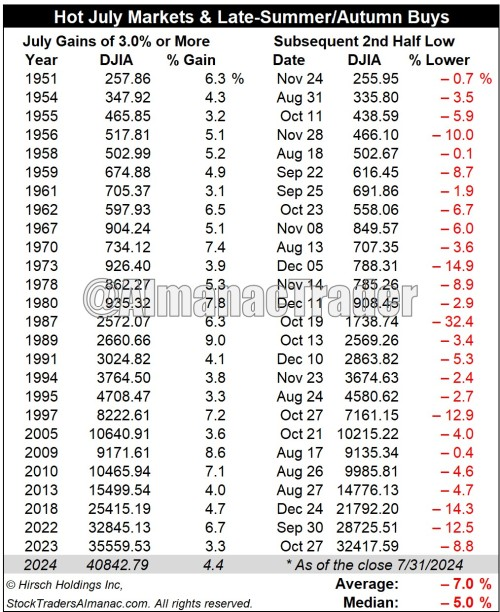
In the original research conducted by our illustrious founder and creator of the Stock Trader’s Almanac, the late Yale Hirsch, he defined a “Hot July” market as a gain of 3% or more for the Dow. This week’s carnage notwithstanding, sizable gains on the last trading day of July buoyed DJIA to a 4.4% gain for July 2024.
Every DJIA “Hot July” since 1950 was followed by a retreat that averaged 7.0% from July’s close to a subsequent low in the second half of the year. The worst decline was 32.4% in 1987 while the mildest DJIA decline was 0.1% in 1958. Historically, “Hot Julys” have led to better Autumn buys as many of the subsequent lows occurred in September and October.
NASDAQ closing down 0.75% for the month and S&P 500 lagging DJIA up just 1.1% underscores our near-term outlook for increased volatility from August to October ahead of this unprecedented presidential election campaign season on the backdrop of a market itching for a Fed rate cut and erratic economic, employment and inflation readings. The week’s action is a case-in-point.
As noted in our August Almanac and Outlook over the past two weeks and on our July 31 member’s webinar, notoriously week August is historically much better in election years. However, with the market running hot all year, arguably overbought and way ahead of itself, our cautious stance during the “Worst Four Months” of the year July-October seems the most prudent course of action. Our “Best Months” MACD Seasonal Sell signals on April 2 for DJIA and S&P and June 25 for NASAQ appear to be rather timely at this point.
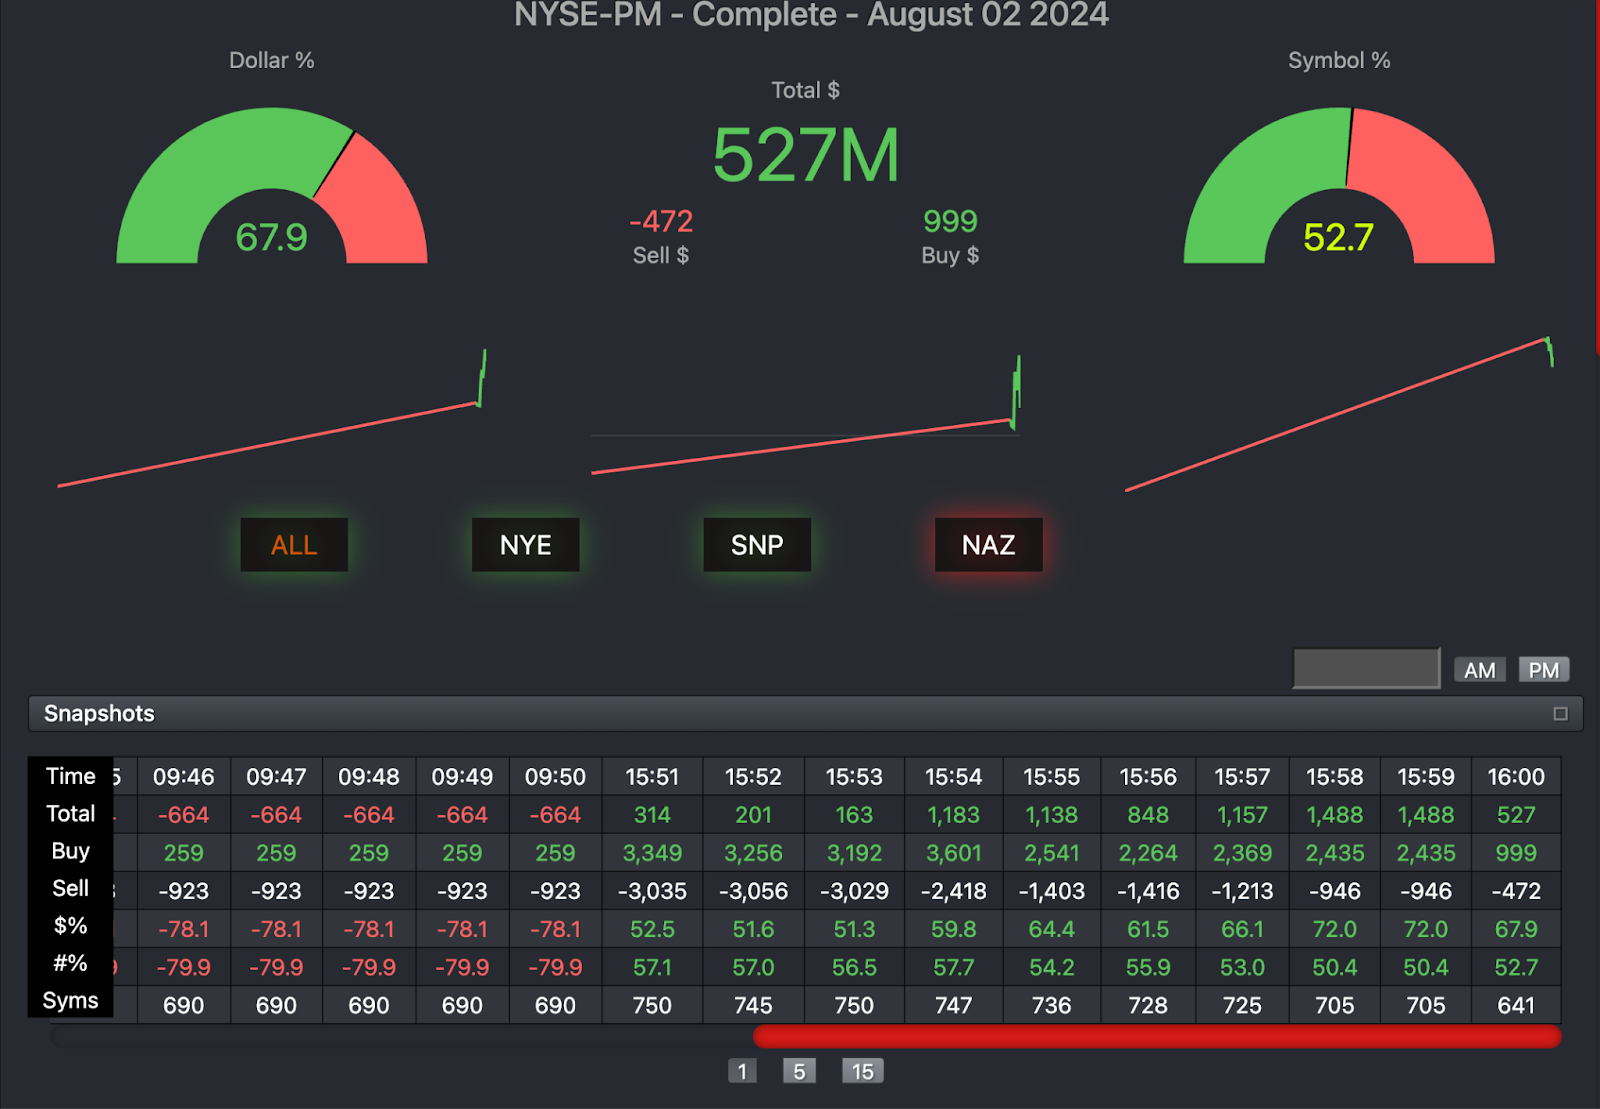
MiM and Daily Recap
The ES sold off on Globex and after the July jobs report showed job growth of 114,000 for the month — much less than expected — and with the unemployment rate rising to 4.3%, the futures dropped to 5376.50 at 8:38. The market then rallied to 5415.25 at 9:20 and opened Friday’s regular session at 5404.50. After the open, the ES initially increased to 5407.75, but then sold off to 5386.75 at 9:35. It rallied again to 5417.25 at 9:42, but then declined by 75.25 points to 5342.00 at 10:02, and dropped to a new low of 5332.75.
Following this drop, the ES rallied to 5359.25 at 10:32, fell to a new low of 5336.25 at 10:43, and then climbed to 5361.50, only to drop to a new low of 5332.75, rise to 5347.25, and then fall to another new low of 5331.75 at 11:24. It subsequently rallied to 5374.75, sold off to 5356.25 at 12:15, and then rallied to 5381.75 at 12:42 before selling off to 5351.00. The ES then rallied to 5366.50 at 1:16, fell to 5352.25 at 3:10, and after this low, rallied to 5375.75 at 3:34. It then sold off to 5358.50 at 3:39, dropped further to 5351.00 at 3:46, and traded at 5361.50 as the 3:50 cash imbalance showed $300 million to buy. The ES then sold off to 5351.00 at 3:52, rallied to 5378.25 at 3:59, and traded at 5377.00 at the 4:00 cash close.
After 4:00, the ES sold off to 5357.00 and settled at 5358.00, down 122 points or -2.23%. The NQ settled at 18,513.75, down 501 points or -2.68%. The YM settled at 39,755.00, down 759 points or -1.78%, and the RTY settled at 2,111.90, down 86.20 points or -3.92% on the day.
-
Crude oil (CLU4) settled at 74.14, down 2.17 pts on volume of 432,000
-
Gold (GCZ4) settled at 2,486.10. +5.3 ot +0.21% on volume of 296,209
-
10 Yr. note (ZNU4) settled at 114,045, up 1’1130 points or +.125% on volume of 4.152 million
-
30 Yr bond (ZBU4) settled at 125.02, up 2.17 points or +2.17% on volume of 813,000
-
Bitcoin (BTCQ4) settled 62,945, down 845 points or down 1.32% on volume of 10,926
Clearly, economic and earnings data has accelerated the market decline. The yield on the 10-year note slid below 4% for the first time since February, and the 2-year note yield, a predictor of short-term rates for the Fed, settled at 4.163%. This was down more than one-quarter percentage point over the past five sessions and marked the largest one-day yield decline since December 13 for both 2-year and 10-year notes. This caused a broad selloff in stocks and risky investments, resulting in the ES experiencing its largest intraday swing since November 2022.
Let’s face it, there are two significant unwinds happening: the rotation out of tech stocks and the shift from buying bonds to selling stocks. Job growth slowed sharply in July, and the unemployment rate rose to its highest level since 2021.
There are two other points to consider: First, the Fed is struggling to keep up with the economic situation, with some questioning whether a 0.50% rate cut is needed. I am not an economist or Wall Street analyst, but I have to ask: Have you actually seen prices go lower? Oh, I almost forgot — the price of eggs has fallen, but when I visited the grocery store recently, I asked the butcher about meat prices. He confirmed that prices have risen almost every month for the last two years. Gas is still high, lending is tight, foreclosures are increasing, commercial real estate is in trouble, and the US presidential election, along with other geopolitical events, adds to the uncertainty. In this context, a September rate cut seems like a minor concern compared to the broader issues at play.
Technical Edge
-
NYSE Breadth: 16% Upside Volume
-
Nasdaq Breadth: 22% Upside Volume
-
Advance/Decline: 24% Advance
-
VIX: ~62
-
Up ~170%
-
Guest Post — SpotGamma
SpotGamma is one the the shining stars of the options markets. If you have never heard of them or already know of them and have never signed up for their options flow products or the SG Academy, I fully suggest you check them out and add them to your trader’s toolbox.
Here’s a snippet from them:
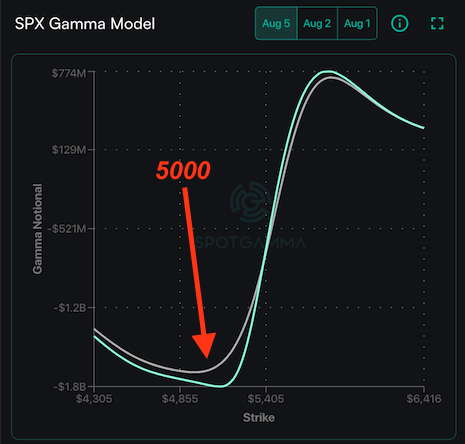
If you look at our standard gamma model, below, you will note that the gamma curves trough and turn higher under 5,000. This suggests an area wherein market makers (MM) downside hedging pressure should subside. Those of you that also track the SpotGamma Gamma Index also know that volatility tends to contract at the extreme levels of negative gamma (vs expand during “normal” negative gamma).
MM’s carry risk like any other trading entity. Each night they have Risk Officers looking at their books, making sure the MM’s aren’t holding exposures that could bring down the MM’s firm, or the firms clearing partners.
In order to prevent catastrophic PNL failures during tumultuous moves like todays, MM’s have to essentially be net long of puts. Most of these puts are way out of the money – tiny insurance policies that 999/1000 expire worthless. But, during times like this, these puts start to accrue a lot of value. The value comes from the underlying market dropping (providing delta gains), but also because volatility is ripping (vega gains).
These gains, we believe, allow market makers to start providing better liquidity to the market, which in turns helps to stabilize underling price. Our current models suggest this comes in near the 5,000 SPX price level, which is where we would start looking to buying the dip. Until then, we have nothing in our models that suggests support, particularly given the global-macro picture.
Economic Calendar
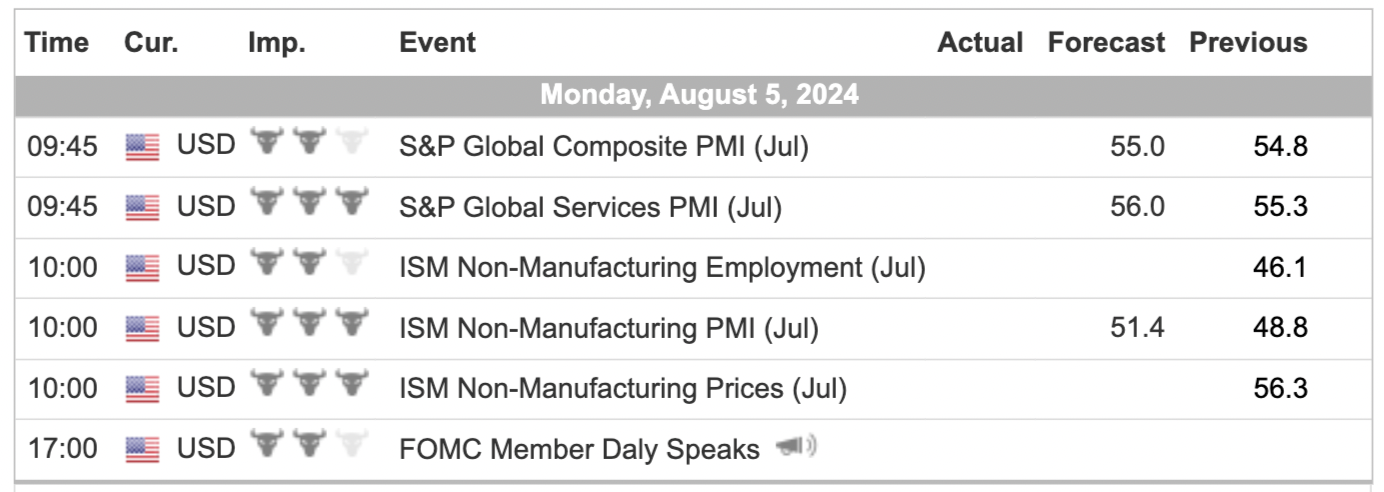
For a more complete Economic Calendar see: https://mrtopstep.com/economic-calendar/
Comments are closed