This post goes out as an email to our subscribers every day and is posted for free here around 2 PM ET. To get your real-time copy, sign up for the free or premium version here: Opening Print Subscribe.
Volatility Rules the Tape — Don’t Trust the First Move
Follow @MrTopStep on Twitter and please share if you find our work valuable!
Our View
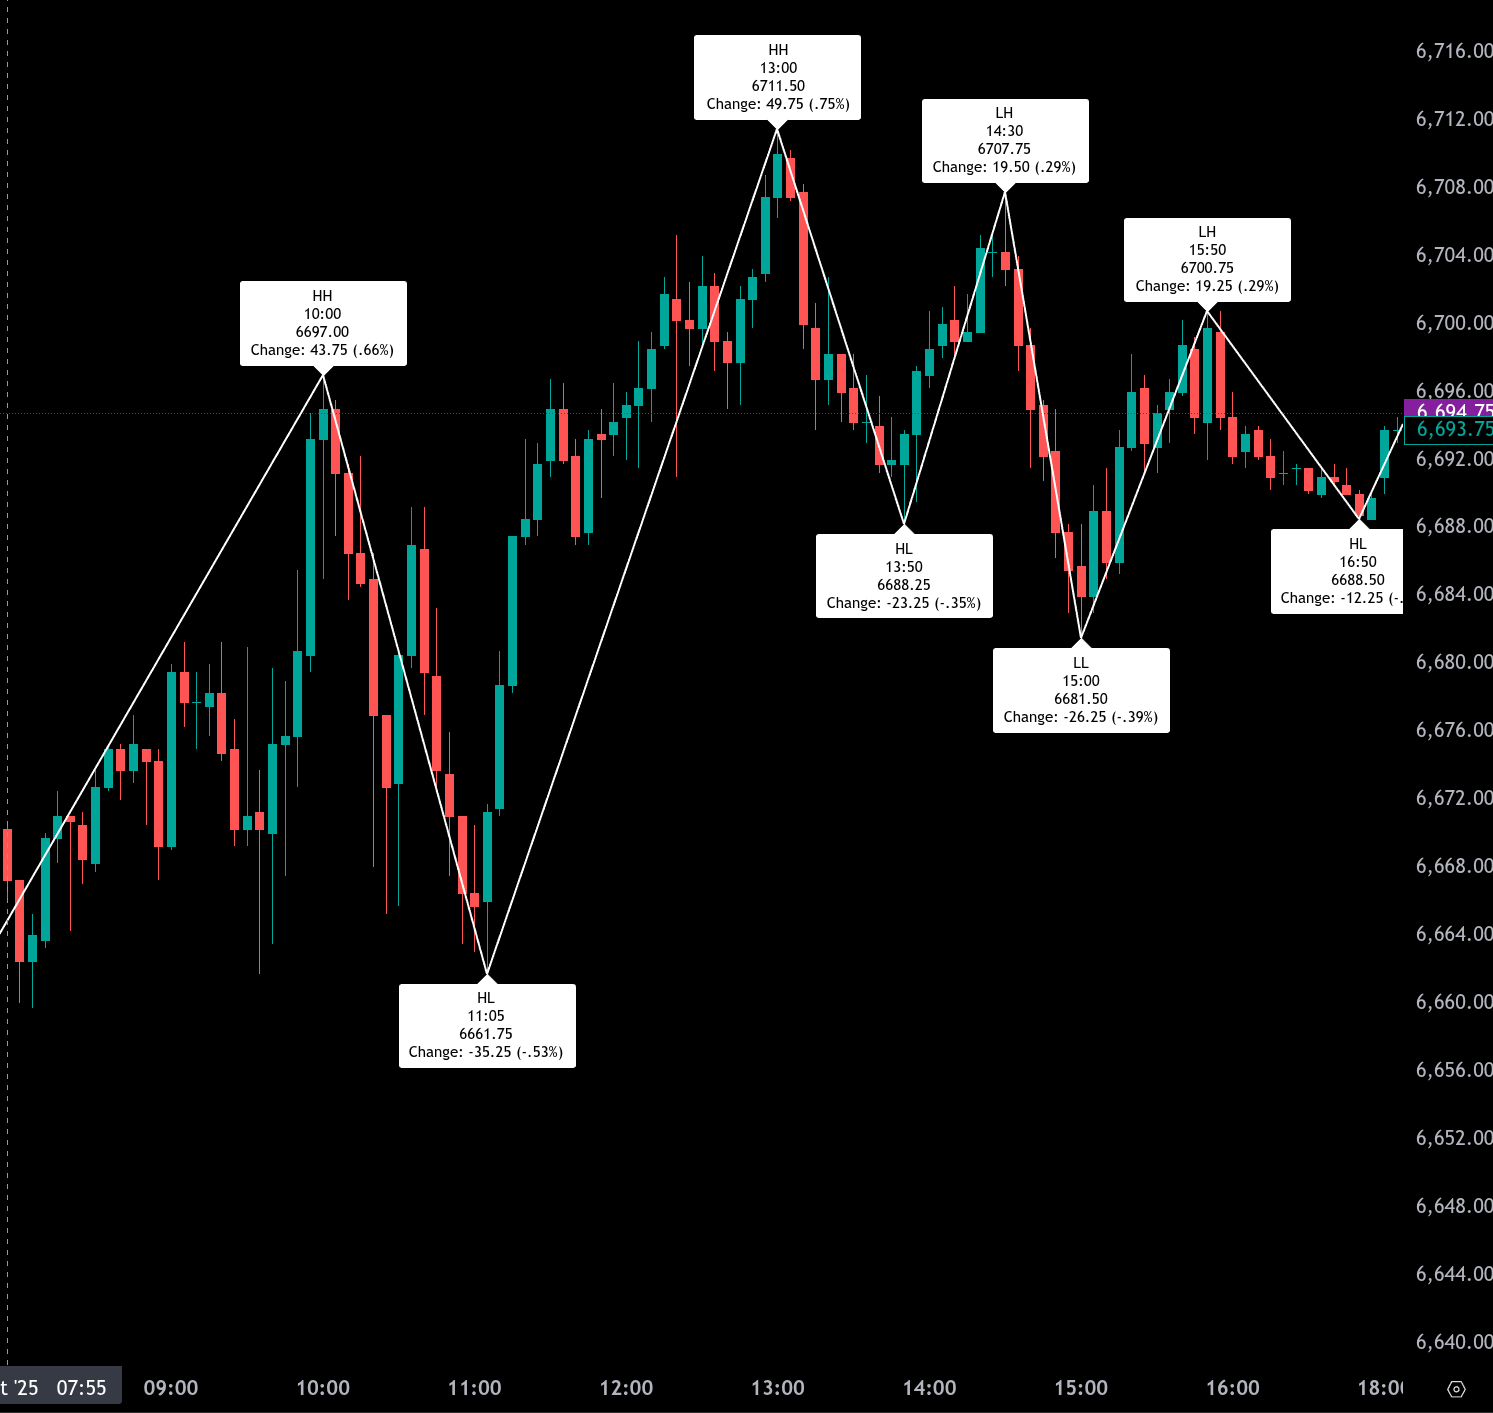
Well, well… the ES and NQ rose sharply on Monday as they recovered some of their losses from last Friday’s plunge. I could do a big play-by-play, but the futures index markets went from the end of the world to gapping +1% higher and rallying all the way up to 6711.50 just after 2:00 p.m.
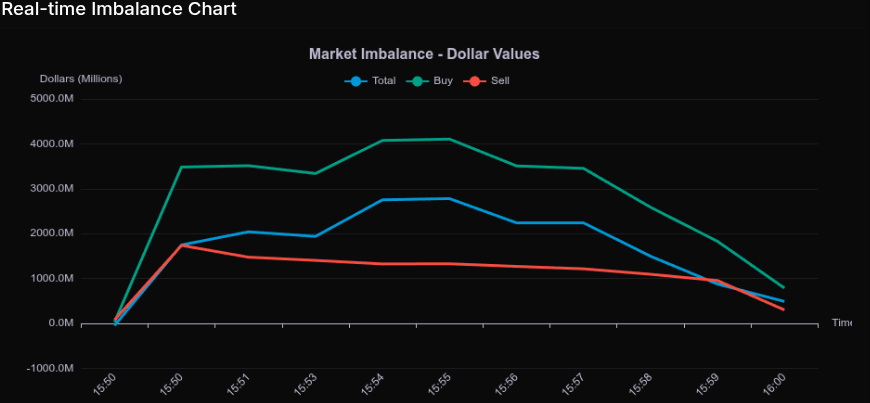
After the high, the ES pulled back to the 6688 level, rallied up to a higher low at 6707.50, pulled back to 6681.50 at 3:50, rallied up to 6700.75 at 3:54 after the imbalance showed $1.8 billion to buy, and then it started to slide. The ES traded 6694.75 on the 5:00 cash close, up 99.5 points or +1.51%.
The NQ settled at 24,922.25, up 525.25 points or +2.15%, and the YM (Dow future) settled at 46,298.00, up 592 points or 1.30% on the day.
In the end, it’s hard not to think the Trump Friday headlines were a setup. I read something that said retail was either long a call, long a stock, or a futures contract—and they all lost. The longs got whacked, and the shorts got whacked too.
But after all the Trump rhetoric, the chip-makers and AI infrastructure stocks rallied after OpenAI signed a multi-year agreement with Broadcom to collaborate on custom chips and networking equipment, which could add 10 gigawatts worth of AI data center capacity.
In terms of the ES and NQ’s overall tone, they were firm all day. In terms of the ES’s overall trade, Friday’s volume was 2.57 million and Monday’s volume was lower at 1.721 million contracts traded.
I’m not sure Trump’s Art of the Deal is working, and neither is China. For the last 10 months, Trump has pushed every nation that does business with the US up, down, and all around with his threats and retreats. Anytime Trump acts up, there is a sharp increase in volatility. I don’t know how this is going to end up, but it doesn’t look very promising—and Mike Wilson from Morgan Stanley agrees.
Wilson, Morgan Stanley’s Chief U.S. Equity Strategist, warned on Monday that escalating U.S.-China trade tensions could drive a 10–15% S&P 500 correction (to 5,800–6,027 from 6,553) if unresolved by November 1. Friday’s selloff—triggered by China’s tightened rare earth export controls and Trump’s 100% tariff threat—erased $1.50T from the S&P 500 (3% drop) and $1.46T from the Nasdaq (3.6% drop). Wilson cites stretched valuations (S&P forward P/E ~22x), overcrowded bullish positioning, and seasonal weakness as setting up an “overdue” correction—amplified by weak global dollar liquidity and potential earnings downgrades.
Sector Risks: Semiconductors, quantum computing, and consumer discretionary face the highest exposure to supply chain disruptions and tariff costs. Wilson recommends overweighting defensive sectors like healthcare and “quality” factors.
Bull Case: He maintains the bull market, sparked by April 2025’s earnings recovery, is “early-cycle,” not late, with low recession risk. De-escalation (e.g., China easing curbs, U.S. moderating tariffs) could resume the rally, as seen Monday when markets rebounded (S&P +1.5% to ~6,680, Nasdaq +2.7% to ~22,800) after Trump softened his stance. Investors should trim cyclicals, add defensives, and monitor November 1 deadlines and technical levels (e.g., 50-day MA).
I’m not sure Mike Wilson knew that the S&P would be up 1.5% after he posted his report, but I don’t think that really matters. The point is: if the US and China can’t strike a deal, I think there could be a large drop.
Trump announced the 90-day pause on reciprocal tariffs on April 9th. The low was 4948.50 and rallied up to 5604.75, up 12.88%—the largest intraday point swing since 1967 for the S&P 500 index. That type of move would be in line with what Mike Wilson is looking for, basically a complete retracement of the April lows.
To summarize, we all know how unpredictable Trump is. Sometimes it works and sometimes it doesn’t—but mistakes of this scale could set off a domino effect. Only time will tell.
Our View
If there’s one main concern for me right now, it’s that our elected officials pass a budget deal. But based on the 20% to 25% odds, it seems unlikely. Today is the 14th day of the shutdown, and the prior shutdown during the Obama administration went 16 days—October 1–17, 2013, due to the Affordable Care Act funding.
During that 16-day U.S. government shutdown, the S&P 500 gained approximately 3.1% (from 1,681.55 to ~1,733.15) over 13 trading days. Despite early volatility and a dip around October 8–9 due to debt ceiling concerns, the index rallied to an all-time high by October 17 as Congress passed a deal to reopen the government and raise the debt ceiling.
I think the S&P will rally when a budget deal is passed, but what I’m worried about is the “data blackout.” At least 10 major reports have been delayed or canceled since October 1. That includes jobs, inflation, and trade metrics. It only exacerbates uncertainty for the Fed’s October 28–29 meeting, and just four days later is the November 1 tariff deadline.
I think this will be an extremely volatile period and a date you should mark on your calendar.
US-China Trade War: Maritime Escalation
-
Overview: US and China launch reciprocal port fees on vessels, targeting shipping (80% of global trade); stems from Biden probe on China’s unfair shipbuilding dominance (50%+ capacity) via subsidies/IP theft.
-
US Fees: $50/net ton on Chinese-linked ships (rising $30/yr for 3 yrs, up to $10M+/yr for large carriers); cargo imports only, first port/voyage, some exemptions.
-
China Retaliation: RMB 400 (~$56)/net ton on US-linked vessels (exempts China-built/empty for repairs, first port or 5/yr); sanctions Hanwha Ocean’s 5 US units (bans/deals freeze, shares -6%); probes US tariffs, expands rare earth controls.
-
Impacts: COSCO hit with $1.5–2.1B US fees in 2026 (half of $3.2B total); Zim/Matson at risk; 11% containers/13% tankers affected, risking reroutes (e.g., India), 27%+ transpacific drops, rate hikes, inflation; markets dip on tariff fears.
-
Reactions/Outlook: China: “Rectify errors, dialogue open or fight to end.” US: Accuses instability. Analysts: Short-term hikes, long-term fragmentation; hope in Trump-Xi talks by Nov 10; entangles allies like SK.
Our Lean
I was long late in the day and got out at a scratch. The ES just traded up to 6718.50 on Globex. That’s 178.25 points off the 6540.25 low from Friday.
Our lean: While I don’t think the rally is over, MrTopStep has a trading rule that says the ES tends to go sideways to down after a big up day. If the ES gaps up 20 to 30 points, I am selling the open or the early rallies—and vice versa on a gap-down open. If the ES gaps up and starts to break, it could set the early tone. Be patient and wait for a low to get long from.
As for support levels:
6695.00, 6687–6685, 6680, 6675, 6667, 6659, (6653, 6649, 6645 – key support), 6633, 6620, 6608, 6595, 6589.
On the upside:
6720, 6728, 6740, 6753, 6774, 6780.
USE stops, don’t let losses run.
HandelStats.com:
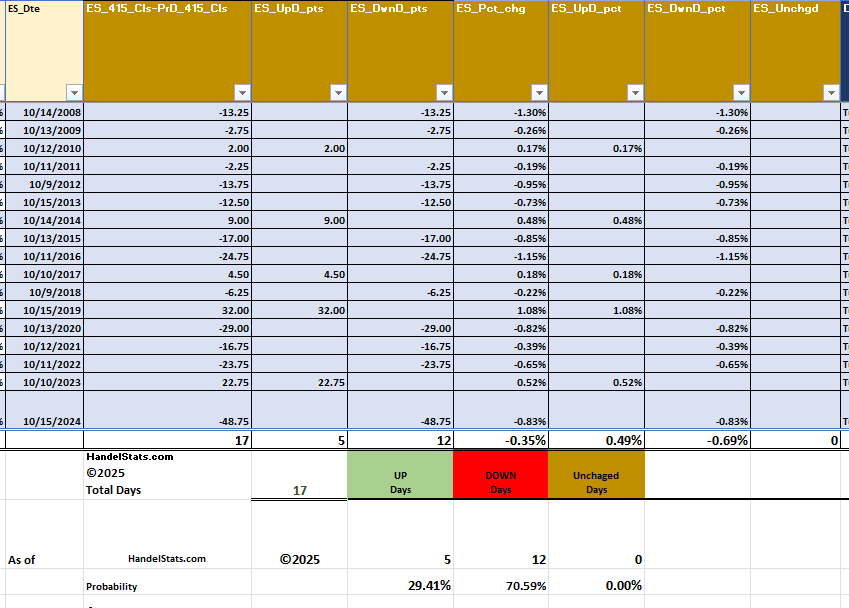
Event Day Study — Day After Columbus Day
HandelStats.com | Quantitative Market Insights
Since 2008, the day after Columbus Day has shown a clear historical bias to the downside.
Out of 17 occurrences, the E-mini S&P (ES) has been up only 5 times and down 12 times — a 70.6% probability of a decline.
Average performance:
-
Up Days: +0.49%
-
Down Days: −0.69%
-
Net Average Change: −0.35%
This pattern suggests a consistent post-holiday weakness in equity futures, with limited follow-through on the upside.
As always, probabilities are not predictions — but history has leaned bearish for this session.
— HandelStats.com
Data-driven trading insights built on decades of market statistics.
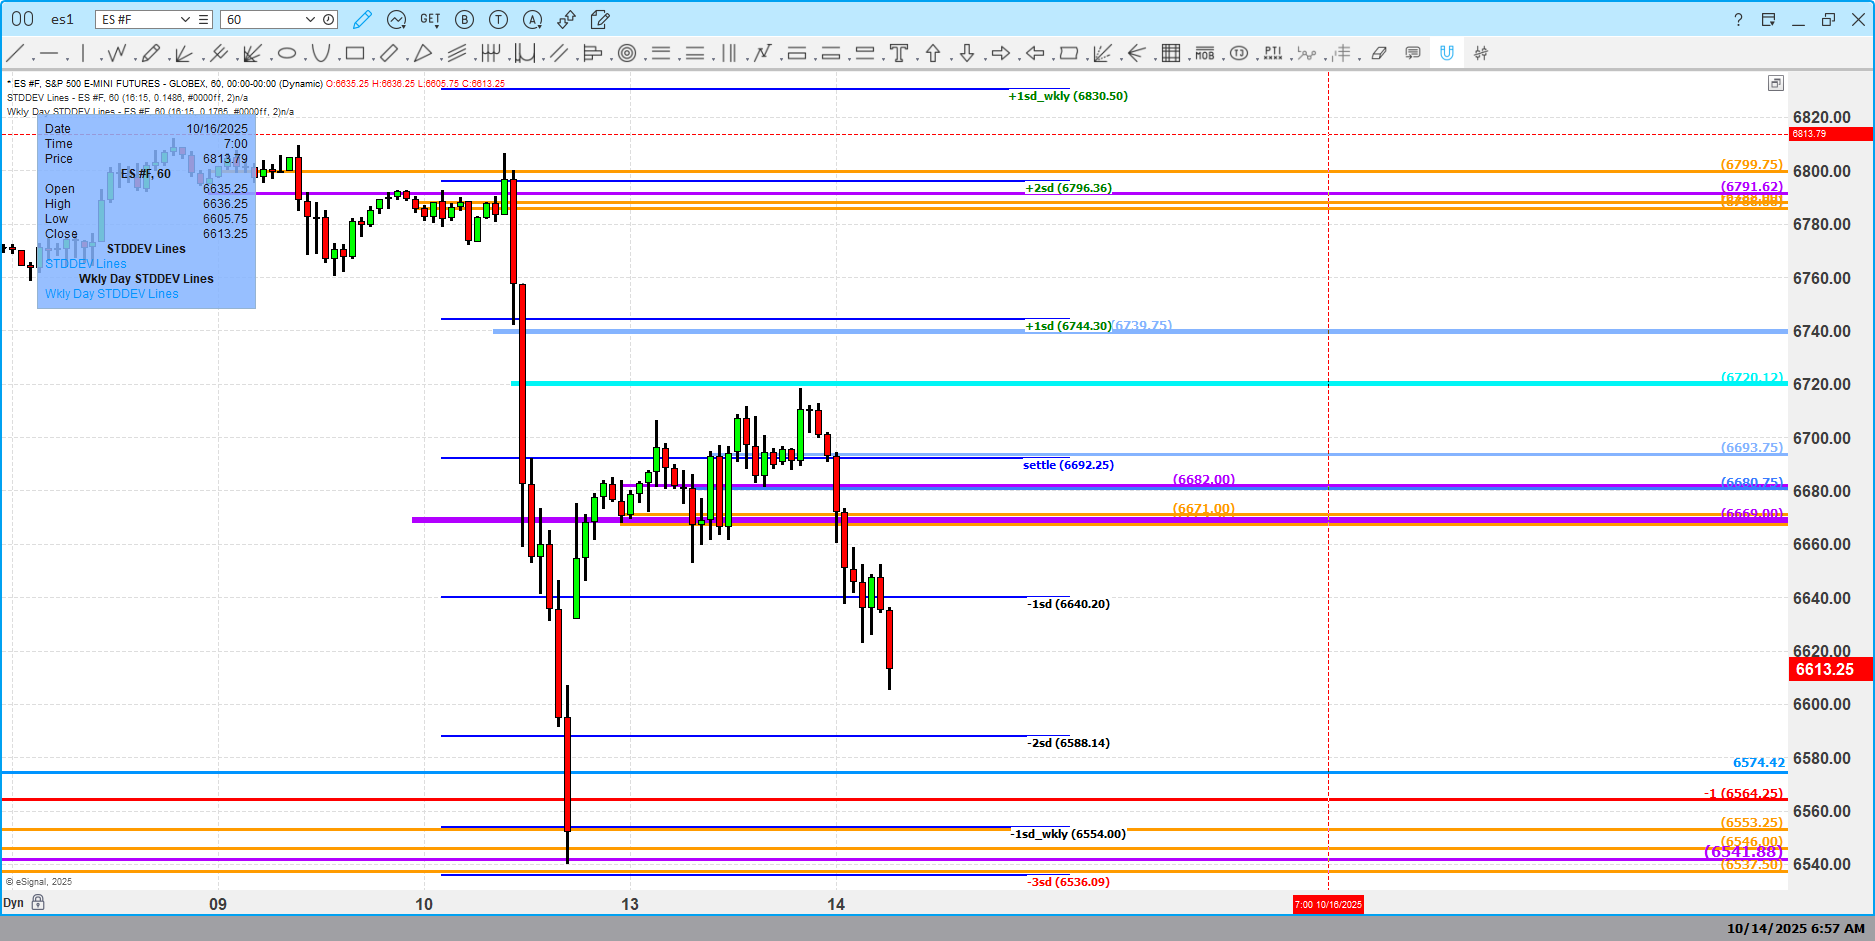
E-mini S&P (ES) — Morning Technical Outlook
October 14, 2025
HandelStats.com
This morning, the ES is trading below yesterday’s settlement, signaling early weakness. A daily trade and close below 6669 would confirm continued downside pressure and likely lead to a retest of Friday’s lows or lower.
Conversely, regaining 6669 intraday would indicate renewed market strength and open the path for a push toward recent highs.
This chart combines our 1440 Fractal Charting Method with Daily and Weekly Standard Deviation Levels — a structure designed to visualize price position relative to key volatility bands. Note how the standard deviation (SD) and SD Weekly levels align with recent turning points in market structure.
More detail on the SD Weekly Framework coming next time.
— HandelStats Quantitative Insights
HandelStats.com
Guest Post: Tom Incorvia – Blue Tree Strategies
About Blue Tree Strategies” “Market Profile Trading Strategies | NYC”
Our trading strategy is simple, identify price in relationship to perceived value. History has shown that there is one investment thesis that is at the core of all price movements. That is supply and demand. Blue Tree Strategies uses volume analytics to analyze and identify the markets, balance area. Being able to correctly identify price in relation to balance allows a more accurate understanding of the markets movements. This understanding allows us to identify institutional sponsored moves verses retail sponsored moves.
SPY:
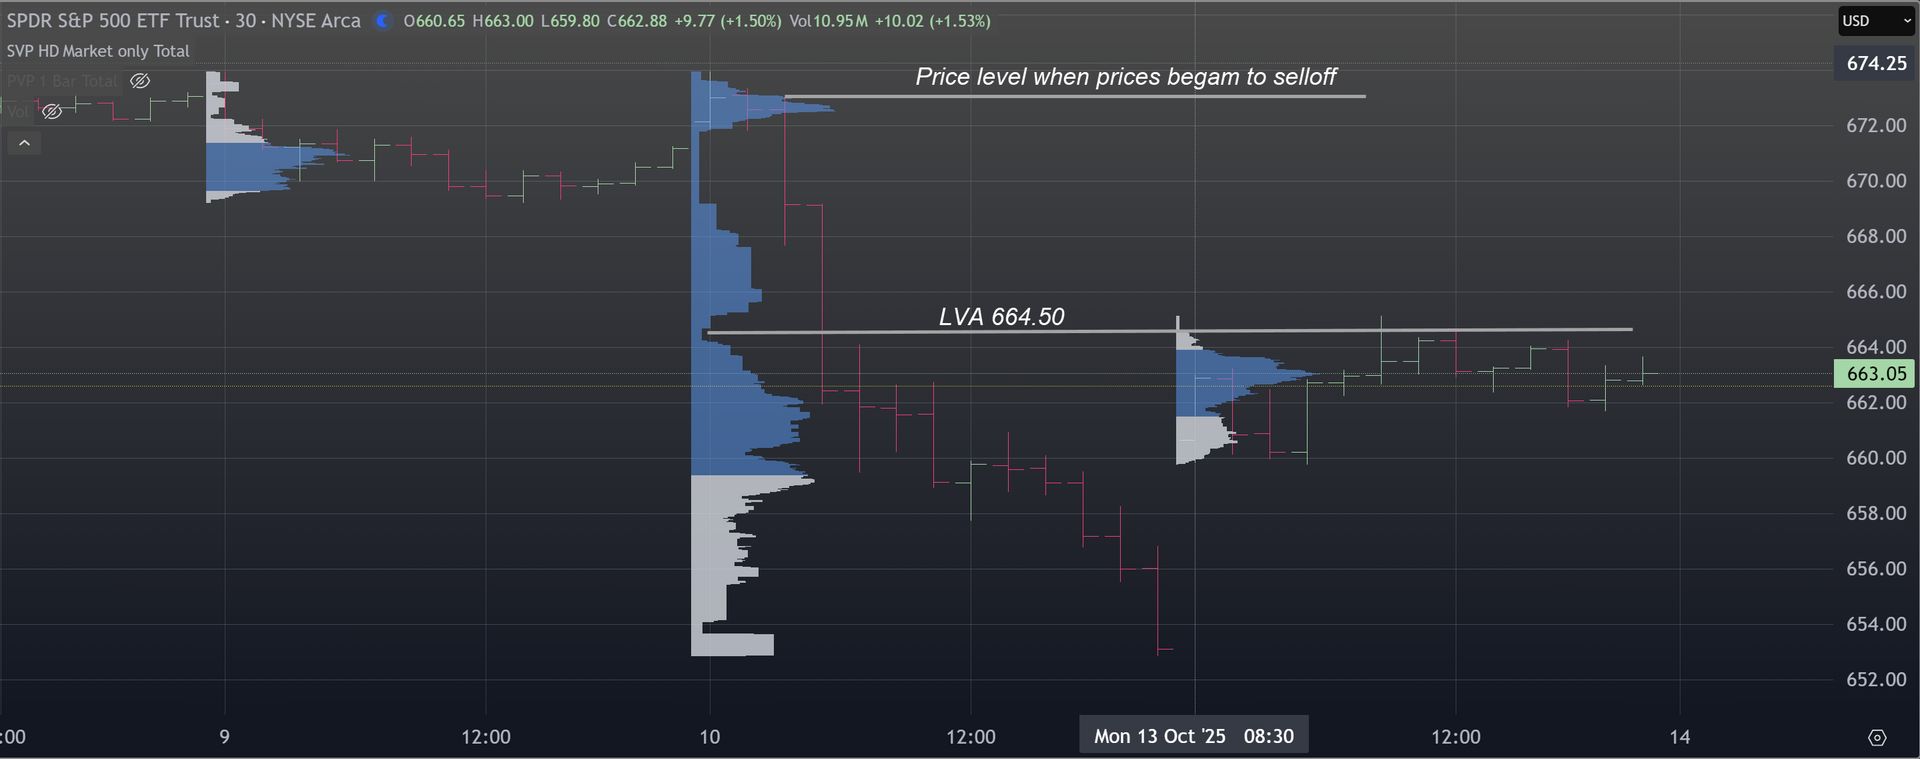
SPY (30 min)
Price action with the SPY can be interpreted as a balance day. A strong bounce after Friday’s selloff. Friday had multiple distributions the LVA (664.50 area) seemed to hold today’s action. That level will act as a key to being either bullish or bearish going forward. If prices cannot trade above expect prices to possible test the lows from Friday.
XRT:
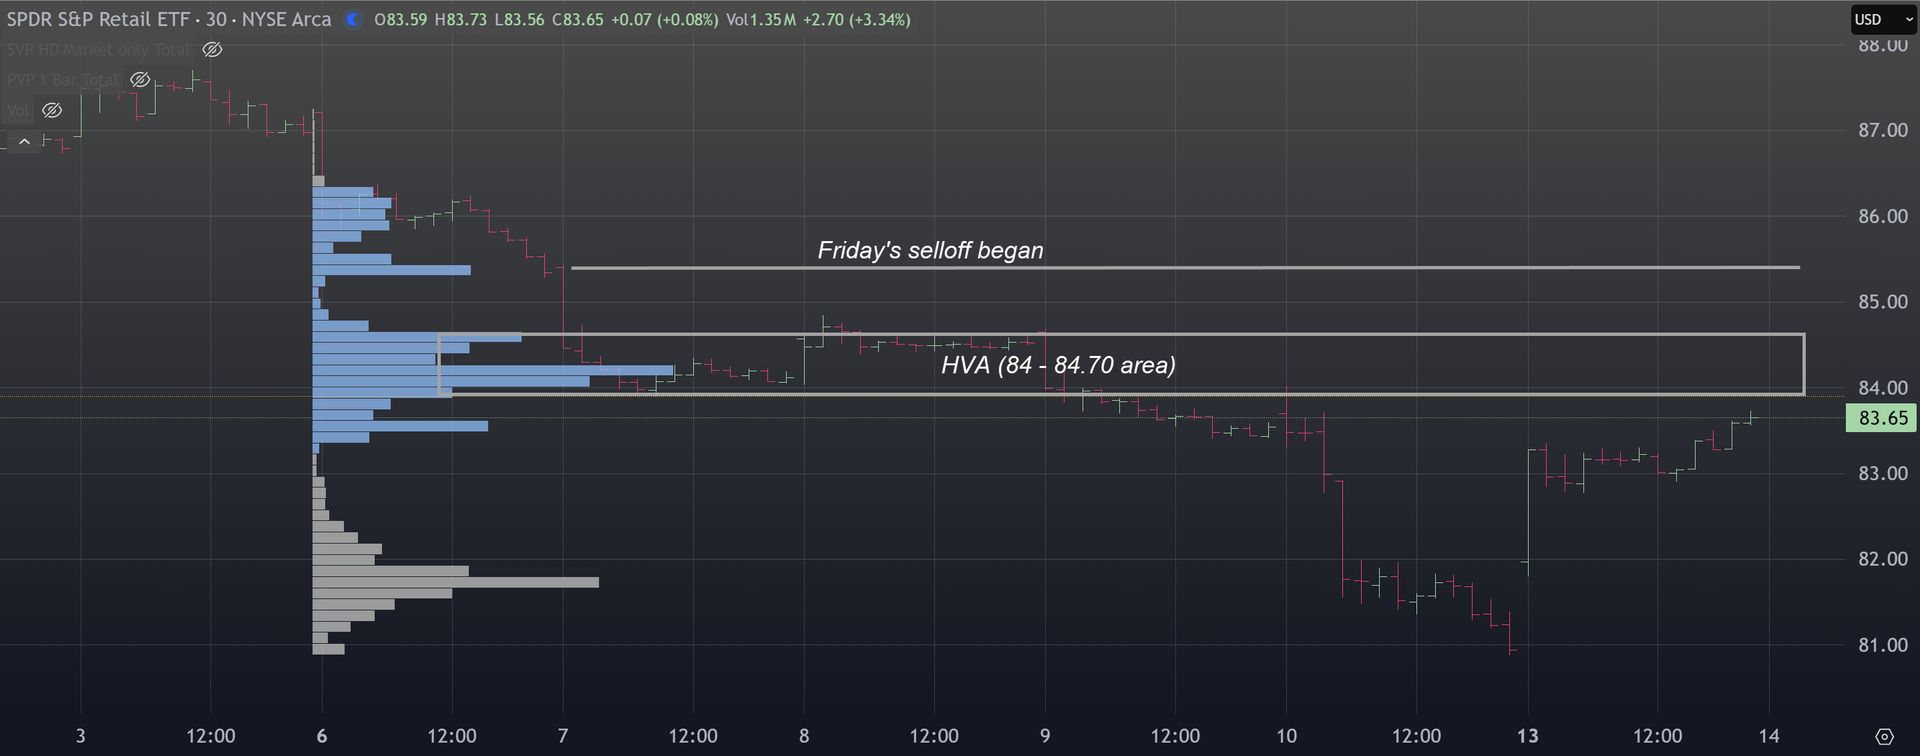
XRT (30 min)
Omitting the gold and gold miners the only sector, surprisingly, that seemed to relatively outperform was the Retail Sector (XRT) It basically closed at the level prior to Friday’s selloff. Prices being accepted above the 84.70 area should start bullish swing move.
Tom Incorvia began his career in financial services in 1987 and has amassed over three decades of experience navigating the complexities of the markets. His career spans both the buy-side and sell-side of the trading desks, having served as Vice President of Equity Trading and later as General Partner of a hedge fund. This dual perspective has provided him with a unique and well-rounded understanding of market behavior.
You can Purchase Tom’s Course on Volume Profile here.
MiM and Daily Recap
ES Futures Recap – Monday
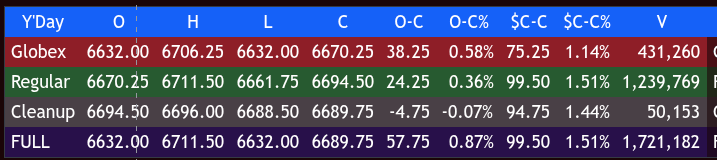
The S&P 500 futures (ES) began the week with a firm tone, extending Friday’s rebound during the overnight Globex trade. The session opened at 6632.00 and steadily climbed, peaking at 6706.25 near 03:20 ET before modestly easing into the morning. Buyers held firm above the prior close, and the Globex session finished at 6670.25, up 38.25 points (+0.58%) from the open and 75.25 points (+1.14%) from the previous day’s cash close.
The regular session began at 6670.25 and picked up the bullish momentum. Early strength carried the ES to 6697.00 by 10:00 AM, but a round of profit-taking pulled prices down to 6661.75 at 11:05, marking the morning low. That dip proved short-lived as buyers reemerged mid-morning, driving a powerful rally through noon that reached 6711.50 by 1:00 PM — the day’s high and a 49.75-point move (+0.75%) off the morning low. From there, momentum faded slightly, leading to a modest retracement down to 6688.25 by 1:50 PM. Attempts to retest the highs stalled at 6707.75 around 2:30 PM, forming a lower high before sellers pressed again.
A mild afternoon fade took the contract to a new afternoon low of 6681.50 at 3:00 PM, a 30-point drop (-0.45%) from the earlier peak. A final bounce lifted ES to 6688.50 at 3:50 PM as the 3:50 cash imbalance showed $2.0B to buy, then prices settled at 6694.50 on the 4:00 PM close. The regular session finished up 24.25 points (+0.36%) from the open and 99.50 points (+1.51%) from Friday’s settlement. Cleanup trading extended slightly higher early on, reaching 6696.00 before easing back to 6689.75, closing the post-market down 4.75 points (-0.07%) but maintaining a +1.44% gain for the full day.
Overall, the combined full-session range stretched from 6632.00 to 6711.50, with a total gain of 99.50 points (+1.51%) from cash close to cash close and volume near 1.72 million contracts.
The market tone was distinctly bullish, with strong follow-through buying after Friday’s steep selloff. Both sessions held above prior resistance levels, and buyers defended dips throughout the day. Volume remained robust, suggesting broad participation in the recovery rally.
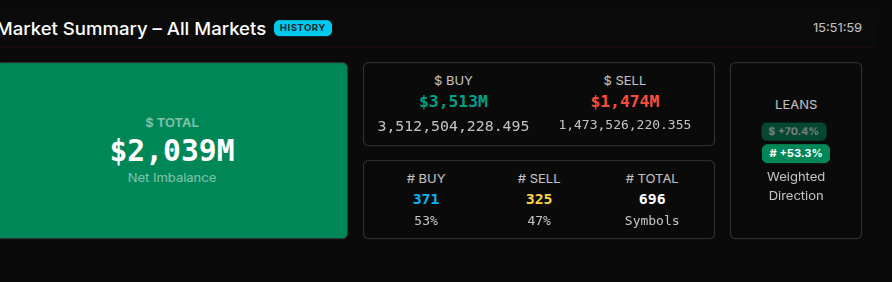
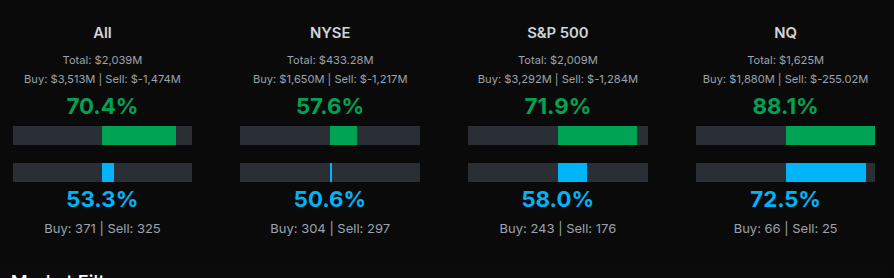
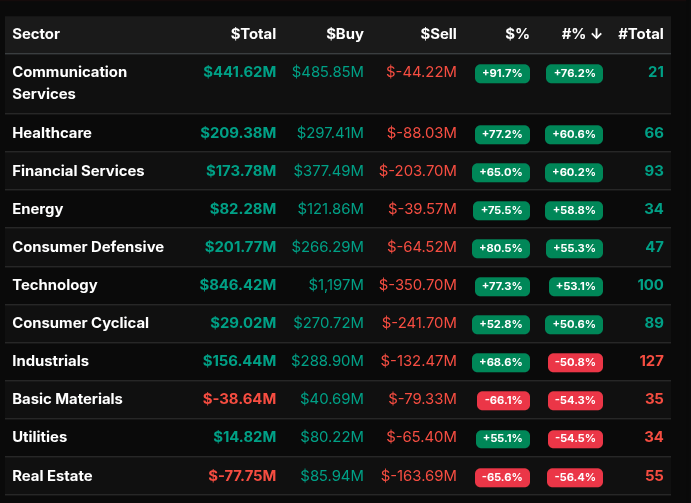
The Market-on-Close (MOC) and MiM data confirmed the positive sentiment: total net imbalance stood at $2.039B to buy, with 70.4% of the dollar flow and 53.3% of the symbols favoring the buy side. The S&P 500 specifically registered 71.9% buy-side imbalance, while the Nasdaq showed an even stronger 88.1% tilt. Sector breakdowns were overwhelmingly positive, led by Technology (+77%), Communication Services (+91.7%), and Healthcare (+77%). Only Basic Materials and Real Estate showed modest net sell imbalances.
The strong MOC buying into the bell reinforced the day’s bullish tone, helping ES finish near the upper end of its range. The session closed with a constructive bias, setting a positive tone heading into Tuesday’s trade, with momentum favoring continued dip-buying unless early weakness reemerges.
Technical Edge
Fair Values for October 14, 2025:
-
SP: 41.7
-
NQ: 178.66
-
Dow: 220.72
Daily Market Recap 📊
For Monday, October 13, 2025
-
NYSE Breadth: 81.6% Upside Volume
-
Nasdaq Breadth: 70.6% Upside Volume
-
Total Breadth: 71.8% Upside Volume
-
NYSE Advance/Decline: 78.9% Advance
-
Nasdaq Advance/Decline: 72.1% Advance
-
Total Advance/Decline: 74.6% Advance
-
NYSE New Highs/New Lows: 70 / 60
-
Nasdaq New Highs/New Lows: 174 / 140
-
NYSE TRIN: 0.71
-
Nasdaq TRIN: 1.06
Weekly Breadth Data 📈
For Week Ending Friday, October 10, 2025
-
NYSE Breadth: 37.4% Upside Volume
-
Nasdaq Breadth: 52.1% Upside Volume
-
Total Breadth: 47.1% Upside Volume
-
NYSE Advance/Decline: 19.3% Advance
-
Nasdaq Advance/Decline: 30.4% Advance
-
Total Advance/Decline: 26.3% Advance
-
NYSE New Highs/New Lows: 313 / 149
-
Nasdaq New Highs/New Lows: 814 / 274
-
NYSE TRIN: 0.39
-
Nasdaq TRIN: 0.39
ES & NQ Levels (Premium only)

ES – Z Levels
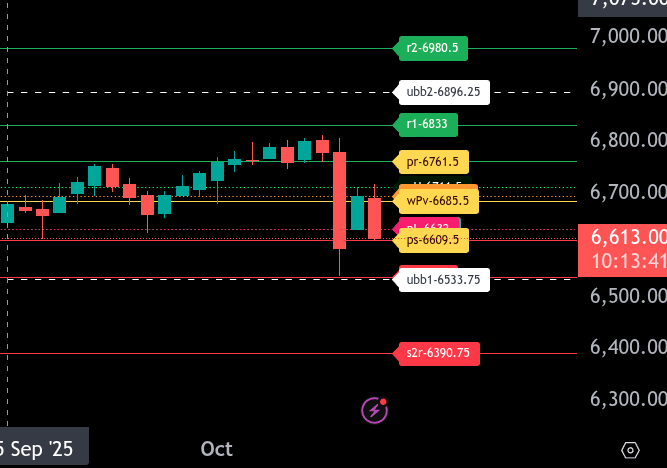
The bull/bear line for the ES is at 6685.50. This is the key pivot level that defines the tone for today’s trade. Above 6685.50, buyers may try to build momentum and reclaim the upper balance area. Below it, the tone remains defensive and sellers maintain control.
Currently, ES is trading around 6613.00, well below the bull/bear line, signaling continued weakness. The intraday bias remains bearish unless price can reclaim and hold above 6685.50.
The upper range target is 6761.50. A move back above 6685.50 could open the door toward 6694.75 and 6711.50, with 6761.50 as the upside objective. Sustained trade above that zone could test 6833.00, the next resistance level.
On the downside, the lower range target is 6609.00. Below that, the next support sits at 6538.00 and then 6533.75 as the deeper downside extension.
Overall, the trend remains bearish while below 6685.50. Bulls need a recovery through that level to stabilize the tape. A break below 6609.50 would likely extend the move toward 6538.00.
NQ – Z – Levels
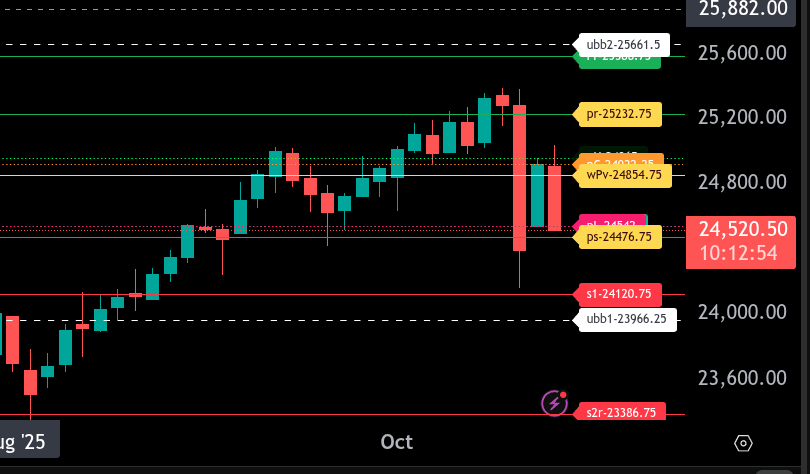
The bull/bear line for the NQ is at 24,854.75. This is the key pivot (wPv) level that defines sentiment for today’s session. Trading below this level favors continued weakness, while reclaiming and holding above it would shift momentum back to the upside.
Currently, NQ is trading around 24,523.25, well below the bull/bear line, confirming a bearish tone in the early Globex session. If the sellers remain in control below 24,854.75, the next downside targets are 24,476.75 (lower range target) and 24,120.75. A breakdown below 24,120.75 could open the door to a retest of 23,966.25.
On the upside, initial resistance sits at 24,922.25 and 24,965. A move above 24,965 would target 25,232.75 (upper range target) and then 25,588.75 if buyers can sustain momentum. A push through 25,588.75 could extend to the 25,661.50 region.
In summary, the trend bias remains bearish while NQ holds below 24,854.75. Short-term rallies into resistance zones may offer selling opportunities until that pivot is reclaimed. A sustained move back above 24,854.75 would neutralize the downside and potentially trigger a broader recovery leg toward 25,232.75 and higher.
Calendars
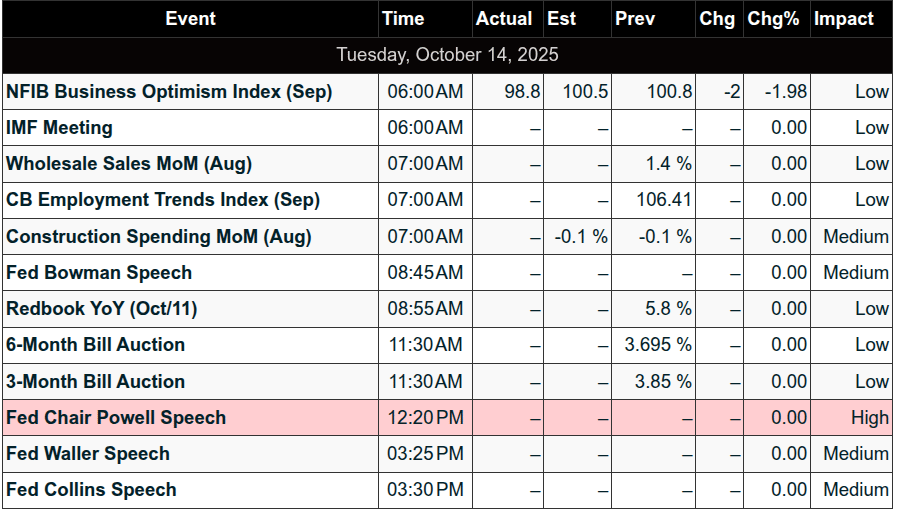
Economic Calendar
Today
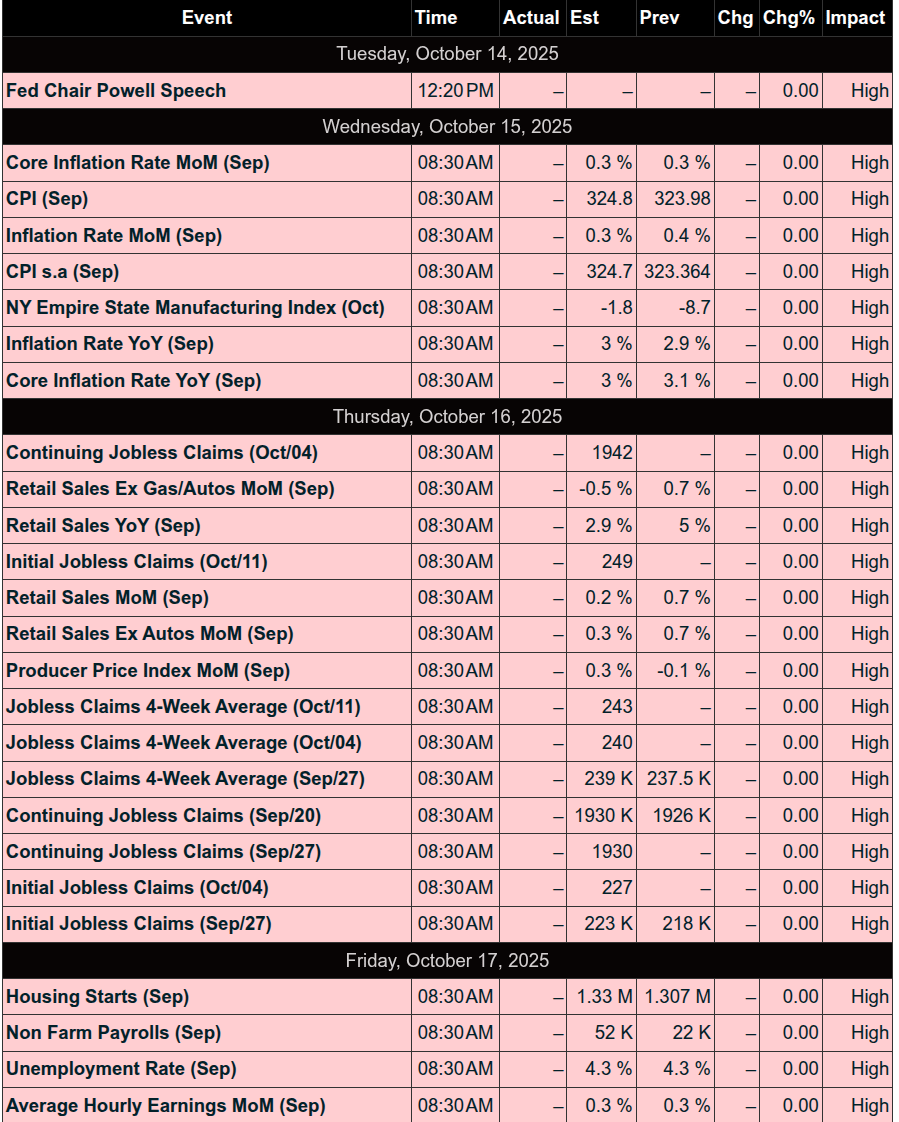
Important Upcoming
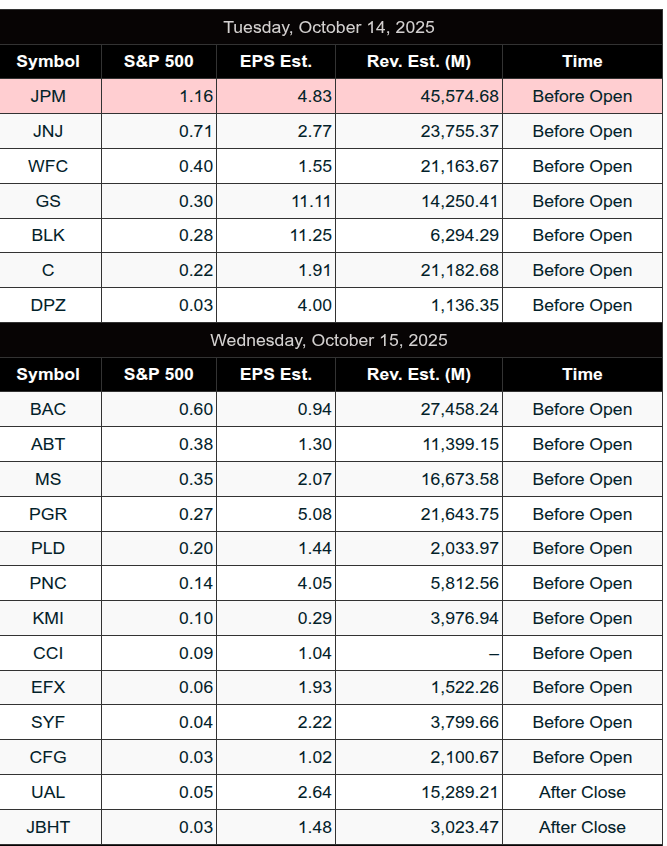
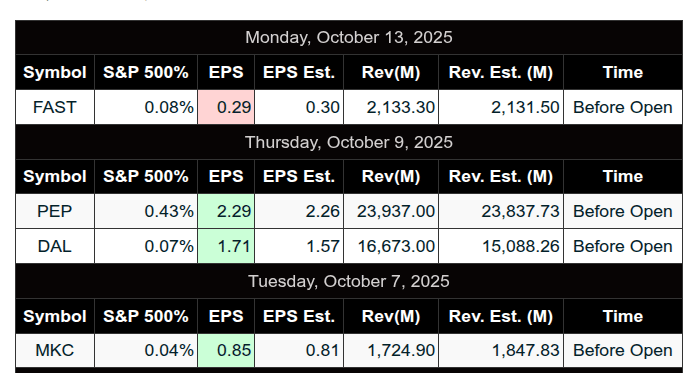
Earnings
Trading Room Summaries
Polaris Trading Group Summary – Monday, October 13, 2025
Monday brought a classic Cycle Day 2 with wide MATD (Morning After Trend Day) rhythms that presented multiple solid trade opportunities, especially for those patient with dip buys. Market action was choppy at times with alternating control between bulls and bears, but ultimately a bullish tone persisted into the close, capped off by a strong $1.8B MOC (Market On Close) buy.
Key Trades & Highlights:
-
Early Morning Setup:
After a hesitant DOJI-type open, PTGDavid noted buyers attempting a full recovery. Dip buys aligned with the bullish tone were playable, encouraging traders to stay present-focused and forget Friday’s action. -
First Valid Long Opportunity:
Manny shared an early long setup at 6686, which unfortunately stopped out (-5 pts). His second entry at 6676 was more successful, scaling partial profits and eventually securing a +10 pt gain on a fill at 6686. Runner was eventually stopped -2 from entry. -
Key Lesson Highlighted:
Manny reflected that while he aimed for longs into the AM low, hindsight revealed that a short into that low would’ve been a better setup — a reminder that being flexible in intraday bias is key. -
PTGDavid’s A10 Trade:
David called out the A10 setup, which paid off nicely after an earlier miss. Trade scaled effectively and was later stopped on a trail for a solid gain, showing the value of sticking with reliable patterns. -
Afternoon Shakeout & Flip-Flops:
The 2 PM shake ‘n bake saw sellers reclaim control, briefly losing the 6698 level. Bulls took it back by 2:30 PM, with PTGDavid noting another power shift. This back-and-forth prompted standing aside during late-session volatility. -
Market Close:
A $1.8B MOC buy confirmed the bullish close. PTGDavid quipped that buyers still “haven’t learned what the SELL button is for,” as Buy The Dip (BTFD) continues to dominate market psychology.
Lessons & Takeaways:
-
Stick to Your Process: Even after an early loss, Manny stuck to his directional thesis and found success in his next trade. Discipline paid off.
-
Watch Emotional Opens: The team noted early volatility and emotional price action — caution was warranted.
-
Avoid Revenge Trading: Manny admitted feeling the urge to “revenge,” but held back — reinforced by David’s reminder: “No revenge.”
-
Recognize Behavior Patterns: Awareness of internal trader psychology (e.g., overtrading, forcing setups) was emphasized throughout the session.
-
Stay Adaptable in Choppy Markets: With multiple control shifts, patience and adaptability proved more valuable than aggression.
Overall Room Performance:
A positive day for disciplined traders. Multiple solid long setups (especially around the AM low and A10) rewarded those sticking with structure. Despite volatility, the room maintained good energy, focus, and a steady flow of educational insights from both David and Manny.
Discovery Trading Group Room Preview – Tuesday, October 14, 2025
-
Macro & Geopolitics: US-China tensions flare again as China retaliates against US shipping curbs, sanctioning five US-linked entities tied to Hanwha Ocean Co. This follows tit-for-tat levies on American vessels. Meanwhile, the US government shutdown persists, stalling key economic data releases (e.g., jobs, CPI, retail sales), putting added focus on Fed Chair Powell’s NABE speech today.
-
Commodities: Silver hits fresh all-time highs amid a physical shortage and strong demand in London. Some traders are flying bars across the Atlantic to capture arbitrage.
-
Tech Spotlight: Nvidia (NVDA) is set to begin shipping the DGX Spark, its smallest supercomputer, aimed at SMBs and developers. Partners include Dell and ASUS.
-
Earnings: Q3 earnings season kicks off. Major names reporting pre-market include AMX, BLK, C, ERIC, JNJ, JPM, GS, and WFC.
-
Markets & Fed:
-
Fed speakers lineup: Bowman (8:45am ET), Powell (12:20pm), Waller (3:25pm), Collins (3:30pm).
-
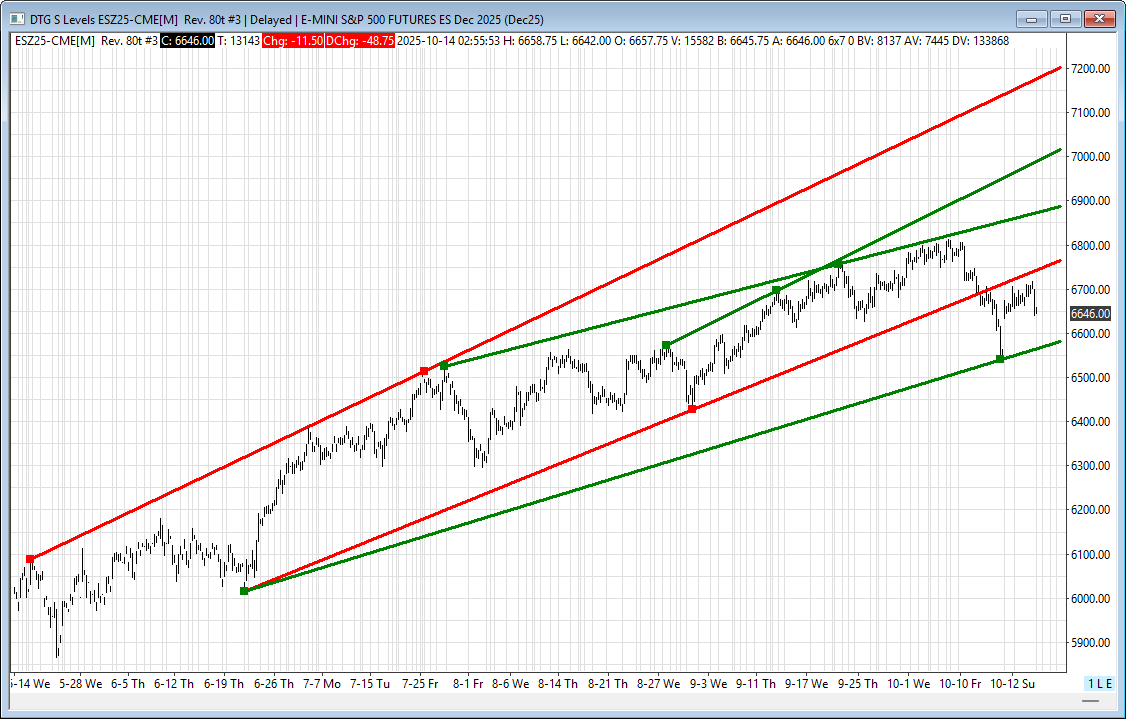
ES remains in a short-term uptrend channel. Key trendline resistance: 6727/32, 6882/87, 7015/20. Support: 6569/74.
-
ES 5-day ADR: 107.75 points; today’s move likely smaller. Volatility elevated but range-bound.
-
Bullish “whale bias” into US open on lighter-than-recent large trader volume.
-
Affiliate Disclosure: This newsletter may contain affiliate links, which means we may earn a commission if you click through and make a purchase. This comes at no additional cost to you and helps us continue providing valuable content. We only recommend products or services we genuinely believe in. Thank you for your support!
Disclaimer: Charts and analysis are for discussion and education purposes only. I am not a financial advisor, do not give financial advice and am not recommending the buying or selling of any security.
Remember: Not all setups will trigger. Not all setups will be profitable. Not all setups should be taken. These are simply the setups that I have put together for years on my own and what I watch as part of my own “game plan” coming into each day. Good luck!
This post goes out as an email to our subscribers every day and is posted for free here around 2 PM ET. To get your real-time copy, sign up for the free or premium version here: Opening Print Subscribe.
Comments are closed