This post goes out as an email to our subscribers every day and is posted for free here around 2 PM ET. To get your real-time copy, sign up for the free or premium version here: Opening Print Subscribe.
March 31, 2026 | Read online
Volatility’s Back on the Floor: 100-Point Swings and Zero Mercy Into the Close
Follow @MrTopStep on Twitter and please share if you find our work valuable!
Our View
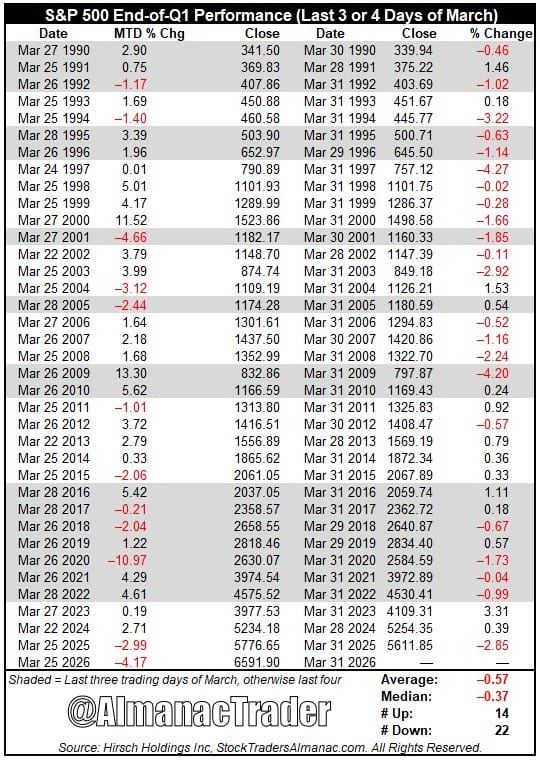
Today is the last trading day of March and the end of Q1 and the JPM Put or Collar. I would like to say things will be quiet, but I don’t think that’s possible. According to Jeff Hirsch’s Stock Trader’s Almanac, end Q1 is:
• Prone to volatility and weakness since 1990
• March has been taking some mean end-of-quarter hits
• 22 of 36 years since 1990, the last 3–4 trading days of March have been a net loser for the S&P 500
End-of-quarter portfolio restructuring likely plays a role as managers square positions for the next quarter. These declines can begin on either the fourth-to-last trading day or the third.
Market weakness dominated the end of March from 1990 through 2009. From 2010 to 2017, the S&P 500 largely bucked the trend. More recently, late-March selling appears to be staging a comeback, down 5 of the last 8 years.
Historically, end-of-Q1 weakness has occurred regardless of how strong or weak the month had been. In 2009, the S&P was up 13.30% and still declined 4.20% over the last three trading days. The S&P was down 10.97% in 2020 and lost another 1.73% at month’s end. Last year, it was down 2.99% and fell another 2.85% into month end.
With the S & P 500 down 10.31% as of March 30, and absent some resolution with Iran, further declines are likely.
Our Lean
I didn’t like how the ES and NQ closed, and barring one of Trump’s TACO headlines, we should see lower prices, especially if the bonds and notes are down and oil is up. I have not paid much attention to the economic reports and Fed speak, but there are plenty today.
I would like to be writing a cheerful report, but there is very little good news to talk about. There was a story out in the WSJ that said Trump told aides he is willing to end the US military campaign against Iran, even if the Strait of Hormuz remains largely closed, but I think that’s just another Trump fairy tale.
As I write this, the ES has traded up to 6454.00 and is trading at 6442, last up 0.84%.
Our lean is pretty much in line with what it’s been for over the last 6 to 8 weeks. You can buy the big gap down or early weakness and sell the dead cat rallies, or just go with the trend and sell the rips. I want to remind everyone, 100-point swings have become commonplace.
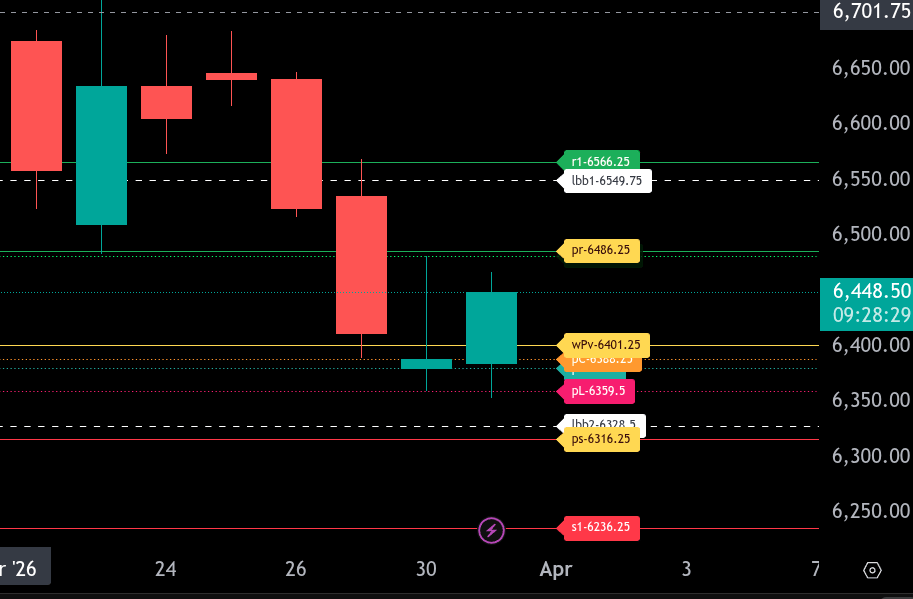
Claude Futures (ESM26)
This combined view tracks the specific price projections alongside your active Market Profile structure.
The market is currently at 6428.50, effectively pinned to the Current VAL.
Macro Resistance & Historical Value
6702.25 – Historical VAH (03/13)
6668.50 – Historical POC (03/13)
6658.25 – 50% Retracement From 4 Week High/Low
6654.50 – Poor High / Anomaly (Unfinished Auction)
6641.75 – Historical VAL (03/13)
6637.36 – 38.2% Retracement From 13 Week Low
6616.38 – 14-3 Day Raw Stochastic at 50%
6586.27 – 38.2% Retracement From 4 Week Low
6582.42 – Pivot Point 3rd Level Resistance
6572.46 – Price 3 Standard Deviations Resistance
6553.25 – Price Crosses 9 Day Moving Average
6548.00 – Current VAH
The Interior Auction
6539.19 – 14 Day %k Stochastic Stalls
6538.66 – Price 2 Standard Deviations Resistance
6532.08 – Pivot Point 2nd Level Resistance
6513.63 – 14-3 Day Raw Stochastic at 30%
6494.60 – Price 1 Standard Deviation Resistance
6488.50 – Current POC (High Volume Fairness)
6462.25 – 14-3 Day Raw Stochastic at 20%
6460.17 – Pivot Point 1st Resistance Point
6429.50 – High
Current Decision Zone (The Value Floor)
6428.50 – Latest Price
6422.00 – Current VAL
6415.99 – 14 Day RSI at 30%
6409.83 – Pivot Point
6388.25 – Previous Close
Lower Support & Discovery
6353.25 – 1-Month / 13-Week / Session Low (Poor Low/No Excess)
6337.92 – Pivot Point 1st Support Point
6309.08 – Target Price
6306.16 – 61.8% Retracement from the 52 Week Low
6287.58 – Pivot Point 2nd Support Point
6281.90 – Price 1 Standard Deviation Support
6271.79 – 3-10 Day Moving Average Crossover Stalls
6237.84 – Price 2 Standard Deviations Support
6215.67 – Pivot Point 3rd Support Point
6204.04 – Price 3 Standard Deviations Support
Market Posture
We are seeing a significant confluence of the Current VAL (6422) and the Pivot Point (6409). If price holds here, the objective is the POC at 6488. If 6409 fails, the lack of “excess” at 6353 suggests a high probability of a liquidation break toward the Target Price of 6309.

Guest Posts:
Tom Incorvia – Blue Tree Strategies
XLF/SPY
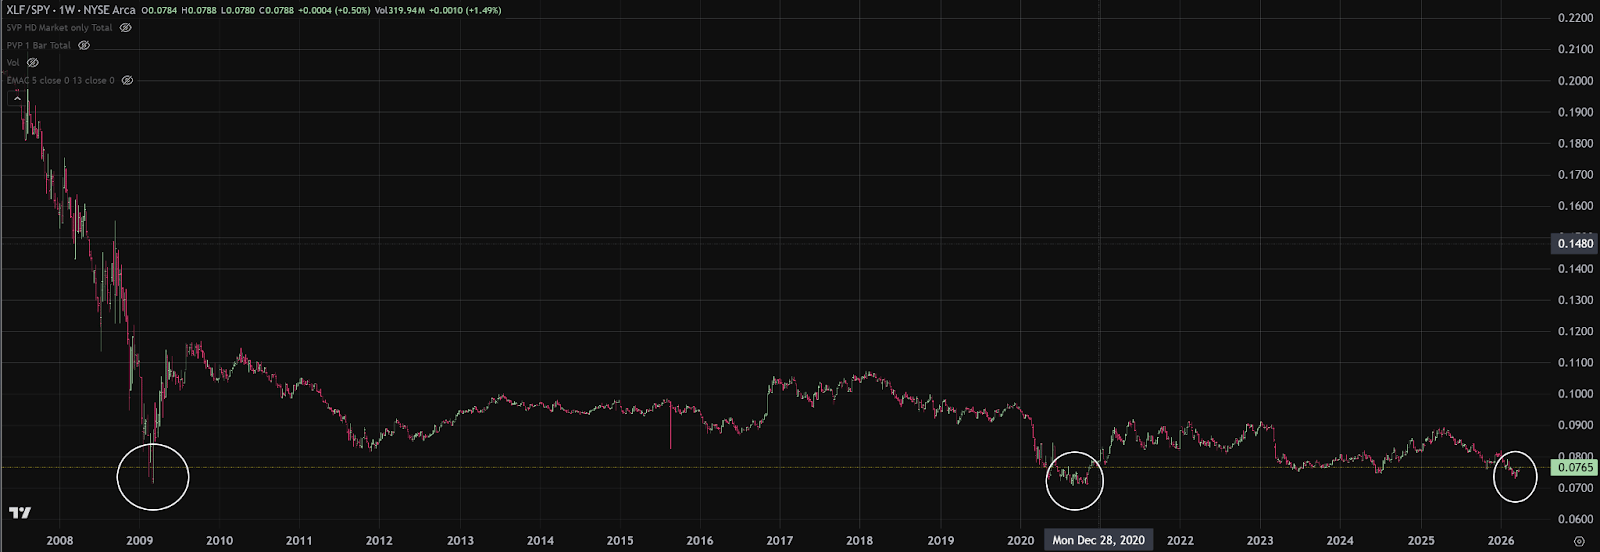
The XLF/SPY ratio is approaching a level that has only been seen during periods of significant market stress—most notably the 2008 financial crisis and the 2020 COVID shutdown.
In simple terms, Financials have been underperforming the broader market for an extended period, pushing this ratio down to an area that has historically marked extreme pessimism and potential exhaustion.
While the trend is still clearly lower—and this is not typically the type of environment to step in front of—this level deserves attention. When markets reach these kinds of extremes, the conversation begins to shift from trend continuation to potential inflection.
What matters now is not prediction, but observation.
We want to see:
-
A slowdown in downside momentum
-
Signs of relative strength returning to Financials
-
Evidence that price is beginning to build value, rather than continue lower
Until then, the trend remains intact. But historically, this is where markets begin to transition—if they’re going to.
You can purchase Tom’s Course on Volume Profile here
Rich Miller – rich@handelstats.com: HandelStats.com
Last Day of March on a Tuesday: Watch the Reversal Setup
Looking at the last trading day of March since 1980, the broad numbers show a market with no overall bias:
-
46 occurrences
-
23 up
-
23 down
-
50.0% up
On the surface, that is a completely neutral setup.
But when the last day of March falls on a Tuesday, the data becomes much more interesting.
Last Day of March Falling on a Tuesday
Since 1980, this has occurred 7 times:
-
5 up
-
2 down
-
71.4% positive
That alone is notable, but the more important pattern is what happened the day before.
The Key Tell: Monday Has Been Opposite
In all 7 Tuesday occurrences, the Monday immediately before moved in the opposite direction of Tuesday.
That means:
-
When Tuesday closed higher, Monday had closed lower
-
When Tuesday closed lower, Monday had closed higher
So the pattern is not just a Tuesday bias.
It is a reversal relationship from Monday into the final trading day of March when that final day lands on a Tuesday.
Why This Matters
That suggests the market has tended to flip direction from the prior session rather than simply trend through quarter-end.
So the setup to watch is:
-
Weak Monday → potential strength on Tuesday
-
Strong Monday → risk of weakness on Tuesday
This turns the study from a simple seasonal stat into something much more useful tactically. It gives traders a conditional framework rather than just a standalone probability.
Bottom Line
-
Last day of March overall: neutral
-
Last day of March on Tuesday: bullish bias
-
Most important detail: the Monday before has been opposite every time
That makes this less of a raw calendar tendency and more of a calendar-based reversal setup.
Headlines, Gamma, and the Trap : @Manny_Trends
We are trading inside a headline-driven minefield.
At the time of writing, futures caught a bid on:
“Progress in US–Iran war talks.”
ES immediately pushed ~20 handles.
That is the tape.
This is exactly the environment we’ve been discussing:
-
geopolitical tension
-
energy volatility
-
policy uncertainty
-
and now, real-time headline-driven price action
If you’re not careful, this turns into a whipsaw tape quickly.
The Bigger Context
There is still a major macro catalyst hanging over this market:
The Iran situation.
That alone is enough to keep volatility elevated.
I still expect a pump at some point—not because the market is healthy, but because that’s how distribution works.
Markets don’t roll over cleanly.
They reset positioning first.
That requires:
-
a move higher
-
a shift in sentiment
-
a degree of complacency
From a structural standpoint, SPX still has unfinished business in the 6850–6915 range.
But that does not mean we get there cleanly.
What the Book Is Saying
When we were pressing all-time highs, I leaned short—not because of headlines, but because the book suggested distribution.
By “the book,” I mean:
-
positioning
-
failed breakouts
-
expanding ranges
And we saw the result:
~600-point drawdown.
Now?
The book is not signaling clear accumulation.
And in this type of environment, it likely won’t be obvious when it does.
Instead, expect:
-
failed breakouts
-
sharp reversals
-
wide, overlapping ranges
That is distribution behavior.
Gamma Is Driving This Tape
We are in negative gamma.
That changes everything.
In negative gamma environments:
-
markets expand, not stabilize
-
hedging amplifies moves, it doesn’t dampen them
Dealers are forced to chase price, which leads to:
-
larger candles
-
faster directional moves
-
exaggerated reactions to headlines
This is why:
-
breakouts often fail
-
reversals overshoot
-
moves feel aggressive and disorderly
The market is not discovering price.
It is reacting to hedging flows.
Bigger Picture Threshold
The market is not structurally bullish yet.
That only begins to change above 6600, where positioning and structure would start to shift more meaningfully.
Until then:
rallies are likely part of the distribution process.
Where the Rubber Meets the Road
This is not a trend environment.
This is a reaction environment:
-
headlines hit
-
price moves
-
gamma expands the move
-
traders get caught in between
The job is simple:
-
respect levels
-
understand the environment
-
stay flexible
Bias gets punished here.
The Bottom Line
We are in a distribution year.
That likely means:
-
sharp moves higher
-
sharp moves lower
-
and a lot of noise in between
This morning’s headline is the perfect example.
One line of “progress”… and ES moves 20 handles.
That is the tape.
In this environment, edge doesn’t come from predicting.
It comes from reacting faster than positioning can adjust.
If this bigger picture is the map, the daily levels are the execution plan.
I post those each morning on X: @manny_trends
IMPRO members see that work first.
— Manny Payano
Market Recap
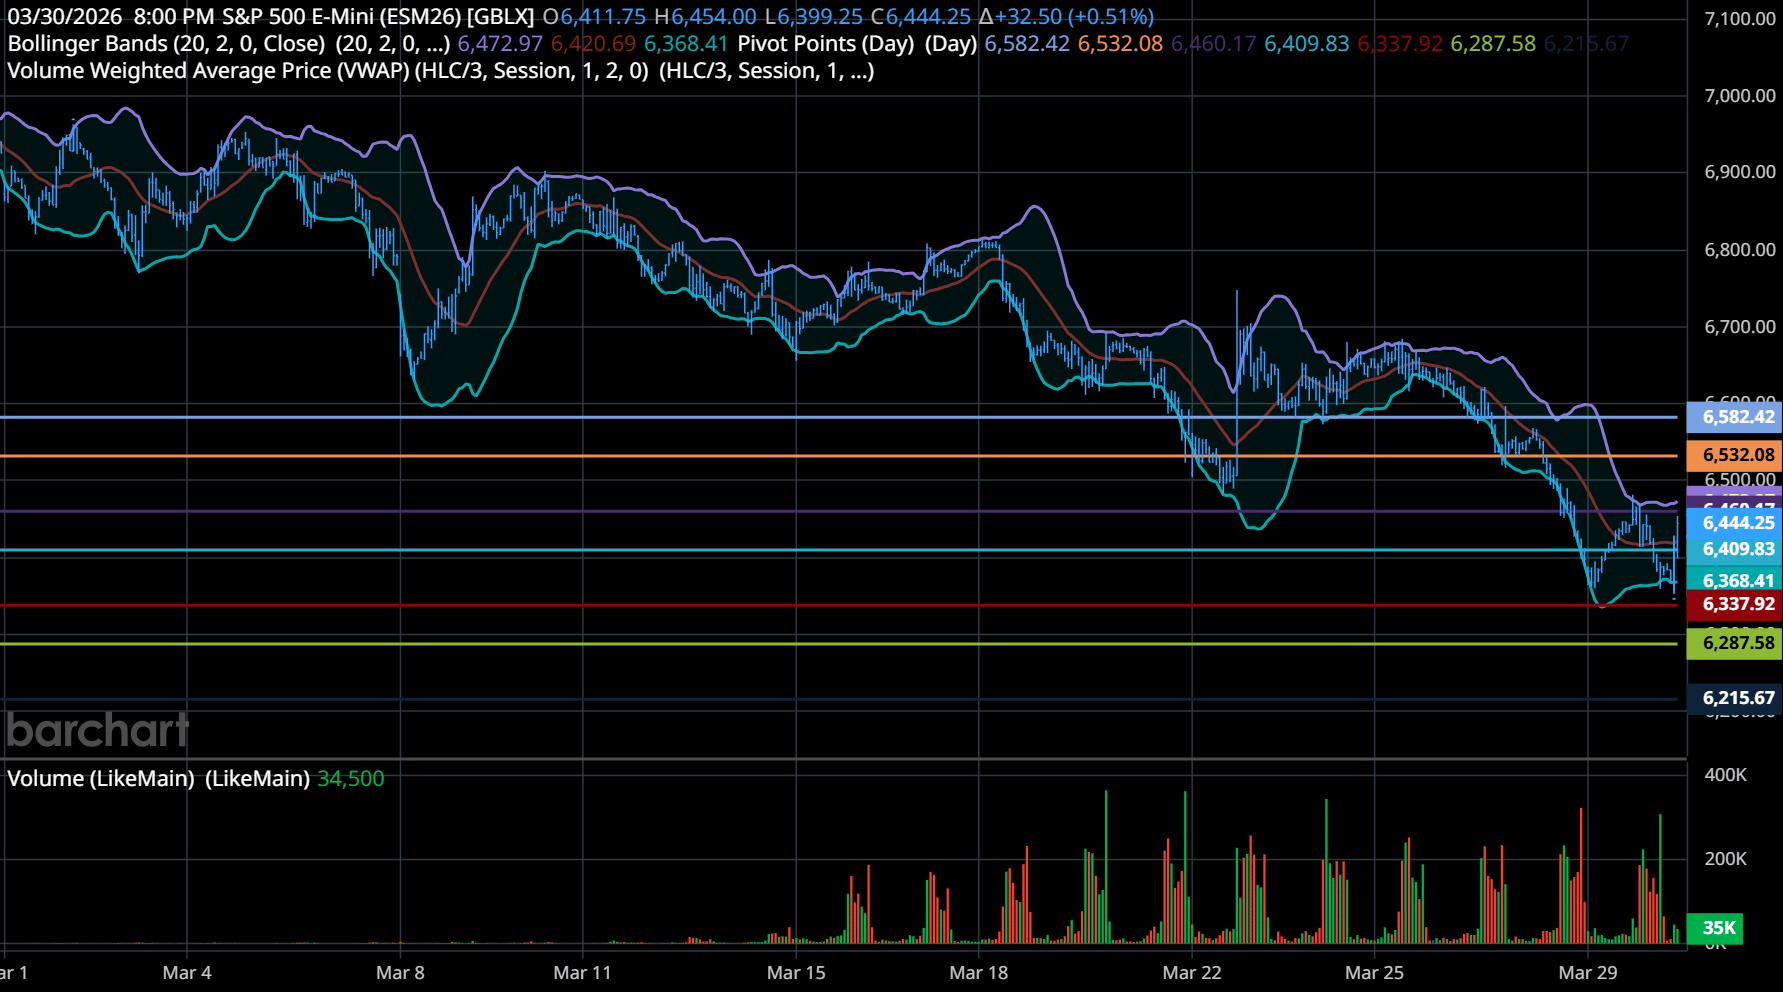
1-Month ESM26 Chart
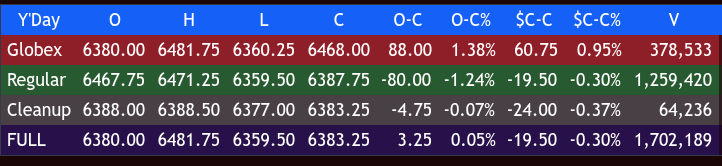
The ES traded 6411.25 and traded up to 6481.75 on Globex, with 380k ES traded, and opened funday Monday’s regular session at 6467.75, up 6.50 points.
After the open, the ES traded 6454.75 and rallied up to 6471.25. It then sold off down to 6413.75 at 9:55 and traded up to 6435.50 at 10:10. The ES sold back off to a higher low at 6414.50 at 10:45, then rallied up to a lower high at 6455.75 at 11:05. It sold off down to 6423.00 at 11:15 and rallied up to another lower high at 6452.50 at 11:50. The ES then sold off down to new lows at 6393.75 at 1:35 and rallied up to 6413.50 at 1:45. It sold off down to a new low at 6359.50 at 3:34 and rallied up to 6382.25 at 3:48. The ES traded 6378.00 as the 3:50 cash imbalance showed $280 million to sell, then traded up to 6394.25 at 3:55 and traded 6387.75 on the 4:00 cash close.
After 4:00, the ES traded down to 6377.00, flatlined, and settled at 6388.25, down 24 points or -0.38%, down 3 sessions in a row for a total loss of 252.50 points or -3.84%. The NQ settled at 23139.75, down 188.75 points or 0.81%, also down 3 sessions in a row for a total loss of 1,228 points or -5.12%. The YM settled at 45,465, up 41 points or +0.09%, and the RTY settled at 2428.20, down 35.80 points or 1.45% on the day, or down 3 sessions in a row for a total loss of 123 points or -4.92%.
In the end, we all have to own our own path in life, and we have to make decisions that won’t necessarily be easy to make, but the war in the Middle East has added a level of uncertainty and economic stress like we have never seen before. In terms of the ES’s overall tone, it was weak, but I think the real question is… what did you expect? In terms of the ES’s overall trade, volume was low at 1.7 million contracts traded.
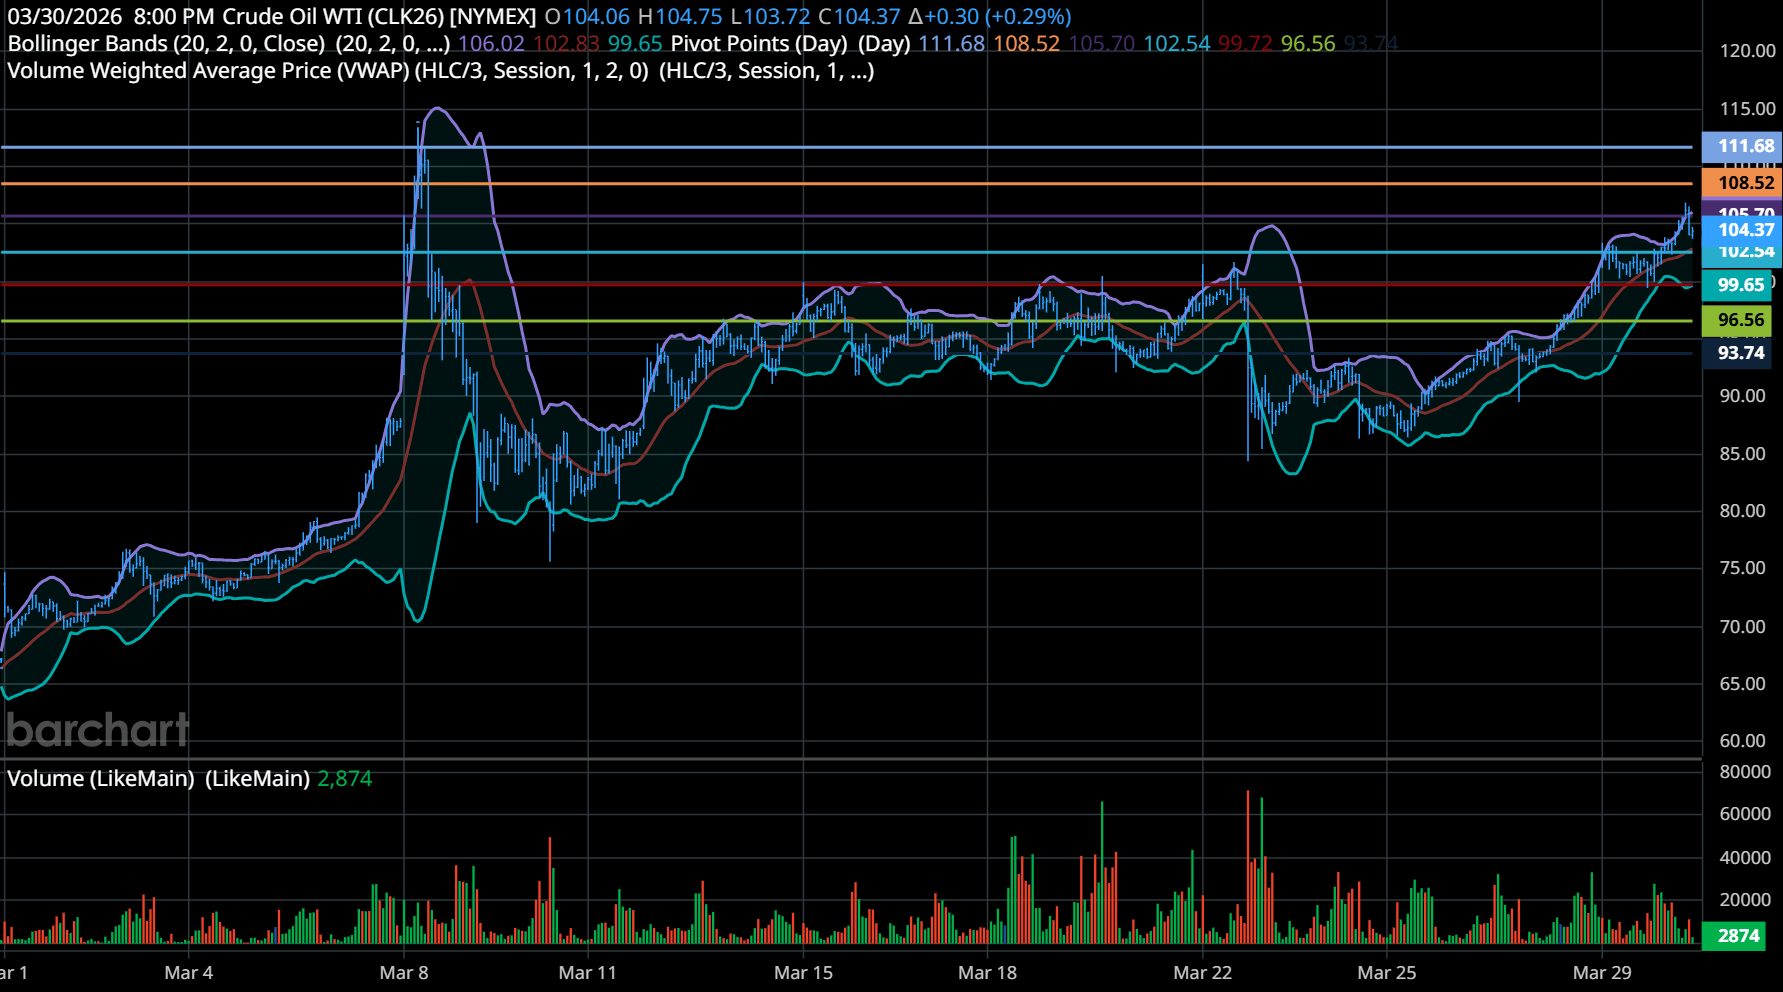
1-Month CLJ26 Chart
Gold rallied, but it’s still all eyes on oil. Trump continues with this “talks with Iran are going well,” while the US continues to build up its military presence with new ground troops and navy vessels. I get it, the index markets are weak, but the outperformer isn’t a stock index or a stock, it’s the $CLK (crude futures), which is currently pricing in more bad news, which has been up 16 of the last 23 sessions, or up $41.81 or +52.25%. Obviously, I can’t do the math on my own, so I asked Claud, “At this pace, how long will it take to trade up to 110. 115, 120, 125?” and here is what it said:
Target Price Trading Days Needed Estimated Achievement Date
110.00 ~2.3 Days Thursday, April 2, 2026
115.00 ~5.1 Days Tuesday, April 7, 2026
120.00 ~7.9 Days Friday, April 10, 2026
125.00 ~10.8 Days Wednesday, April 15, 2026
There are many stories of Iran being the big winner due to shutting down the Strait of Hormuz, but how will they export oil with the war going on, and what happens when the war is over? I find it unlikely that energy prices will remain high once oil starts flowing again, but Iran has done billions of dollars in damage to the Middle East oil infrastructure that will take years to rebuild, including rebuilding their own infrastructure, so maybe that is what they are banking on.
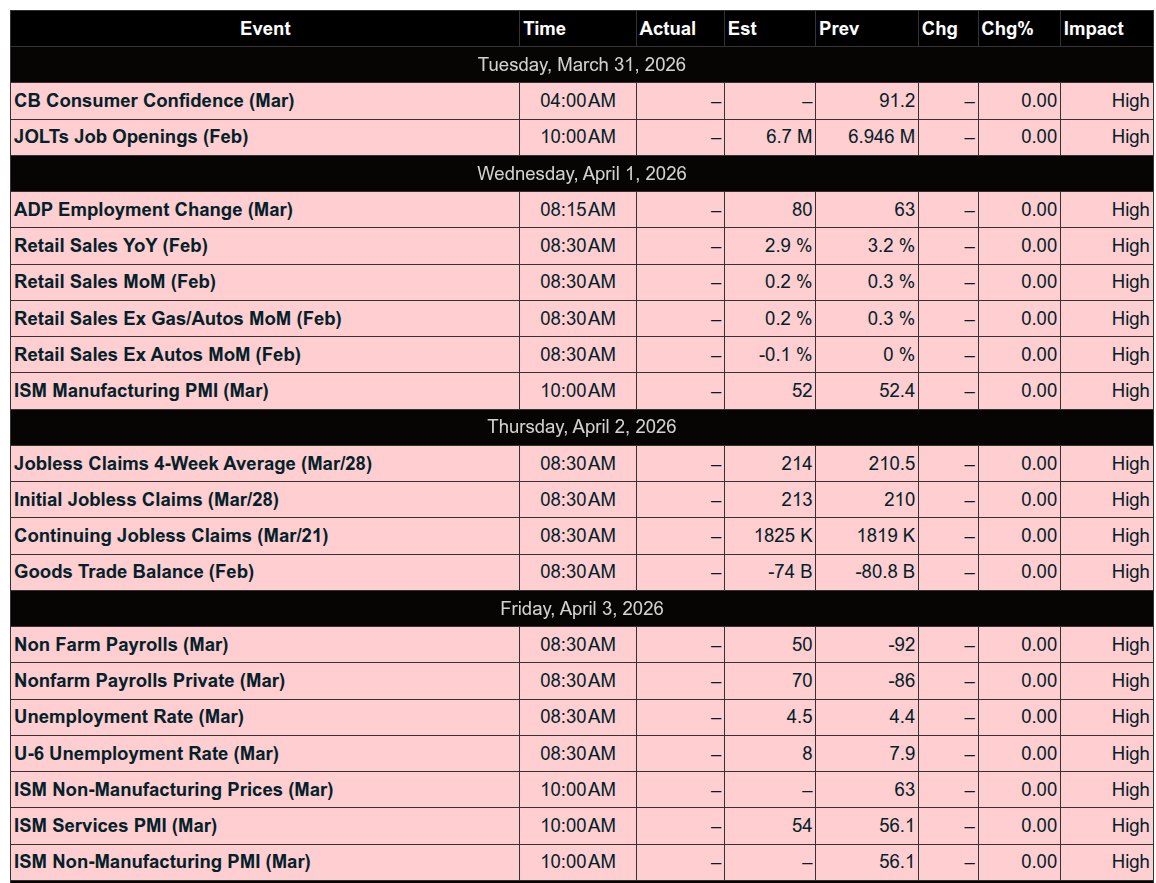
On Tap Today
9:00 am: S&P Case-Shiller home price index (20 cities)
9:45 am: Chicago Business Barometer (PMI)
10:00 am: Job openings
10:00 am: Consumer confidence
12:00 pm: Chicago Fed President Austan Goolsbee speaks
3:00 pm: Fed governor Michael Barr speaks
5:10 pm: Fed Vice Chair for Supervision Michelle Bowman speaks
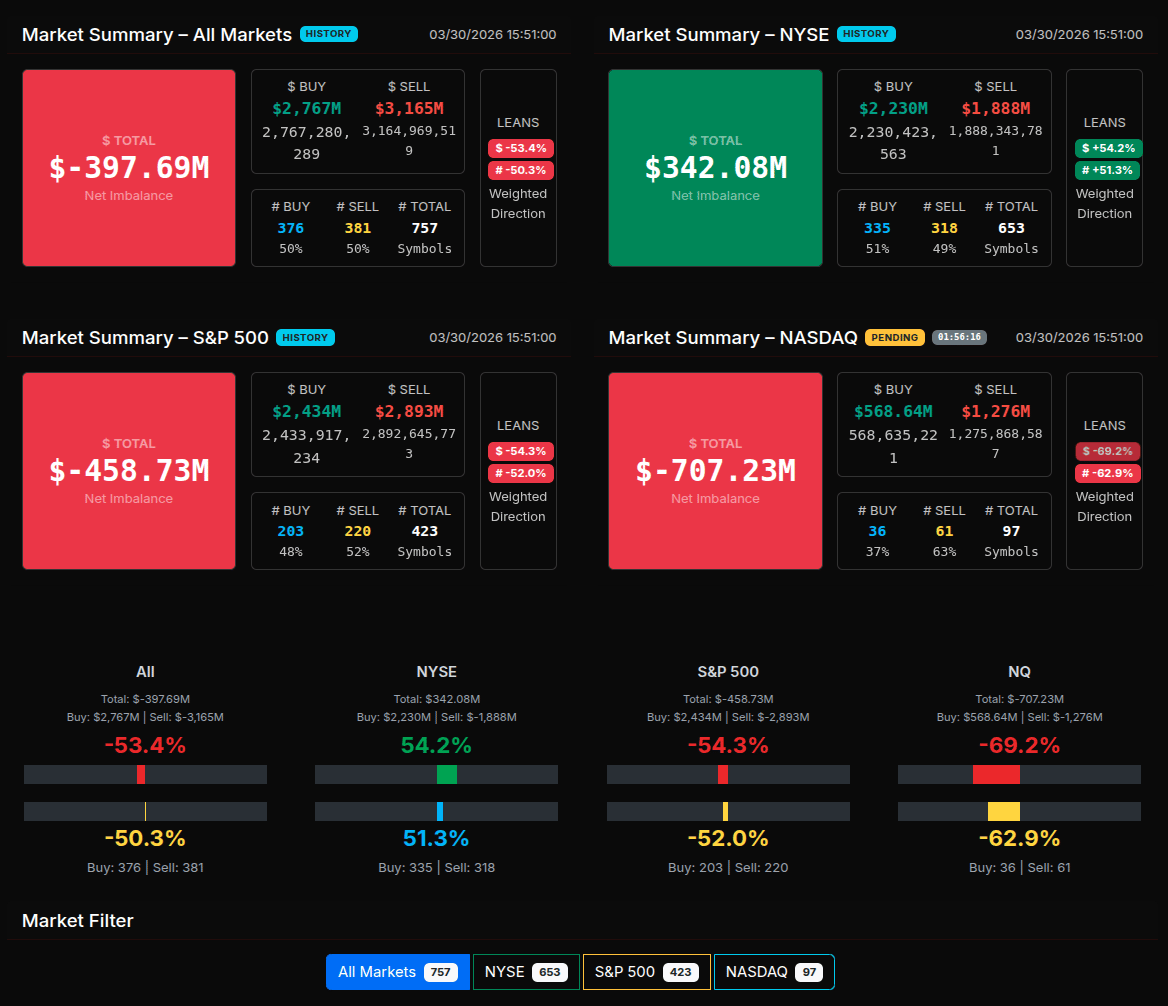
MiM
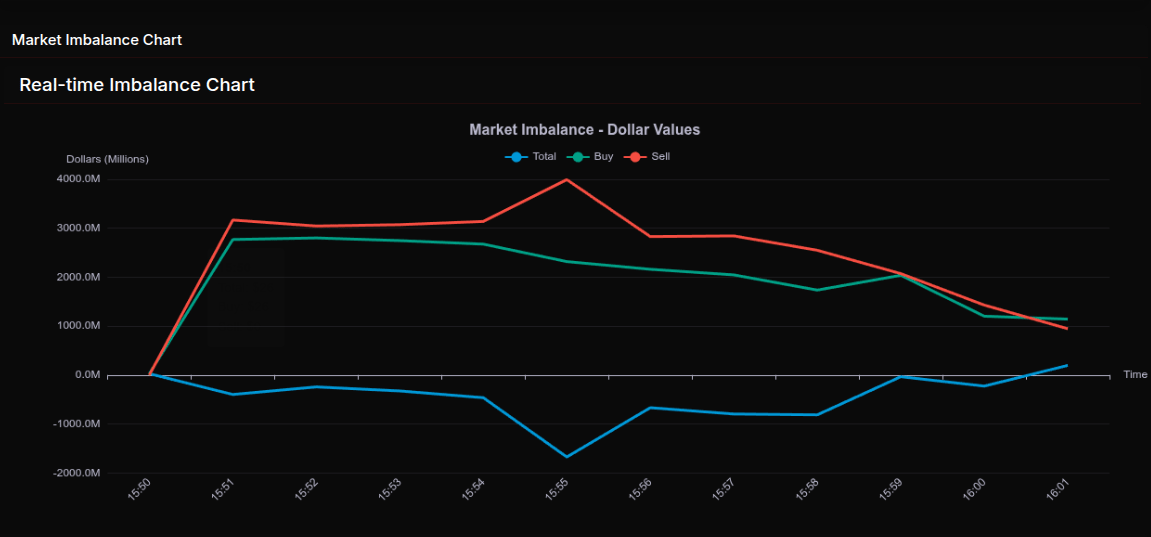
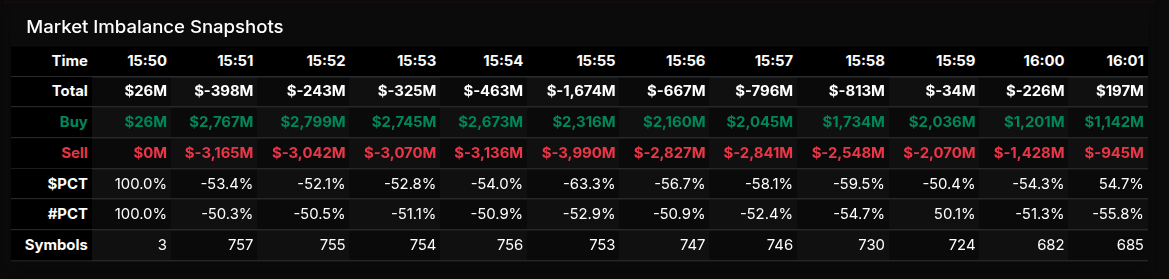
Market-on-Close Recap – MiM
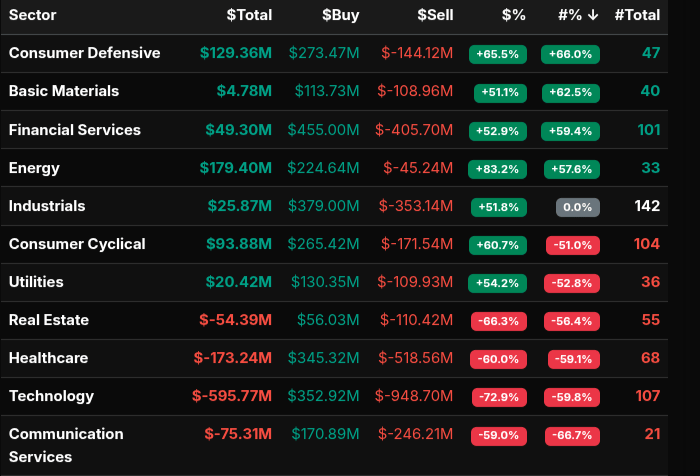
The MOC session opened with a broadly defensive tone, as early imbalance data at 15:50 showed a modest +$26M buy skew that quickly flipped into sustained sell pressure. By 15:51, the market had sharply transitioned to -$398M, establishing a clear sell-side bias that persisted for most of the auction. The imbalance deepened into the mid-window, reaching a low near -$1.67B at 15:55, marking the session’s peak institutional supply phase. From there, the tape stabilized, with selling pressure gradually moderating into the close, ultimately flipping to a +$197M buy imbalance at 16:01—suggesting late buy programs or rebalancing flows.
Sector behavior reinforced this two-phase structure. Early and mid-session selling was concentrated in Technology (-72.9%), Communication Services (-59.0%), and Healthcare (-60.0%), all of which registered strong directional (non-rotational) sell programs. Technology stood out as the most aggressive, clearly exceeding the -66% threshold, indicating wholesale distribution rather than rotation. Real Estate (-66.3%) also approached this extreme, confirming broad risk-off positioning.
Conversely, buy-side activity was concentrated in Energy (+83.2%), Consumer Defensive (+65.5%), and Financials (+52.9%). Energy was particularly notable, exceeding the +66% threshold and signaling aggressive accumulation. Consumer Cyclical (+60.7%) and Utilities (+54.2%) leaned positive but remained more rotational in nature.
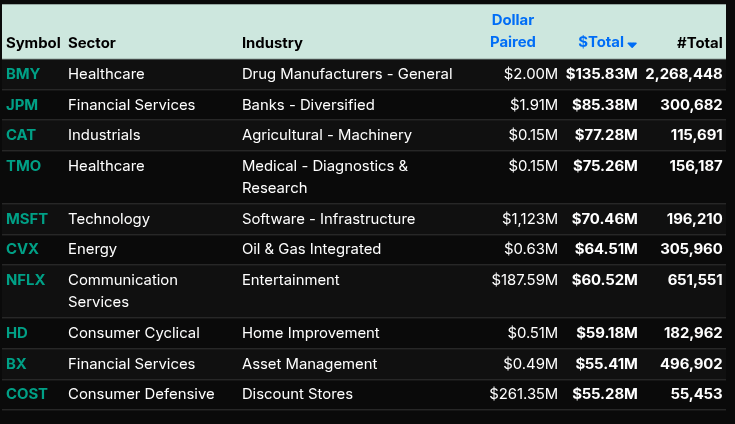
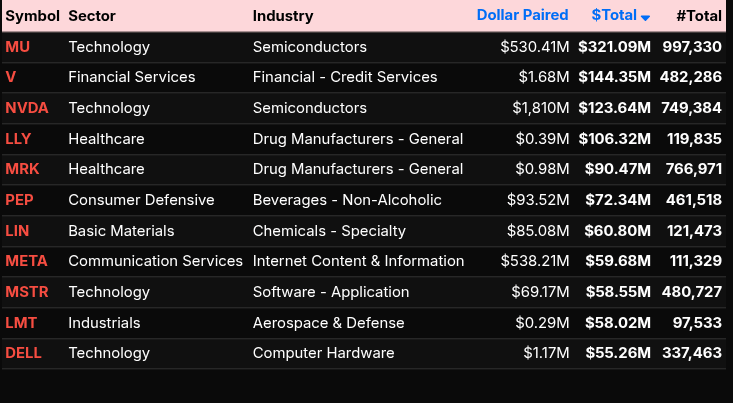
On the single-name level, the sell pressure was led by large-cap tech: NVDA, META, MSFT, and MSTR all contributed to the imbalance, reinforcing the sector-wide liquidation theme. Communication weakness via META and NFLX further confirmed growth-oriented outflows. On the buy side, flows rotated into defensives and cyclically stable names such as BMY, JPM, CVX, and COST. Notably, MU printed the largest paired volume but still closed as a net buy, reflecting two-way institutional activity rather than outright conviction.
Overall, the session evolved from broad sell-side pressure into a late buy imbalance, with clear sector rotation out of high-beta tech and into energy and defensive positioning.
Technical Edge
Fair Values for March 31, 2026:
-
SP: 43.04
-
NQ: 182.53
-
Dow: 236.13
Daily Market Recap 📊
For Monday, March 30, 2026
• NYSE Breadth: 46% Upside Volume
• Nasdaq Breadth: 44% Upside Volume
• Total Breadth: 45% Upside Volume
• NYSE Advance/Decline: 50% Advance
• Nasdaq Advance/Decline: 42% Advance
• Total Advance/Decline: 45% Advance
• NYSE New Highs/New Lows: 90 / 168
• Nasdaq New Highs/New Lows: 60 / 537
• NYSE TRIN: 1.10
• Nasdaq TRIN: 0.90
Weekly Breadth Data 📈
For Week Ending Friday, March 27, 2026
• NYSE Breadth: 54% Upside Volume
• Nasdaq Breadth: 46% Upside Volume
• Total Breadth: 49% Upside Volume
• NYSE Advance/Decline: 47% Advance
• Nasdaq Advance/Decline: 39% Advance
• Total Advance/Decline: 42% Advance
• NYSE New Highs/New Lows: 156 / 308
• Nasdaq New Highs/New Lows: 217 / 837
• NYSE TRIN: 0.74
• Nasdaq TRIN: 0.72
ES & NQ Levels (Premium only)

ES – M26 Levels
The bull/bear line for the ES is at 6401.25. This remains the key pivot for today’s session. Holding above this level keeps the market in a bullish posture, while acceptance back below signals a shift toward downside control.
ES is currently trading around 6450.25, firmly above the bull/bear line, indicating early strength in the Globex session. As long as price holds above 6401.25, dips are likely to be supported, and buyers may continue to step in.
On the upside, resistance is seen at 6486.25, which is the upper intraday range target. A push into this level is likely if momentum continues. Above 6486.25, watch for extension toward 6549.75 and then 6566.25. Acceptance above the upper range would signal continued bullish expansion.
On the downside, initial support sits at 6401.25, followed by 6388.25 and 6380.00. A break below these levels would shift momentum lower, targeting 6359.50 and then 6316.25, which is the lower range target for the session. A move into this zone would indicate a deeper retracement and potential trend reversal.
Overall, the market is bullish above 6401.25, with buyers in control while price holds above this pivot. A loss of 6401.25 would be the first sign of weakness and open the door for a move back into the lower range.
NQ – M26 – Levels
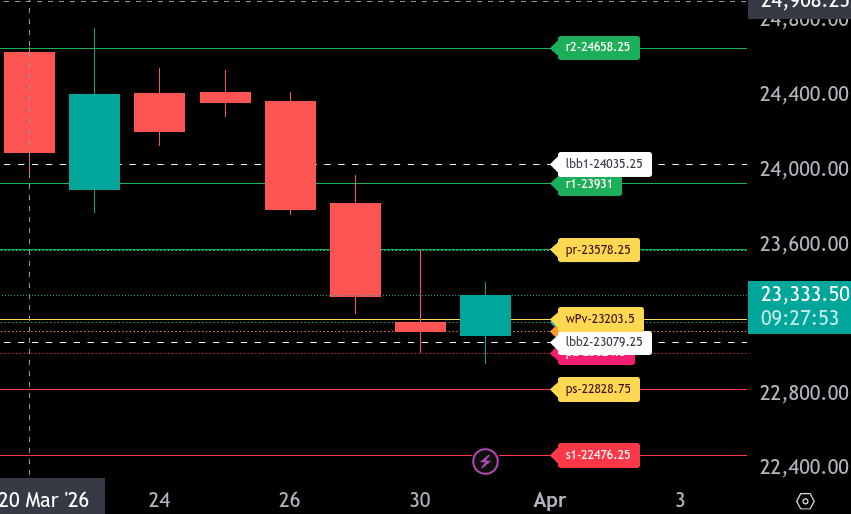
The bull/bear line for the NQ is at 23203.50. This is the key level that defines intraday sentiment. Holding above this level keeps buyers in control, while acceptance below it shifts momentum back to the downside.
Currently, NQ is trading around 23333.50, slightly above the bull/bear line, suggesting a tentative attempt to stabilize after recent weakness. As long as price holds above 23203.50, we can look for continuation higher toward 23578.25, which is the upper intraday range target.
On the downside, immediate support sits at 23079.25. A break and acceptance below this level would expose 22828.75, the lower range target for today. If selling accelerates through that zone, further downside could extend toward 22476.25.
On the upside, resistance comes in at 23578.25 initially, followed by 23931.00 and then 24035.25. A sustained move above 23578.25 opens the door for a broader recovery into those higher resistance levels.
Overall, price is attempting to reclaim strength above 23203.50. Holding above keeps the bias neutral-to-bullish intraday, while losing that level would reintroduce downside pressure quickly.
Calendars
Economic Calendar
Trading Room Summaries
Polaris Trading Group Summary – Monday, March 30, 2026
Monday was a highly directional, trend-driven downside day, with excellent read-through from David on structure, cycle projections, and key levels. The room capitalized well on both early opportunities and sustained downside continuation.
Market Narrative
-
Overnight, ES tagged the 6365 D-Level and reversed sharply, setting the stage for early positioning.
-
Price pushed higher into the open, but David identified this as a classic “Jam n Slam” setup:
-
Weak structure from overnight ramp
-
Lack of real buyers underneath
-
-
This led to a clean transition from early strength → sustained sell pressure
Key Trades & Wins
1. Crude Oil (CL) – Clean Open Range Winner
-
Open Range Long hit target quickly
-
Follow-through confirmed strength above the “hundo” marker
-
Later: All long OR targets fulfilled
Great example of letting the OR setup play out cleanly without overthinking
2. ES / NQ – Open Range Shorts
-
Early recognition of weak structure despite initial push up
-
Open Range Shorts triggered and hit initial targets
-
NQ noted as weaker than ES, reinforcing short bias
Strong read on relative weakness + structure = high-probability short
3. Trend Day Down – Cycle Alignment
-
Price “bled red from the open” with little meaningful bounce
-
Key downside levels were systematically called and hit:
-
6405.98 (cycle projection)
-
6389 (Prior Low)
-
6381.49 – 6378.30 zone
-
6369 → 6364 zone
-
This was a textbook level-to-level trend day, rewarding patience and holding runners.
4. D-Level Reaction (Late Day)
-
Late session bounce off D-Level produced ~20+ point reaction
-
Led to reclaim of Prior Low (6389) into the close
Reinforces the importance of:
-
Trusting key structural levels
-
Staying engaged even late in the session
Key Lessons & Insights
1. “Jam n Slam” = Sell the Weak Structure
-
Overnight strength ≠ real strength
-
When structure is poor, expect air pockets on pullbacks
-
Buyers were “non-existent” → strong conviction to short
2. Follow the Levels, Not Emotion
-
The day was a perfect example of disciplined level trading
-
Each downside target was:
-
Predefined
-
Hit in sequence
-
-
No guessing, just execution
3. Not Every Signal is a Trade
-
Midday 200XT setup was identified but passed due to poor structure
Critical reminder: Clean configuration > forcing trades
4. Cycle Awareness Matters
-
Market hit Cycle Day projections early
-
Discussion of a potential failed 3-day cycle (rare event)
Adds context to:
-
Why downside extended
-
Why bounces were weak
5. Patience Pays on Trend Days
-
Many opportunities, but the biggest gains came from:
-
Holding shorts
-
Trusting continuation
-
-
As one member noted: “Your short is printing wow”
Final Takeaway
This was a model PTG trend day:
-
Identify weak structure early
-
Execute OR setups
-
Trust downside levels
-
Stay patient for continuation
The biggest edge came from alignment of structure + cycles + levels
Discovery Trading Group Room Preview – Tuesday, March 31, 2026
-
Market Brief – Morning Update
-
Macro Focus: Middle East conflict remains the primary driver
-
Sentiment Boost: WSJ report of potential US–Iran negotiations lifted futures
-
Oil: Holding >$100 → near-term inflation pressure
Fed Takeaways:
-
Williams: Oil likely to push inflation higher short-term
-
Powell:
-
Rates “in a good place” → wait-and-see mode
-
No signs of systemic risk / contagion
-
Tariff-driven inflation seen as temporary
-
Geopolitics:
-
إيران attack on oil tanker near Dubai (no casualties, no leak)
-
Continued missile/drone escalation across Gulf, Israel, Turkey
-
Rising risk premium in energy markets
Market Risks:
-
Sustained high oil →
-
ضغط on consumers & corporate margins
-
Potential pullback in AI/data center capex
-
Broader equity market correction risk
-
Today’s Catalysts:
-
9:00 ET: HPI
-
9:45 ET: Chicago PMI
-
10:00 ET: JOLTS + Consumer Confidence (key)
-
Fed speakers throughout day
-
Earnings: MKC, SNX (pre) | NKE (post)
Flows & Volatility:
-
Volatility: Still elevated (ADR ~123.5, down ~30 pts)
-
Whale flow: Slight bullish lean, lighter volume
ES Technicals:
-
Holding downtrend channel support: 6344/39
-
Breakdown below → 6135 major support
-
Resistance ladder:
-
6609/04
-
6712/07
-
6900/95
-
-
50DMA (6852) accelerating toward 200DMA (6772)
Bottom Line:
-
Near-term: Bulls have room above channel support
-
Bigger picture: Oil + geopolitics remain the key risk drivers
-
Affiliate Disclosure: This newsletter may contain affiliate links, which means we may earn a commission if you click through and make a purchase. This comes at no additional cost to you and helps us continue providing valuable content. We only recommend products or services we genuinely believe in. Thank you for your support!
Disclaimer: Charts and analysis are for discussion and education purposes only. I am not a financial advisor, do not give financial advice and am not recommending the buying or selling of any security.
Remember: Not all setups will trigger. Not all setups will be profitable. Not all setups should be taken. These are simply the setups that I have put together for years on my own and what I watch as part of my own “game plan” coming into each day. Good luck!
This post goes out as an email to our subscribers every day and is posted for free here around 2 PM ET. To get your real-time copy, sign up for the free or premium version here: Opening Print Subscribe.
Comments are closed