This post goes out as an email to our subscribers every day and is posted for free here around 2 PM ET. To get your real-time copy, sign up for the free or premium version here: Opening Print Subscribe.
Wall Street’s Rebound: A Historic Flow Out, Then a Surge Back In
Follow @MrTopStep on Twitter and please share if you find our work valuable!
FREE Two Week Offer for the Opening Print Premium. Open up the Lean and other premium features for the next Two Weeks!
Our View
The ES rallied 1,053.50 points off its 4,832.00 low. At the height of Trump’s tariffs—or “Tariff Liberation Day”—he became one of the most disliked presidents in many years. His art-of-the-deal making was clearly blowing up the stock market and caused the largest U.S. stock market outflows into the European indices in the history of the markets.
Approximately $81.3 billion moved out of the U.S. stock market in early 2025, with $63 billion from foreign investors (primarily European) in March–April and $18.3 billion from U.S. equity funds in early May. Of this, at least $24.779 billion is confirmed to have moved into European stock markets, including $15.779 billion in European ETF inflows, $2 billion in U.S.-based European ETF inflows, and $7 billion in international stock inflows led by Europe.
The outflows are probably higher, but obviously global investors got nervous. The dollar was tumbling, and TRUMP wasn’t just blowing up the U.S.—he was taking the world with it. Fast forward, the ES just traded 5,927.000 and is positive since Trump’s Tariff Liberation Day.
-
Weekly performance shows a gain of 4.99% from May 6 to May 13, 2025.
-
The monthly gain is 9.75% from April 11 to May 13, 2025.
-
The quarterly gain is 3.80%, from April 2 to May 13, 2025.
-
The year-to-date performance as of May 13, 2025 is up 0.3% from December 31, 2024.
The big risk-off trade has been followed by a rush to get back in. While some people think that Trump caved in on the China tariffs, it all looks like he did exactly what he set out to do and said he knew what he was doing the whole time. When I spoke to the PitBull, he said he’s never seen a market move like this and went on to say it looks like we are going to 6000.00.
I remember writing about how the buyers usually show up when the ES is down 20% (it fell 21.64%) and listed the number of 20% drops or more. There have been only six occasions since 1980. A 25% or more drop has only occurred ten times, including major events like the Great Depression (1929–1932) and the 2008 financial crisis. 30% declines have only happened eight times, with the most notable being the 2008 credit crisis and the 2020 COVID-19 crash.
Conclusion: While they may be far and few between, 20% to 30% declines are historically a good time to enter the stock market.
Like Trump or not, the ES and NQ have had a hell of a rally. It’s totally crazy, the buyers have this so locked down that the ES didn’t even have 20-point pullbacks until after 4:00. The PPT has spoken, and there just seems like there’s no stopping the push higher. The ES is only 308 points off its all-time high at 6,235.00, and the NQ is 1,326 points off its all-time high at 22,672.00.
While the index markets have rallied, the unwind between bonds and notes continues. Yesterday, bonds traded down to 112.59, just a few points off the low of 110.59 set on April 8th. There were two distinct rotations yesterday: buying the NQ and selling the RTY, and a pattern we’ve been seeing regularly, buying the 10-Year Note and selling the 30-Year Bond, which has been very prevalent over the last several trading sessions.
The 30-Year U.S. Treasury bond yield has increased by approximately 15.5 basis points, from ~4.645% on April 4, 2025, to ~4.80% on May 13, 2025. For comparison, the 10-Year Treasury Note yield rose by 60 basis points, from 3.90% to 4.50% over the same period.
Our Lean
A trader from the MrTopStep chat said Goldman Sachs PB data for yesterday was quite epic. Highlights:
-
Global equities had the second-largest net buying day in 5 years (3.7 sigma).
-
Buying was significantly driven by short covers (1.6 to 1).
-
Net exposure rose +2.6 handles in a single session (now 73% net), up from 65% net a month ago.
Funny how one month can change things so drastically.
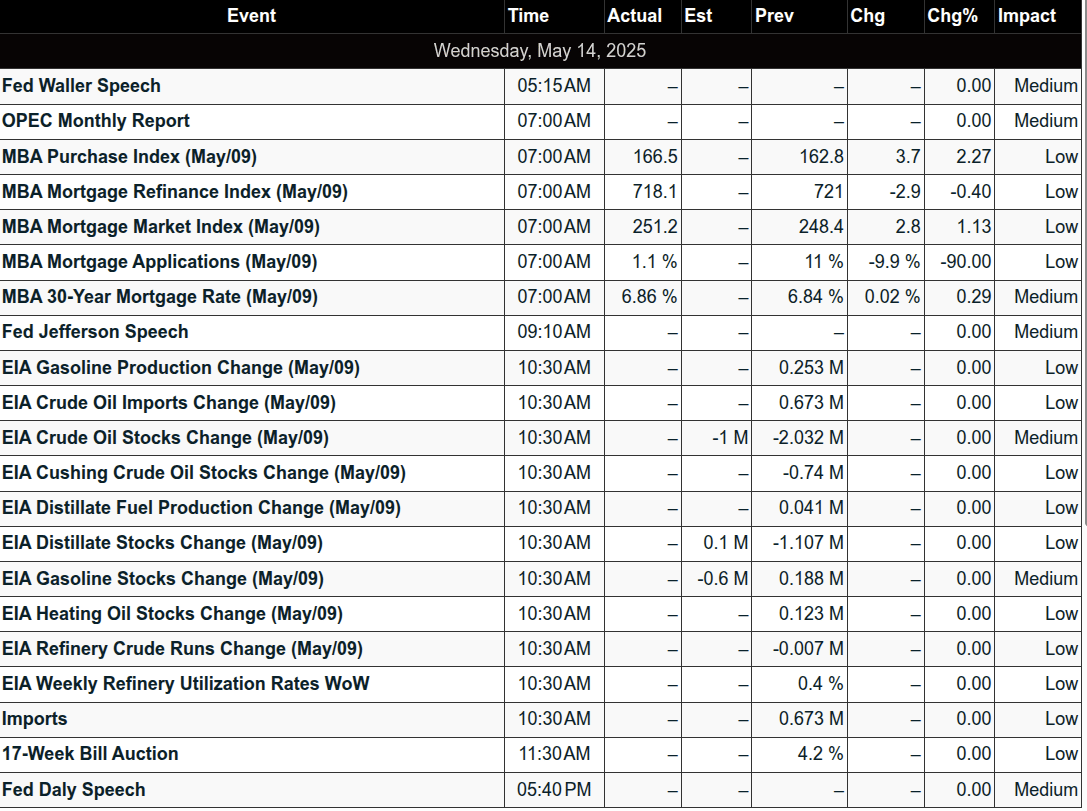
Today, there are no economic reports, but we do have three Fed speakers. I have to admit, I talk about higher prices, but I’ve been fighting it, and that has made for some very poor trading results. As they say, it’s much easier to write about the ES than to trade it.
That said, I told my chat the ES was not going back to 5,927.00, and late in the day it almost took out the high before breaking down to the 5,900.00 level. I still think we’re nearing some type of pullback high, and I also think today could end up being a down day.
Our lean: Buy the early pullback and sell the rallies. The ES has now been up 13 times and down 3 of the last 16 sessions.
Below is a story by SpotGamma that talks about the overload of call positions going into Friday’s May options expiration.
The last thing to consider here is Friday’s OPEX, which went from very call-heavy last week to immensely call-heavy after yesterday’s +3% rally.
I mean, +90% of Index (Nasdaq, Russell) value expiring is tied to calls?? This is as extreme as we can ever recall having seen it, and it suggests a lot of calls, and their related long stock hedges, are set to be removed.
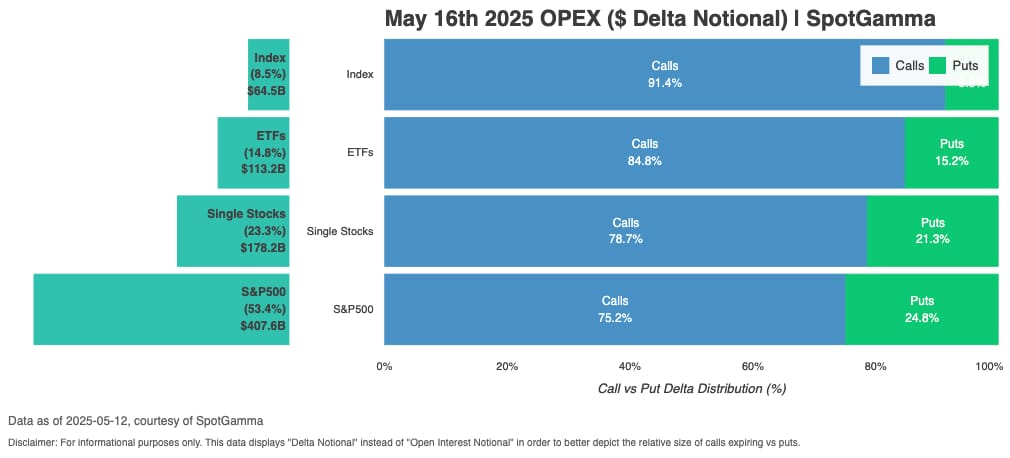
What takes a bit of this edge off is that it’s not a massive quarterly expiration, but it is still sizable, and we think leads to a market correction into next week.
MiM and Daily Recap

Tuesday’s session opened at 5869.75 following a quiet Globex range and an early low of 5835.75 at 23:39 ET. From the low at 7:36 ET, buyers steadily pushed the tape higher, igniting a morning rally that culminated in a sharp surge to 5915.50 by 10:15 AM. This marked a 66.55-point move off the 7:36 low, underscoring a clear shift in momentum to the upside.
A pullback emerged shortly after, with ES retracing to 5896.75 by 10:45 AM, shaving 18.75 points (-0.31%) off the morning high. This dip was brief, as the tape coiled and resumed its upward drive, tagging a new high of 5920.25 at 11:45 AM. That level, however, proved unsustainable. A sequence of lower highs followed, beginning with 5919.50 at 12:45 PM and leading into a fade to 5905.25 by 1:12 PM.
The afternoon brought renewed strength as the market rallied to the session high of 5927.00 at 1:30 PM, representing a 21.75-point recovery from the prior low. That thrust was met with two sharp sell programs. By 2:00 PM, ES had retraced to 5910.25, only to rebound back to 5919.25 at 2:18 PM.
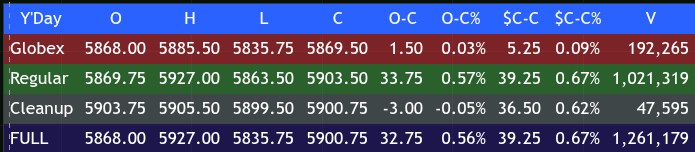
A final swing high at 5915.25 came at 3:01 PM, with follow-through stalling quickly. From there, the market drifted lower into the closing hour. A late drop to 5903.50 for the 4:00 PM close for the cash session. Open-to-close performance was a gain of 22.5 points or .57%. From the previous cash close, the ES was up 39.25 points or .67%.
Tuesday carried a bullish undertone, marked by firm Globex support and an aggressive bid through the regular session. The strongest impulse came in the first half of the day, with the majority of the gains locked in by 1:30 PM. The total volume for the session stood at 1.26 million contracts, with the regular session trading 1.02 million, suggesting healthy participation during the cash hours.
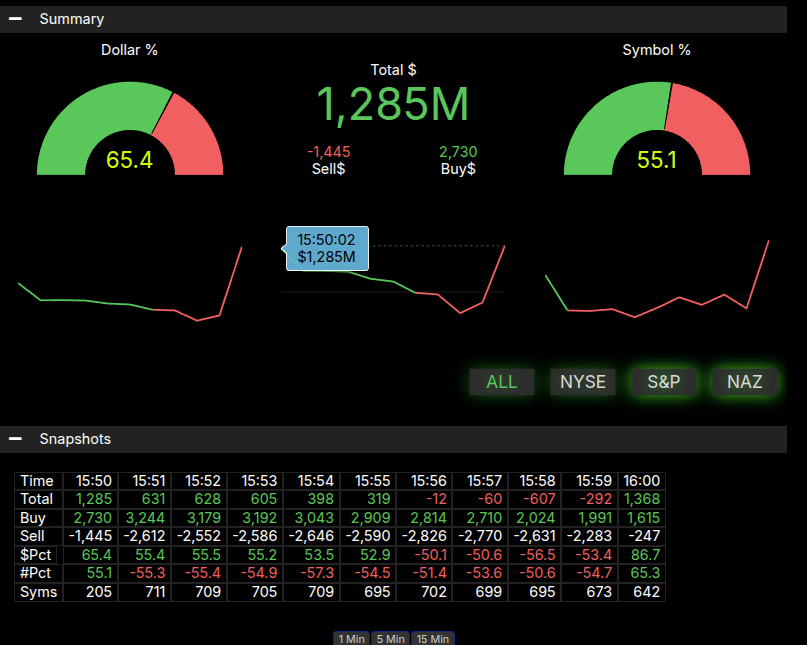
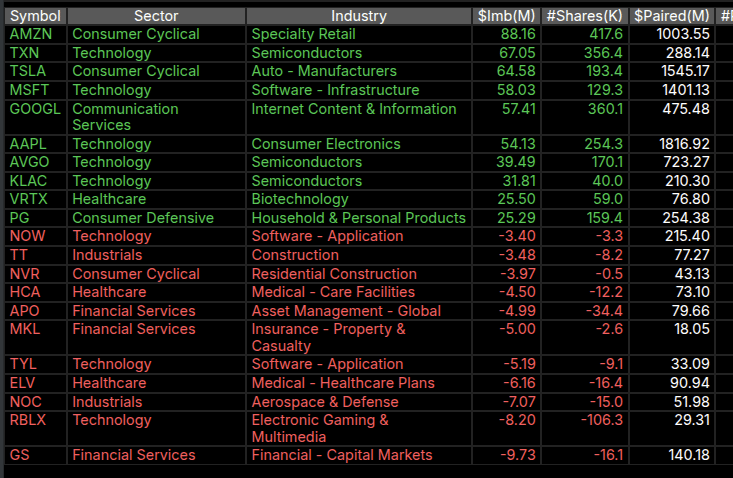
MOC data showed a total imbalance of $1.285B to buy at 3:50 PM, with 65.4% of notional flow skewed to the buy side. However, the symbol imbalance only reached 55.1%, falling short of the 66% threshold for strong directional signals. While this MOC strength did not generate a final push higher, it likely helped cushion the late pullback into the close.
In summary, the market continues to trend higher with minor afternoon exhaustion. Bulls remain in control, though fading momentum late in the session raises the potential for some early consolidation or digestion heading into Wednesday.
Technical Edge
Fair Values for May 14, 2025:
-
SP: 18.69
-
NQ: 79.29
-
Dow: 82.34
Daily Market Recap 📊
-
Tuesday, May 13, 2025
-
NYSE Breadth: 62% Upside Volume
-
Nasdaq Breadth: 65% Upside Volume
-
Total Breadth: 64% Upside Volume
-
NYSE Advance/Decline: 61% Advance
-
Nasdaq Advance/Decline: 58% Advance
-
Total Advance/Decline: 60% Advance
-
NYSE New Highs/New Lows: 77 / 29
-
Nasdaq New Highs/New Lows: 169 / 106
-
NYSE TRIN: 0.79
-
Nasdaq TRIN: 0.72
-
Weekly Market 📈
-
Week Ending Friday, May 9, 2025
-
NYSE Breadth: 54% Upside Volume
-
Nasdaq Breadth: 56% Upside Volume
-
Total Breadth: 55% Upside Volume
-
NYSE Advance/Decline: 58% Advance
-
Nasdaq Advance/Decline: 49% Advance
-
Total Advance/Decline: 53% Advance
-
NYSE New Highs/New Lows: 141 / 110
-
Nasdaq New Highs/New Lows: 256 / 303
-
NYSE TRIN: 0.91
-
Nasdaq TRIN: 0.86
-
Guest Posts — Polaris Trading Group
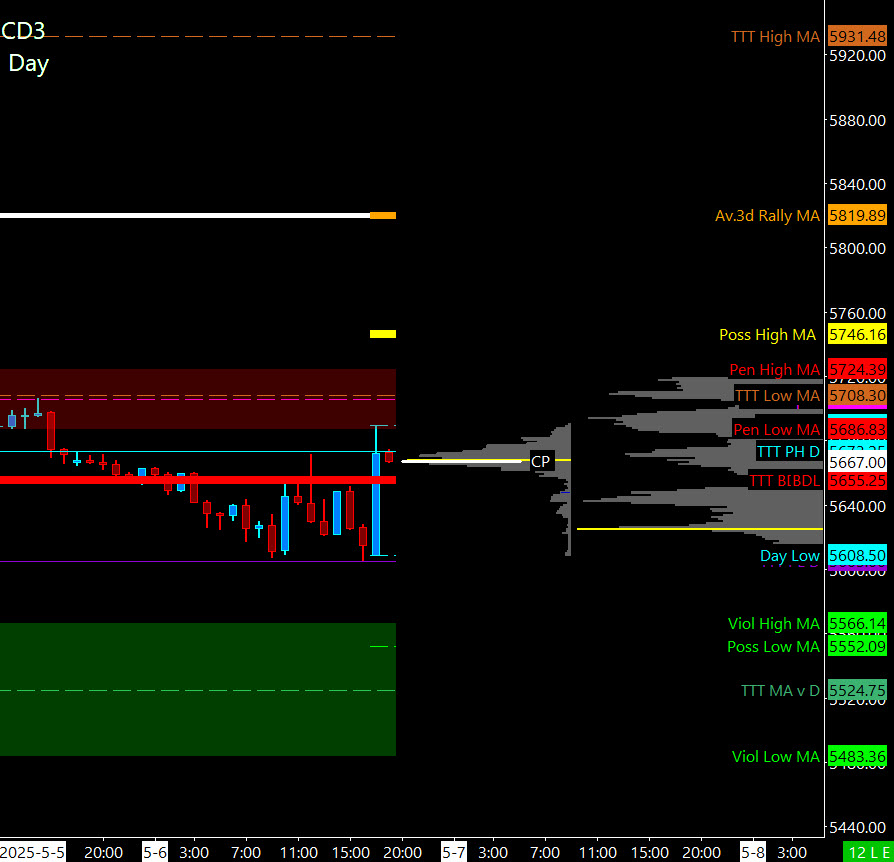
Prior Session was Cycle Day 1: Shallow pullback during overnight session established a new cycle low at 5835.75.
RTH opening held firm a bid as buyers remained dominant throughout the session fulfilling multiple upside objectives.
Rhythms were smooth and controlled as dips buyers held key symmetrical pullback support zones. Market on Close (MOC) buy imbalance was easily absorbed as end-of-day position squaring had price retreat into the closing bell.
Range for this session was 91 handles on 1.261M contracts exchanged.
For a more detailed recap of the trading session, click on this link: Trading Room RECAP 5.13.25
FREE TRIAL link to PTG/Taylor Three Day Cycle
…Transition from Cycle Day 1 to Cycle Day 2
Transition into Cycle Day 2: Typically for CD2 we would be anticipating MATD trading range rhythms to consolidate prior two-day rally.
Price is currently on a solid two-week rally win-streak having retraced 75% of the Liberation Day announcement.
Levels to be mindful on a retracement lower would be but not limited to: 5880…5870…5855…5835.
Stay flexible and always adjust to the current market intra-day rhythm.
Of course, nothing changes for PTG…Simply follow your plan. Take only Triple A setups and manage the $risk. ALWAYS HAVE HARD STOP-LOSSES in-place on the exchange.
PTG’s Primary Directive (PD) is to ALWAYS STAY IN ALIGNMENT with the DOMINANT FORCE.
As such, scenarios to consider for today’s trading.
Bull Scenario: Price sustains a bid above 5895+-, initially targets 5915 – 5925 zone.
Bear Scenario: Price sustains an offer below 5895+-, initially targets 5880 – 5870 zone.
PVA High Edge = 5920 PVA Low Edge = 5895 Prior POC = 5905
ESM
Thanks for reading, PTGDavid
Trading Room Summaries
Polaris Trading Group Summary – Tuesday, May 13, 2025
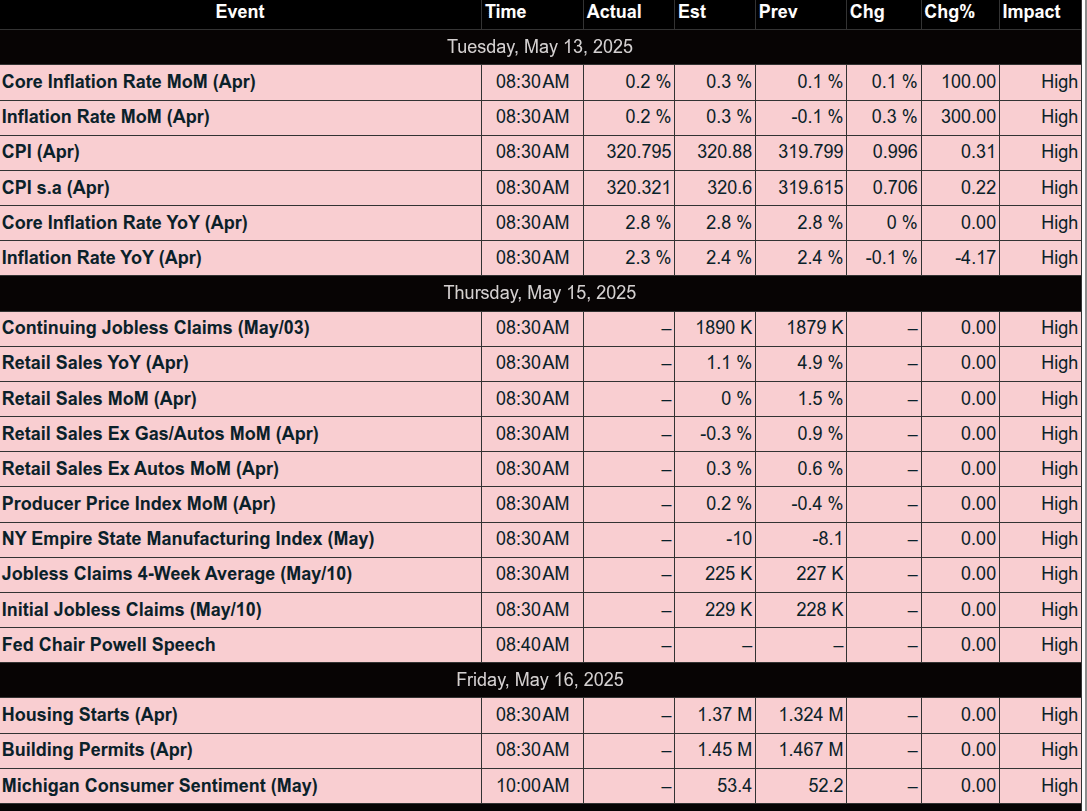
Tuesday was a Cycle Day 1 and a strong bullish session fueled early on by favorable CPI data, which sparked a sharp move higher and sustained buying through the morning session. The trading day delivered several quality opportunities and reinforced key technical lessons.
Economic Catalyst: CPI Report
-
Core CPI YoY came in as expected at 2.8%
-
Headline CPI YoY and MoM both slightly under expectations
-
Result: Market rallied on growing anticipation of Fed rate cuts (Sept & Oct)
Morning Session Highlights
-
Bullish Price Spike immediately followed CPI release (8:30 AM ET)
-
Initial targets hit quickly:
-
ES reached 5875 and later 5895 per DTS Briefing
-
NQ surged to its Call Wall and R1 levels, fulfilling 21080 zone
-
-
Multiple successful setups:
-
A4 Longs: TGT1 and TGT2 filled
-
NQ Open Range Long: TGT1 and TGT2 filled
-
@ES Discount Longs achieved targets
-
-
Strong bullish grind rhythm led the morning pace
-
PTGDavid emphasized importance of staying with the trend and avoiding cognitive dissonance (i.e., shorting into strength)
Key Lessons & Commentary
-
“Why the f*** am I short?” became a comical reminder not to fight the tape
-
Emphasis on trading with structural support and not worrying about higher highs in an uptrend
-
Strong visuals and reinforcement of the OODA Loop Matrix Bias Grid and D-Level Money Box
Midday & Afternoon
-
Lunch update: Price consolidating above 5900 – bulls still in control
-
Afternoon described as “chop”, but dips continued to get bid
-
Final push into Power Hour with buyers maintaining control
-
Closing action:
-
MOC rotation into VWAP
-
Day ended with a nod to the bulls: “Well Played Bulls”
-
Summary
-
Productive morning with clean execution on multiple setups
-
The day was a lesson in trend discipline — staying long in a rising market
-
Market rewarded traders who respected structure and followed the “grind rhythm”
Quote of the Day:
“In an uptrend, supports are the most important… not whether new highs are made.” – PTGDavid
Discovery Trading Group Room Preview – Wednesday, May 14, 2025
-
CPI & Tariffs: April CPI data showed no immediate inflation spike from recent Trump tariffs, suggesting pre-emptive inventory building by importers. However, inflationary pressures are looming. Moody’s expects YoY inflation to reach 3.8%, with specific sectors like leather goods and electronics facing potential 14–15% price hikes. Rates likely to stay elevated despite political pressure.
-
Earnings & Tech News: Nvidia shares jumped after announcing a major chip shipment to an AI startup. Foxconn, Nvidia’s AI server partner and Apple supplier, reported a 91% profit increase and 24.2% revenue growth. It plans to expand into EVs—a segment also supported by Nvidia chips.
-
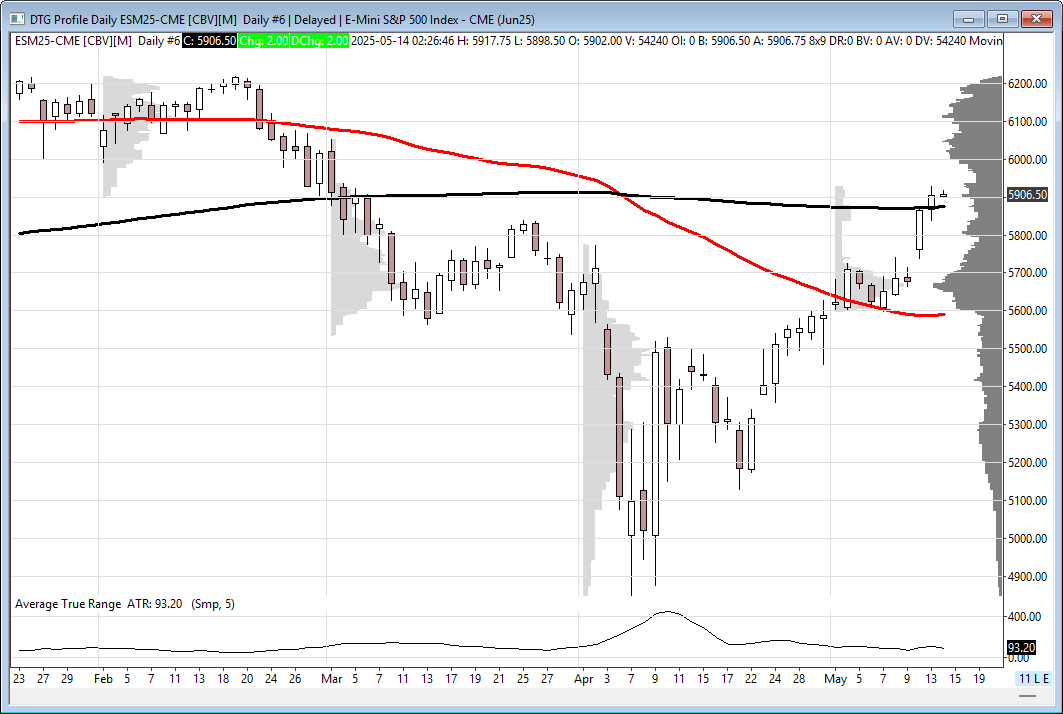
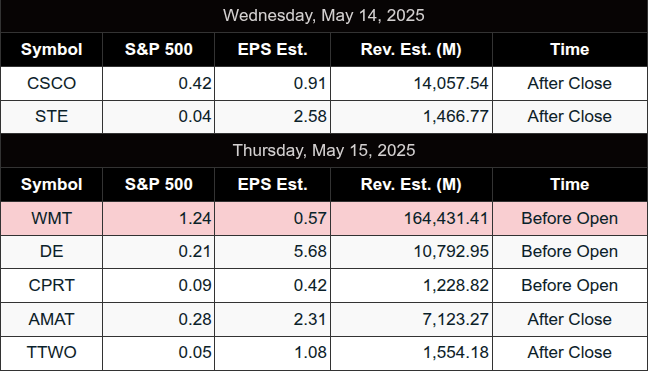
Market & Macro: Volatility remains elevated with the ES averaging 108-point daily ranges. However, a bullish grind could compress this. ES held its 200-day MA at 5874 as support. Whale positioning is bullish heading into the US open. Key earnings today include Cisco, EBR, STN, and STE. Crude Oil Inventories drop at 10:30am ET. Fed speakers: Waller (5:15am) and Jefferson (9:10am).
ES
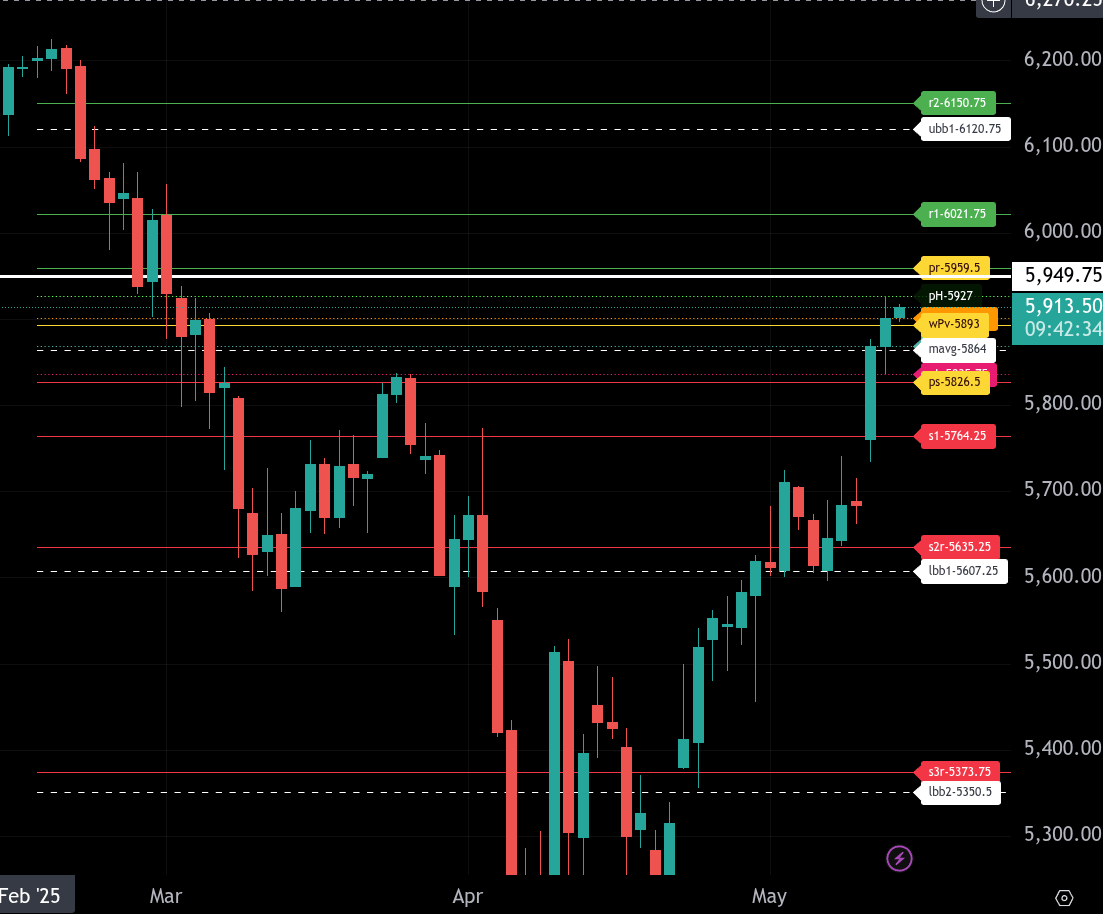
The bull/bear line for the ES is at 5893.00. This is the key pivot level that defines sentiment for today. A move and hold above it favors bullish continuation, while rejection below it could lead to renewed selling pressure.
Currently, ES is trading around 5912.75 in the Globex session, showing strength above the bull/bear line. The market has cleared the prior close at 5900.75 and is also pressing against the previous high at 5927.00. A sustained move above 5927.00 could open the door to further upside.
The upper range target for today is 5959.50. This is the next key resistance level to watch if ES can break through 5927. Beyond that, 6021.75 marks a more extended resistance level, though it is less likely to be tested without a strong catalyst.
On the downside, initial support sits at the prior close (5900.75) and the bull/bear line at 5893. Below this, the lower range target is 5826.50. If selling accelerates, deeper support lies at 5764.25.
Overall, the trend favors buyers as long as ES remains above 5893. A break below this level would shift focus toward the downside targets. Hold above, and bulls may look to push toward the upper range and beyond.
NQ
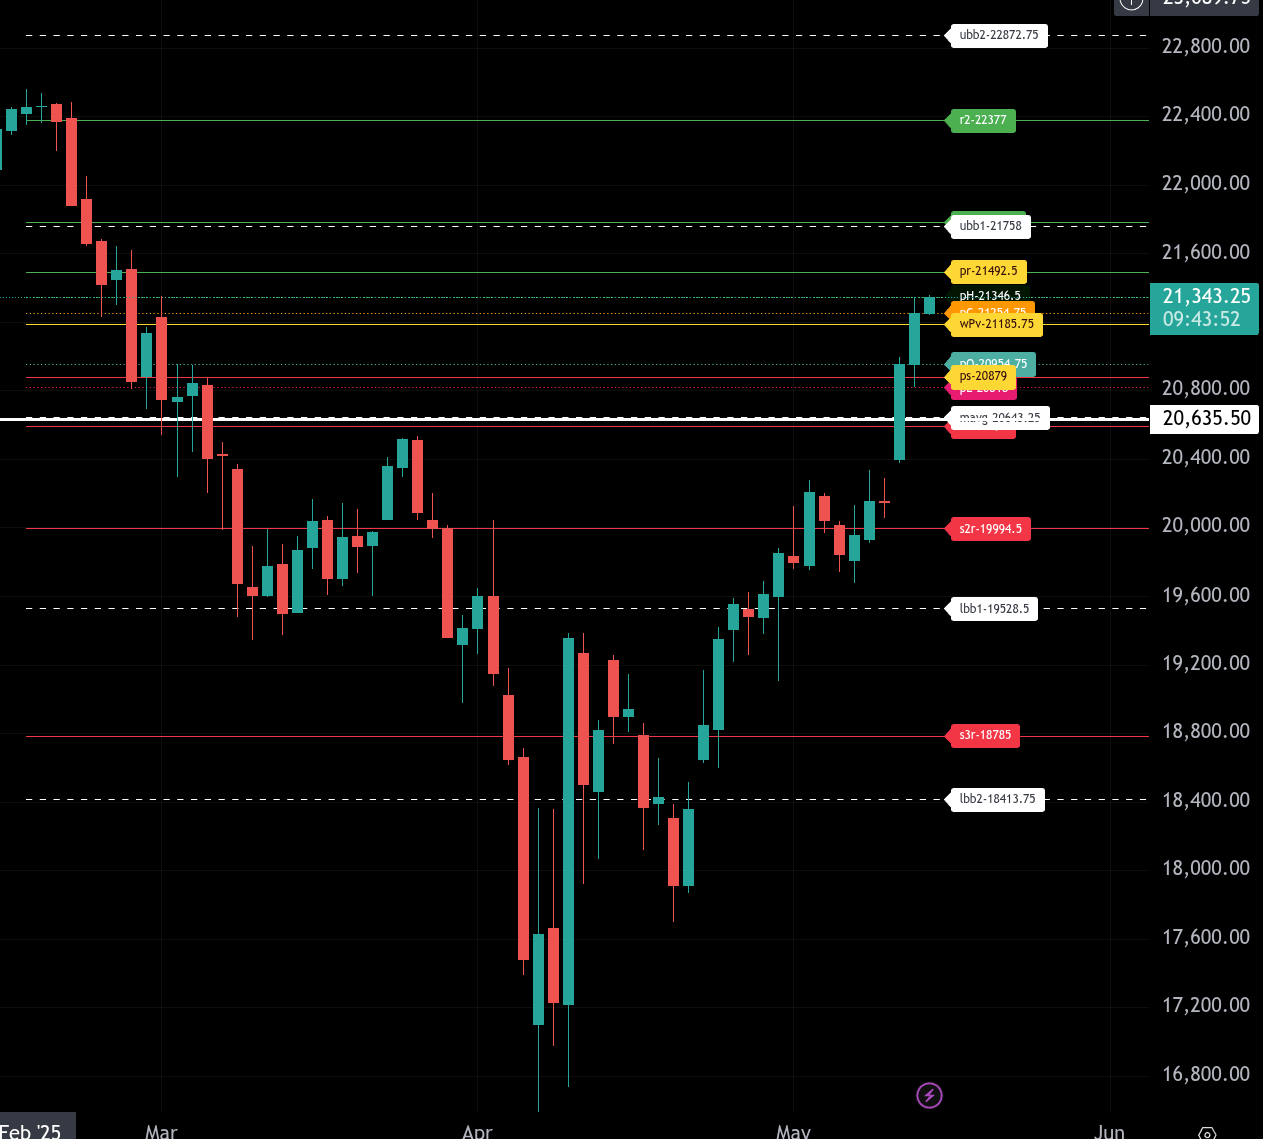
The bull/bear line for NQ is at 21,185.70. Price is currently trading well above this level at 21,342.00, indicating bullish momentum going into the regular session. As long as NQ remains above 21,185.70, intraday dips may find buyers.
The upper range target for today is 21,492.50. If bulls can maintain control above the overnight high at 21,346.50 and break through resistance near 21,492.50, the next major resistance level is 21,784.50, followed by a stretch target up near 22,377.00.
The lower range target is 20,879.00. Should NQ break back below the bull/bear line and lose support at 21,000.00, we could see a test of this level. Further downside pressure opens the door to 20,818.00 and 20,590.00 as additional support levels.
Above the current price, resistance levels to watch are 21,492.50 and 21,784.50. Below, support levels are stacked at 21,254.80 (prior close), 21,185.70 (bull/bear line), and 20,954.80 (pivot open).
Trend remains bullish above 21,185.70. Watch price action closely near 21,492.50 for continuation or potential rejection.
Calendars
Economic Calendar
Today
Important Upcoming
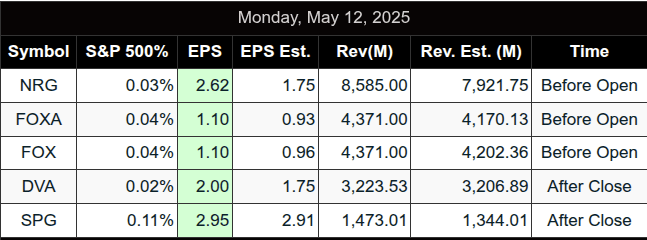
Earnings
Affiliate Disclosure: This newsletter may contain affiliate links, which means we may earn a commission if you click through and make a purchase. This comes at no additional cost to you and helps us continue providing valuable content. We only recommend products or services we genuinely believe in. Thank you for your support!
Disclaimer: Charts and analysis are for discussion and education purposes only. I am not a financial advisor, do not give financial advice and am not recommending the buying or selling of any security.
Remember: Not all setups will trigger. Not all setups will be profitable. Not all setups should be taken. These are simply the setups that I have put together for years on my own and what I watch as part of my own “game plan” coming into each day. Good luck!
This post goes out as an email to our subscribers every day and is posted for free here around 2 PM ET. To get your real-time copy, sign up for the free or premium version here: Opening Print Subscribe.
Comments are closed