This post goes out as an email to our subscribers every day and is posted for free here around 2 PM ET. To get your real-time copy, sign up for the free or premium version here: Opening Print Subscribe.
War in the Middle East: Unpacking the Impact on Oil, Markets, and US Strategy
Follow @MrTopStep on Twitter and please share if you find our work valuable!
Our View
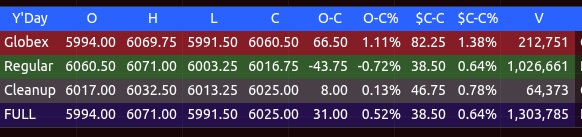
The ES opened the Thursday Globex session at 5924.00, traded 5991.50, and then rallied all the way up to 6069.75, up 1.38%. It traded at 6060.50 on the regular session open, up 1.36%. After the open, the ES sold off down to the 6010.00 level and made a series of lower highs, trading down to 6003.25 around 12:30. It traded back up to the 6035 area, then dropped to 6016.75 on the 4:00 cash close, and settled at 6018.00, up 16.25 points from the prior day’s close.
In the end, it was a long day of chop. In terms of the ES’s overall tone, it was a case of failed rallies. In terms of the ES’s overall trade, volume was on the higher side, with a total of 1.63 million contracts traded across both sessions.
After all the crazy Covid-19 pandemic news coverage, I decided less was more, and I still feel that way. But I got up early Saturday, turned on the boob-tube a little after 6:30, and started flipping channels. That’s when I saw the CNN headline: the US had attacked Iran’s nuclear sites.
I have to be honest, I didn’t think Trump would do it, mainly because the US and Iran were still negotiating the nuclear disarmament agreement. But then I thought about how long this has really been going on. I was 21 years old when Iranian students overran the US Embassy in Tehran and took 66 Americans hostage, 52 of them were held for 444 days. Tensions between the US and Iran go all the way back to 1953 with the CIA-led coup against Mossadeq.
I read something that said the US was one of the safest countries in the world before Biden’s open border policy. I always thought the number of people crossing the US–Mexico border was larger than publicly reported. It was initially said to be 12 to 13 million, but the real number is closer to 18 million. While these numbers might not be exact, I think they’re a good example of what the US is up against on its own turf.
Roughly 240,000 Middle Eastern people entered the US as lawful permanent residents during Biden’s administration from 2021 to 2025. Between 2021 and 2024, CBP recorded at least 33,000 illegal border encounters involving migrants from Turkey, Tajikistan, and several other Middle Eastern and near-Middle Eastern nations, including Iran, Iraq, Syria, and Yemen. From October 2020 to mid‑2024, CBP also recorded about 140,000–150,000 encounters involving Chinese nationals, with major spikes in FY 2023 and early FY 2024, driven by record-high southern border crossings.
I’d said before I didn’t think Trump would risk attacking Iran because of the sleeper cells. After the bombing, Iran responded with strong condemnation. A top Iranian diplomat called the strike illegal under international law, and Tehran called for an emergency UN session. The state broadcaster warned that every American is now a “legitimate target” and threatened “everlasting consequences.”
Iran has one of the largest militaries in the Middle East. The country of 92.4 million has 610,000 active-duty troops spread across its conventional forces and IRGC units. It also has 350,000 reservists and 220,000 paramilitary forces — a total standing force of 960,000, not including the Basij (a paramilitary volunteer organization) or police forces. Iran’s military is by no means a pushover.
Remember last week when I wrote about Gulf Wars I and II? The comparisons aren’t perfect, but here’s what the S&P 500 did:
Gulf War 1
📉 S&P 500 Decline — Pre-War Shock (1990)
Peak: July 16, 1990 — S&P 500 at ~369
Low: October 11, 1990 — S&P 500 at ~295
➡️ Decline:
-74 points, or −20.1%
Technically a bear market
The drop was driven by:
Iraq’s invasion of Kuwait (August 2, 1990)
Fears of oil supply shocks, recession, and geopolitical risk
📈 S&P 500 Rally — War Phase (1991)
War began: January 17, 1991 (Operation Desert Storm air campaign)
Rally start: Already underway before the war; markets anticipated a short war
Feb 1991 (War ends): S&P ~380+
➡️ From the October 1990 low (~295) to:
Feb 1991 peak (~380)
= +85 points, or +29%
Gulf War ll
📉 Pre-War Decline (Bear Market Bottom)
High before war concerns: ~1,176 in early January 2002
Low: March 11, 2003 — S&P 500 at 800.73
This decline wasn’t solely due to war fears—it was part of the broader dot-com bust and corporate scandals (e.g., Enron, WorldCom).
➡️ From Jan 2002 to Mar 2003:
Decline of ~375 points
−32% from ~1,176 to ~801
📈 War Rally (March–End 2003)
War began: March 20, 2003 (U.S.-led invasion of Iraq)
S&P 500 low: March 11, 2003 — 800.73
End of 2003: S&P 500 closed at 1,111.92
➡️ Rally:
+311 points, or +39% from the March low to year-end
Again, in both cases, there was a big rally after the low.
On Sunday morning, Turkey’s foreign minister made clear there would be no negotiations until Iran retaliates, and he was leaving to meet with Putin. I’m not smart enough to know how this ends, but it’s obvious how stretched the US already is.
When the Trump administration shifted military assets from Asia back into the Middle East, China harassed a British warship, while Israel and Iran were already clashing. At the St. Petersburg International Economic Forum on June 20, Putin explicitly stated: “The whole of Ukraine is ours.” I think this is the biggest moment of the Trump presidency so far — and the ripple effect is just starting.
This is a serious situation that will cause a lot of uncertainty—everything from closing the Strait of Hormuz, to attacking US bases in the Middle East, to a possible terror attack in the US. Wars the US gets involved in last months and years, not two weeks. More carnage is on the way.
The Week Ahead: Economic Reports, Fed Speak, and Auctions
Monday, June 23
-
Flash Services & Manufacturing PMI (9:45 AM)
-
Treasury: 13-Week ($70B), 26-Week ($60B) Bills (11:30 AM), 2-Year FRN (~$25B, 1:00 PM)
-
Fed: Gov. Michelle Bowman speaks (10:00 PM)
Tuesday, June 24
-
Existing Home Sales, CB Consumer Confidence, Richmond Fed Index (10:00 AM)
-
Treasury: 2-Year ($65B), 5-Year ($65B), 7-Year (~$40B) Notes (1:00 PM)
-
Fed: Powell testifies to House Financial Services (10:00 AM)
Wednesday, June 25
-
New Home Sales (10:00 AM), EIA Petroleum Status (10:30 AM)
-
17-Week T-Bill (~$30B, 11:30 AM)
-
Fed: Powell testifies again (10:00 AM)
Thursday, June 26
-
Jobless Claims, Final Q1 GDP, Durable Goods Orders (8:30 AM), Pending Home Sales (10:00 AM)
-
Treasury: 4-Week & 8-Week Bills ($50B each), 4-Year TIPS (~$15B, 1:00 PM)
Friday, June 27
-
PCE Price Index, Personal Income & Spending (8:30 AM), UMich Sentiment Final (10:00 AM), Fed Stress Test Results (4:30 PM)
-
No Fed speakers or Treasury auctions
Oil
Global equity markets have lost nearly $10 trillion in 2025 due to Trump’s tariff policies and escalating geopolitical risk. The DAX is up 19.17%, while the S&P is only +0.50% YTD.
So far, the Israel–Iran conflict hasn’t moved the S&P much — it’s down a few percent in the last two weeks and only 3% off its all-time high of 6147 from February.
Oil is up 11%, to $77.00 a barrel. Morgan Stanley analysts say a quick resolution could push prices back to the $60s, but continued tension could leave oil in the current range. “Fundamental disruptions to the global supply of oil with a possible hit to shipments through the region would push oil prices a lot higher from here,” they said. I don’t know when Iran is going to hit back, but I think it’s going to be big and ugly, and will that drag the US back into the conflict?
I think the days of the S&P overlooking the Israel/Iran war are over now that the U.S. has stepped in. While I feel confident Iran was working its way toward building the nuke—or nukes—this is exactly the setup I was talking about: the first war the U.S. enters would be in the Middle East, with Iran.
This totally shifts the U.S.’s attention away from Taiwan and Ukraine while lowering U.S. military stockpiles, which in itself could lead to a major conflict. When the U.S. pulled out of the Middle East, Russia stepped in but lost influence, and then China stepped up its game.
So far in 2025, Iran has sold China an average of 1.3 to 1.5 million bpd of crude oil each month, with a peak of 1.8 million bpd in March, dropping to 1.3 million bpd in April and 1.1 million bpd in May due to U.S. sanctions. This represents 80–90% of Iran’s oil exports, generating roughly $1 to $2 billion/month in revenue, down from $3.83 billion/month in mid-2024.
China’s teapot refineries drive demand, supported by discounts and sanctions evasion, but U.S. pressure and potential Strait of Hormuz risks threaten flows. China and Iran are strategic partners, with a relationship rooted in economic, geopolitical, and energy cooperation.
Our Lean
I had this feeling something was out of whack—and here we are. My hope is that Iran takes its shot and that cooler heads can prevail, and the fighting will stop. But if it doesn’t, and things start to really deteriorate, you can expect U.S. boots on the ground. This would not be a very market-supportive event.
The PitBull said one scary part of the stock market is “there are a lot of high-priced stocks with no earnings value,” and if the markets really start to fall, that will be a weak spot.
Our lean: The ES opened Sunday night’s Globex session at 5964, printed 6059.00, and traded all the way down to 6026.75, and was holding around the 5990 level when I wrote this. The ES had a nice bounce, but keep in mind—Israel and Iran attacked each other overnight.
You can pile in all the support and resistance levels, but I’m using 6000.00 as a swing level, with 5975, 5950, 5930, 5910, 5900–5890 as downside levels. If the ES gaps down hard on the open, I would look to buy the early weakness and sell the 40 to 60-point rips.
The markets will remain on edge and prone to headline news.
MiM and Daily Recap
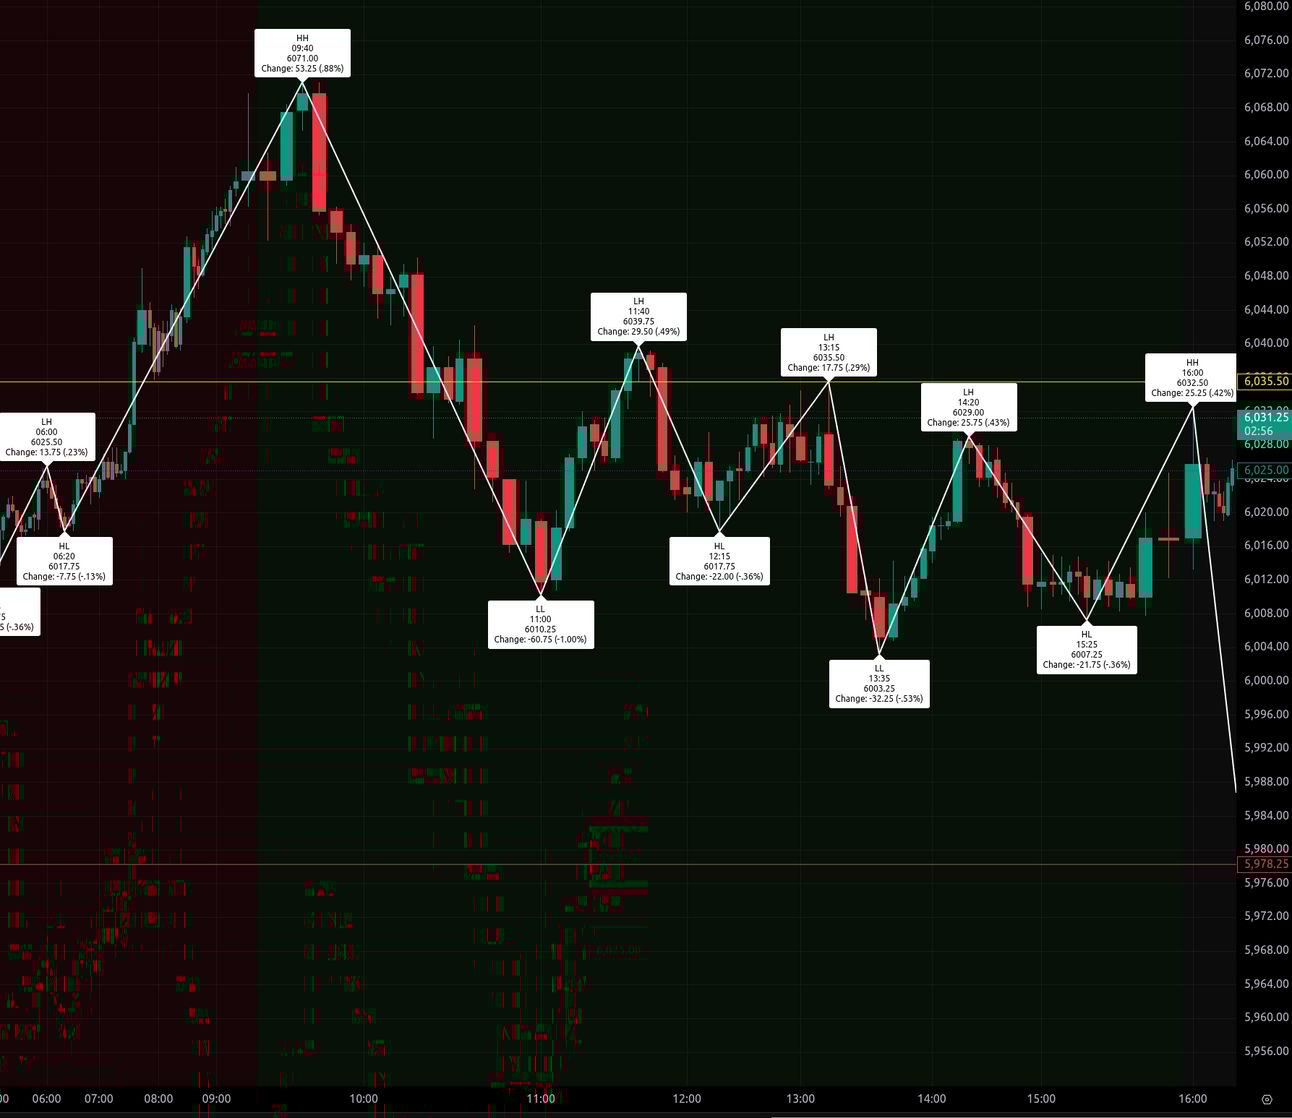
The market opened Thursday’s overnight Globex session at 5994 and then worked its way up to 6033 by 4 AM. Around 6:20 AM, the market found more upside momentum and prices drove higher from around 6012 up to the day’s high of 6071, just 10 minutes past the cash open.
Upon the open of the regular session at 9:30 AM, sellers took control by 9:40 AM, driving the ES down sharply to a low of 6010.25 by 11:00 AM, shedding 60.75 points from the overnight high. A subsequent bounce occurred, with the ES reaching 6039.25 by 11:40 AM, recovering 29.00 points. This recovery was short-lived, as the market pulled back to 6017.25 at 12:15 PM, a decrease of 22.00 points.
The afternoon saw the ES making another attempt at a rally, rising to 6035.50 by 1:15 PM, marking a 17.25-point gain from the earlier low. However, the upward momentum faded, and the ES retreated to a new intraday low of 6003.25 at 1:35 PM, a decline of 32.25 points. From this low, the ES rebounded to 6029.00 by 2:20 PM, a 25.25-point increase. A final dip to 6007.25 occurred at 3:25 PM, a 21.75-point drop, before a strong close. The regular session settled at 6016.75, showing a decline of 43.75 points from the open to close.
The market concluded the full session at 6025.00. From the previous day’s close, the ES saw an increase of 31.00 points, or 0.52%. Looking at the cash session specifically, the change from the prior cash close to Friday’s cash close was an increase of 38.50 points, or 0.64%.
Overall, the day’s sentiment appeared mixed with strong initial gains in the Globex session, followed by a significant decline and choppy action during the regular session, indicating a struggle between buyers and sellers. However, the full session ultimately showed a positive change from the prior day’s close. Volume remained robust throughout the day.
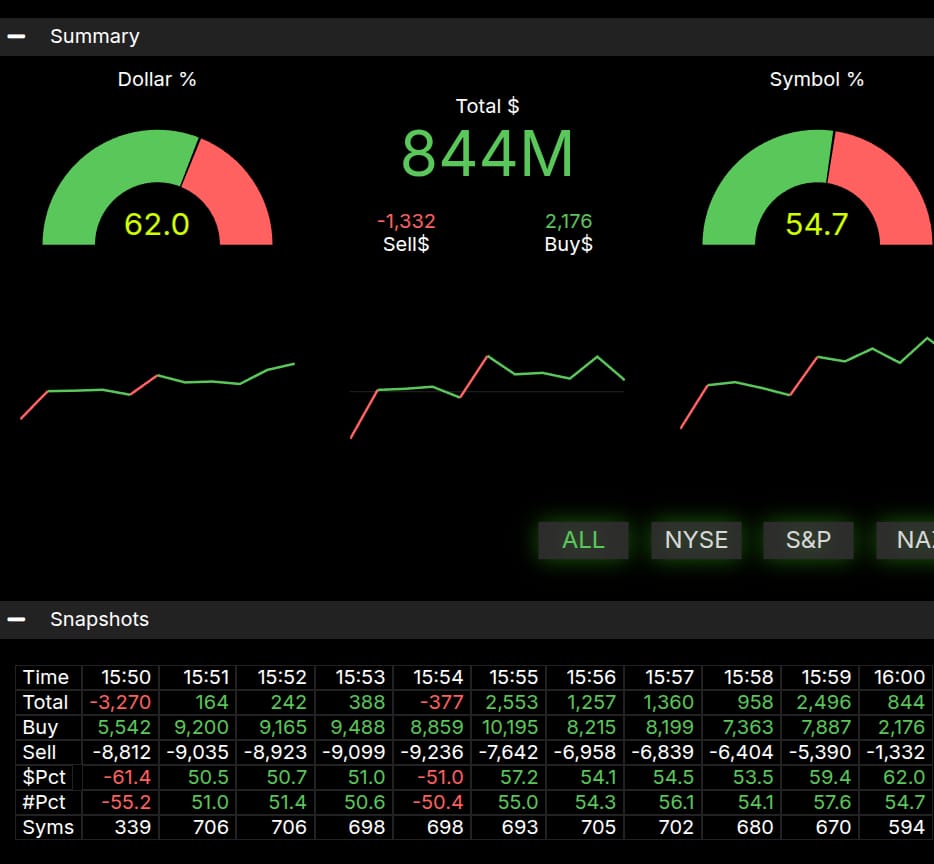
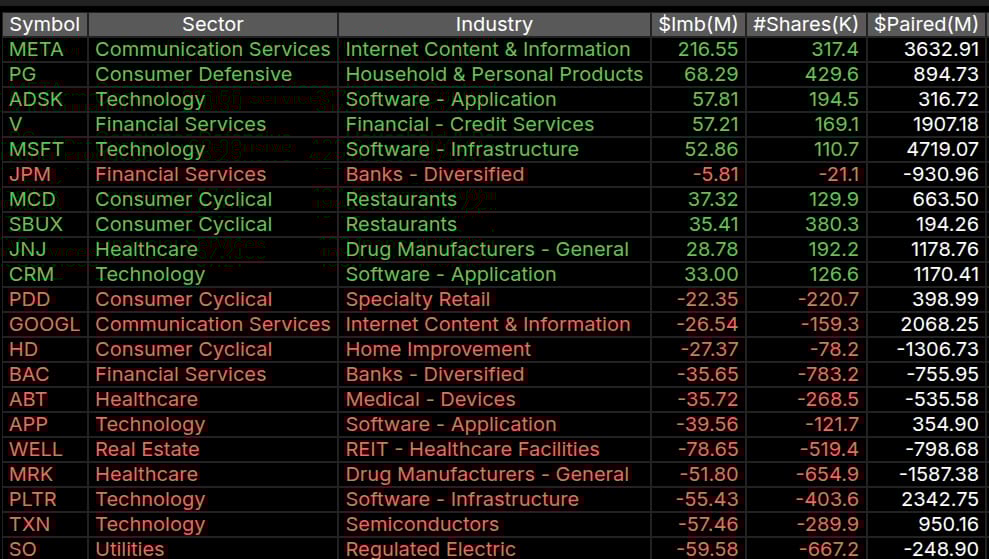
The Market-on-Close (MOC) data indicated a total imbalance of $844 million. The dollar percentage showed 62.0% on the buy side, while the symbol percentage was 54.7% favoring buys. Although there was a buy imbalance, it did not cross the 66% threshold for a notably strong buy signal. This suggests that while there was more buying interest at the close, it was not an overwhelming force that significantly pushed prices higher into the final print.
Technical Edge
Fair Values for June 23, 2025:
-
SP: 50.41
-
NQ: 214.2
-
Dow: 301.03
Daily Breadth Data 📊
For Friday, June 20, 2025
-
NYSE Breadth: 49.3% Upside Volume
-
Nasdaq Breadth: 43.0% Upside Volume
-
Total Breadth: 43.4% Upside Volume
-
NYSE Advance/Decline: 49.5% Advance
-
Nasdaq Advance/Decline: 41.9% Advance
-
Total Advance/Decline: 45.9% Advance
-
NYSE New Highs/New Lows: 56 / 43
-
Nasdaq New Highs/New Lows: 144 / 112
-
NYSE TRIN: 1.06
-
Nasdaq TRIN: 0.94
Weekly Breadth Data 📈
For the Week Ending June 20, 2025
-
NYSE Breadth: 48.2% Upside Volume
-
Nasdaq Breadth: 56.8% Upside Volume
-
Total Breadth: 53.6% Upside Volume
-
NYSE Advance/Decline: 49.0% Advance
-
Nasdaq Advance/Decline: 48.4% Advance
-
Total Advance/Decline: 48.7% Advance
-
NYSE New Highs/New Lows: 137 / 106
-
Nasdaq New Highs/New Lows: 327 / 266
-
NYSE TRIN: 1.06
-
Nasdaq TRIN: 0.70
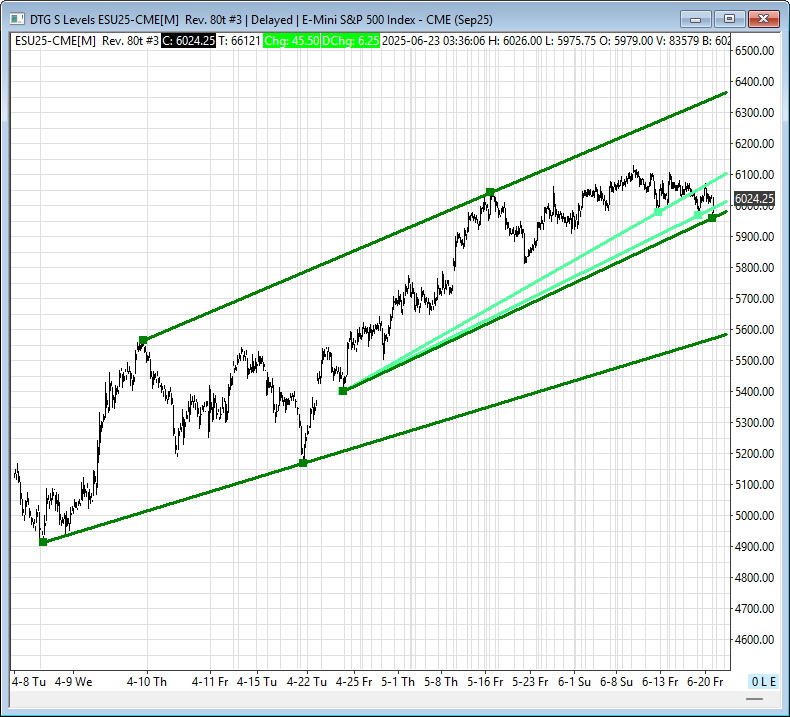
Today’s Levels:
ES
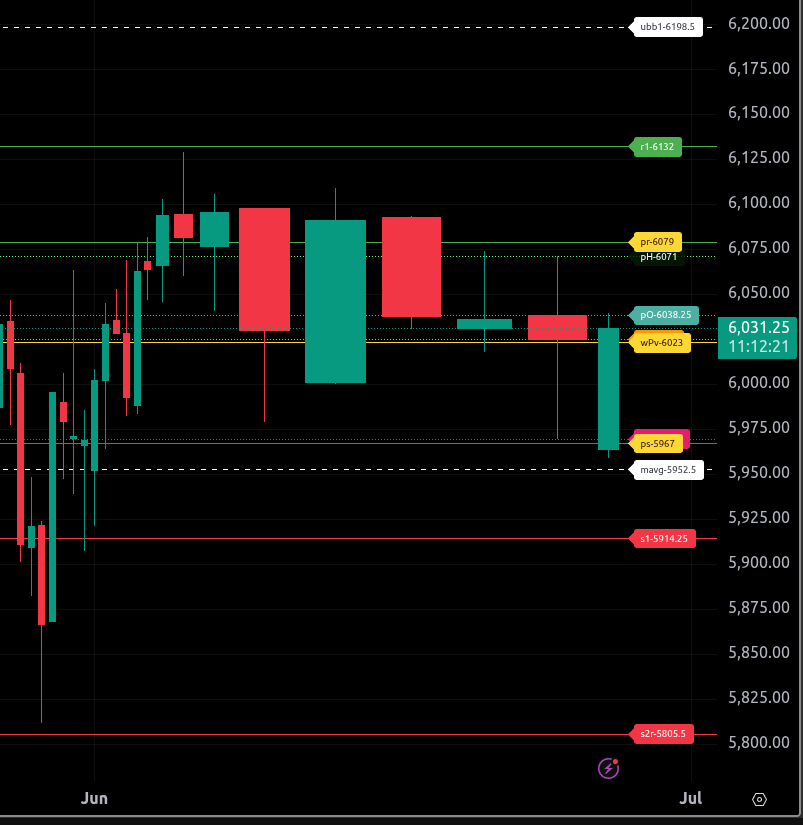
The bull/bear line for the ES is at 6023.00. This is the key level that must be reclaimed for bullish momentum to resume. Above this level, we look for potential buying opportunities on dips.
Currently, ES is trading around 6031.75, indicating strength above the bull/bear line. If the price remains above this level, expect further upside pressure, targeting 6079.00, our upper range target for today, and then 6132.00.
On the downside, support comes in at 5967.00, our lower range target, and then at 5914.25. If ES can’t hold 6023.00 and above, a test of these support levels is likely. Bears need sustained strength below 5967.00 to confirm a potential reversal.
Overall, the trend remains bullish above 6023.00, and bullishness is warranted until this level is lost. The longer-term bull/bear line has remained stable.
NQ
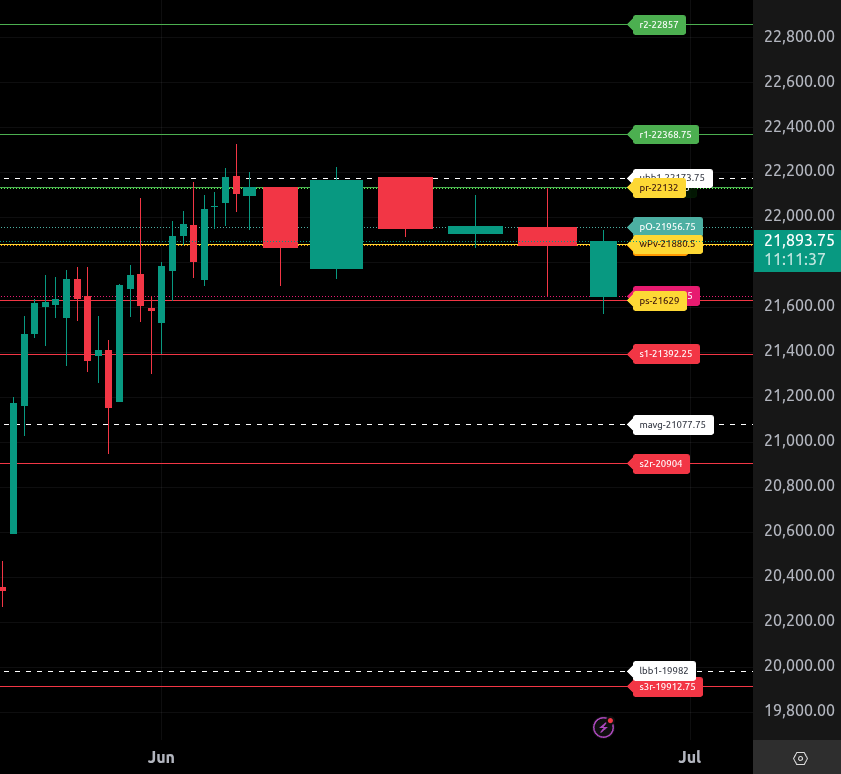
The bull/bear line for the NQ is at 21,880.50. This is the key level that must be reclaimed for bullish momentum to resume. Above this level, we look for potential buying opportunities on dips.
Currently, NQ is trading around 21,892.00, indicating strength above the bull/bear line. If the price remains above this level, expect further upside pressure, targeting 22,132.00, our upper range target for today, and then 22,368.75.
On the downside, support comes in at 21,629.00, our lower range target, and then at 21,392.25. If NQ can not reclaim 21,880.50 and hold above, a test of these support levels is likely.
Overall, the trend remains bullish above 21,880.50, and bullishness is warranted until this level is lost. The longer-term bull/bear line has remained stable.
Calendars
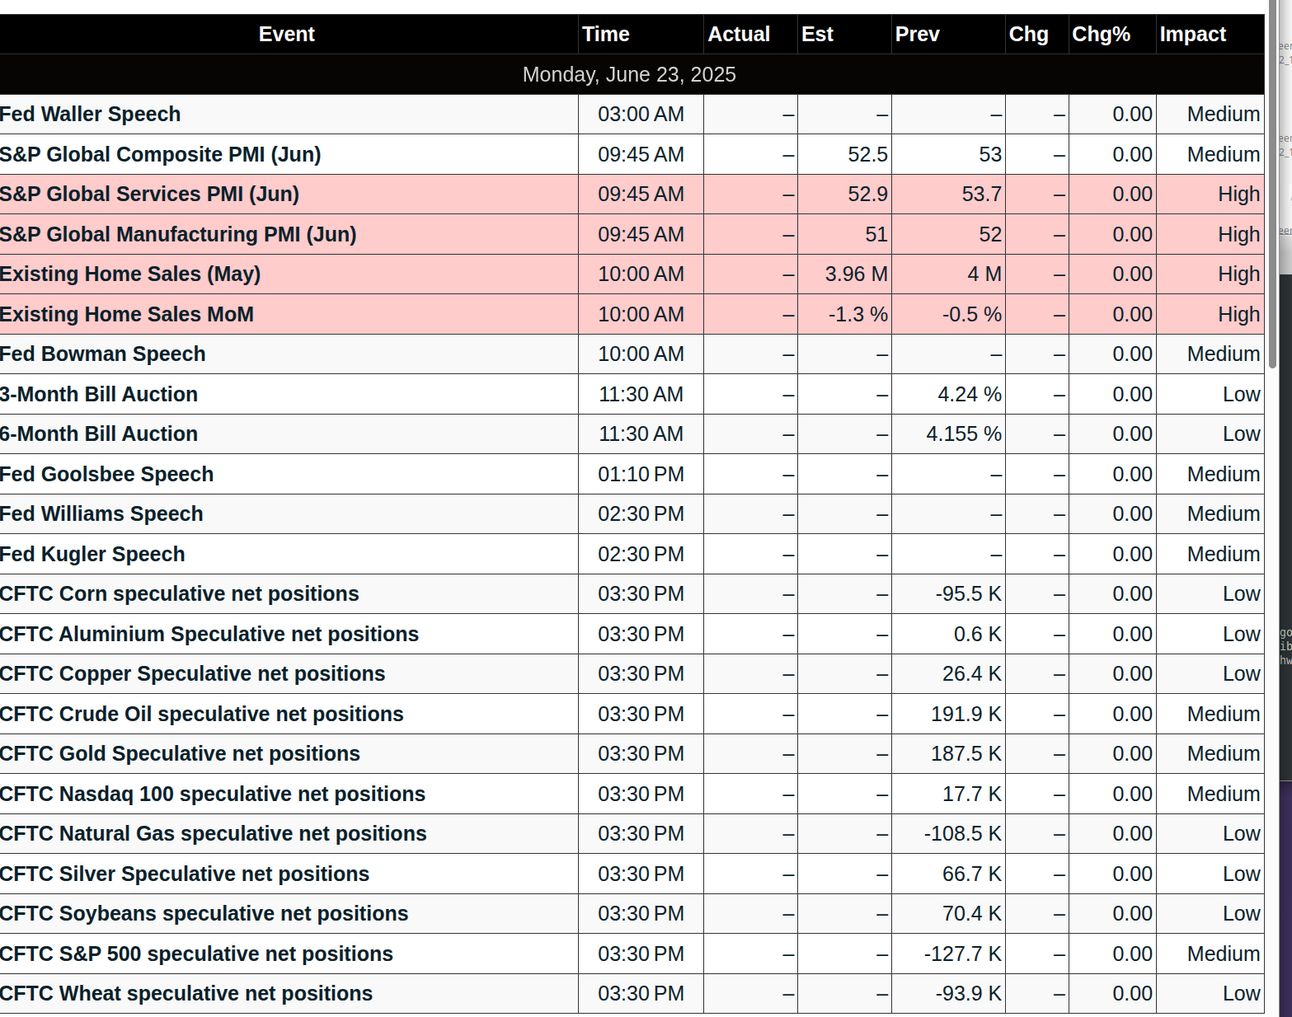
Today’s Economic Calendar
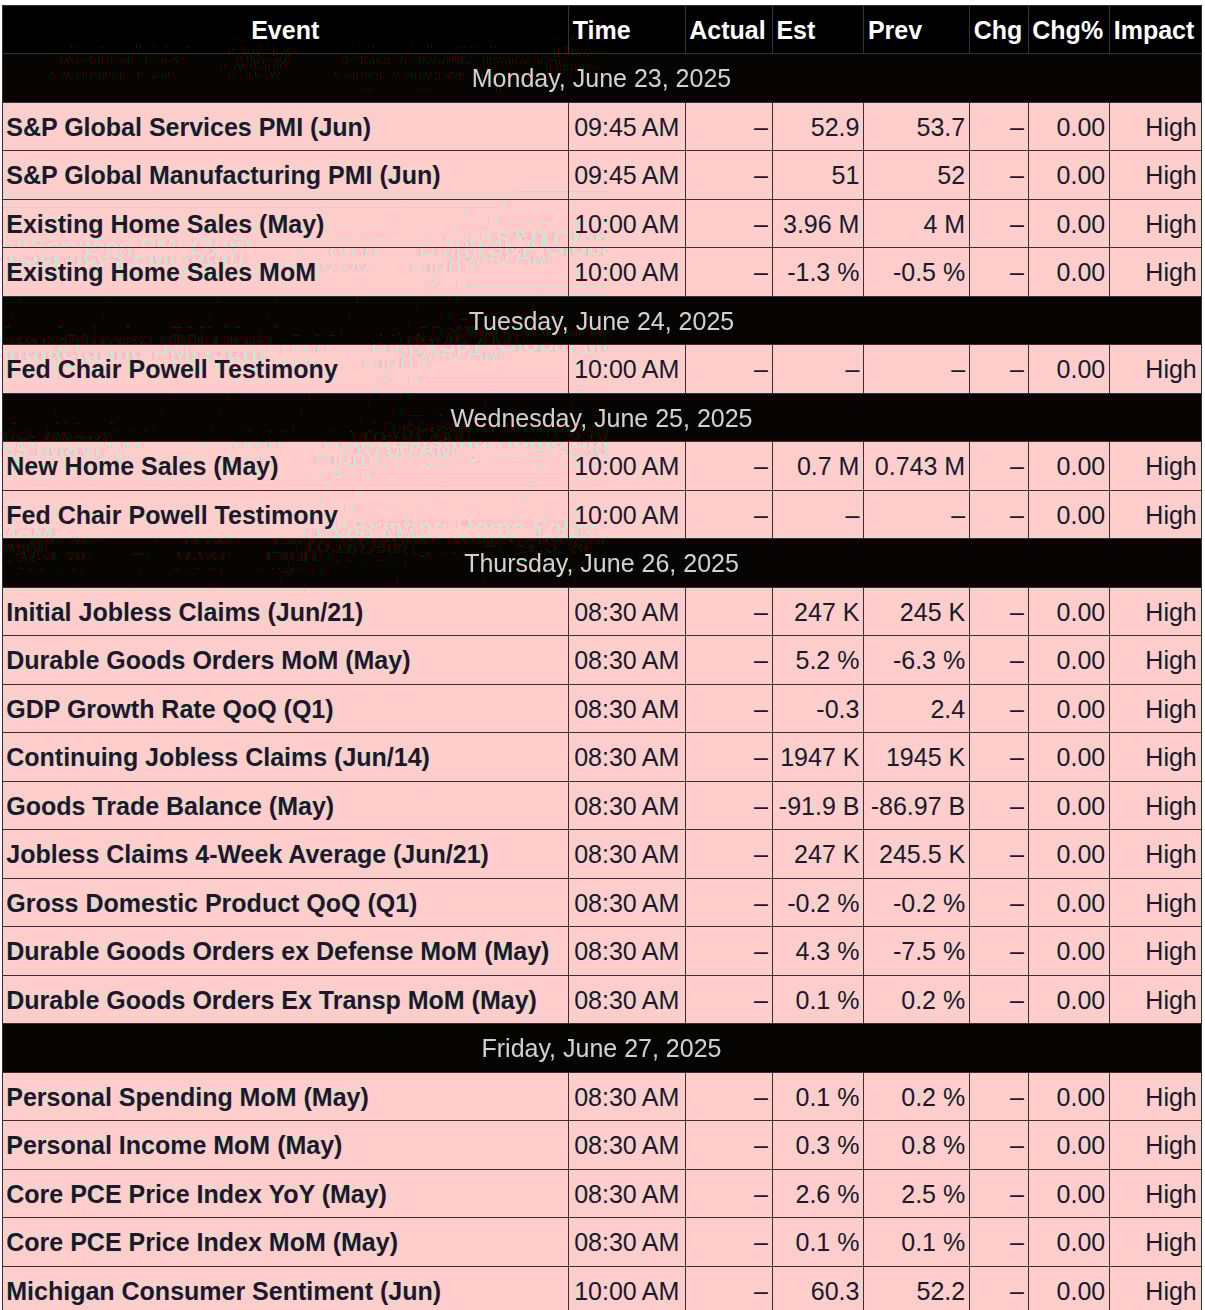
This Week’s Important Economic Events
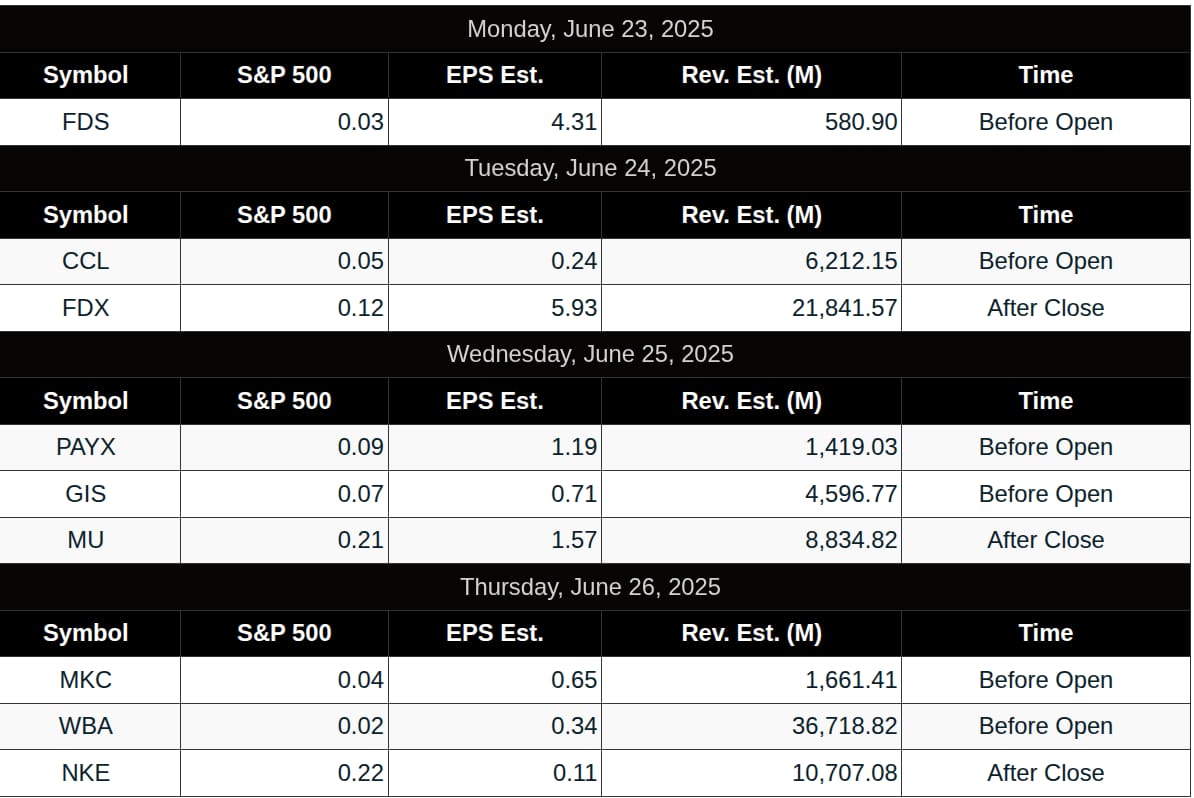
Today’s Earnings
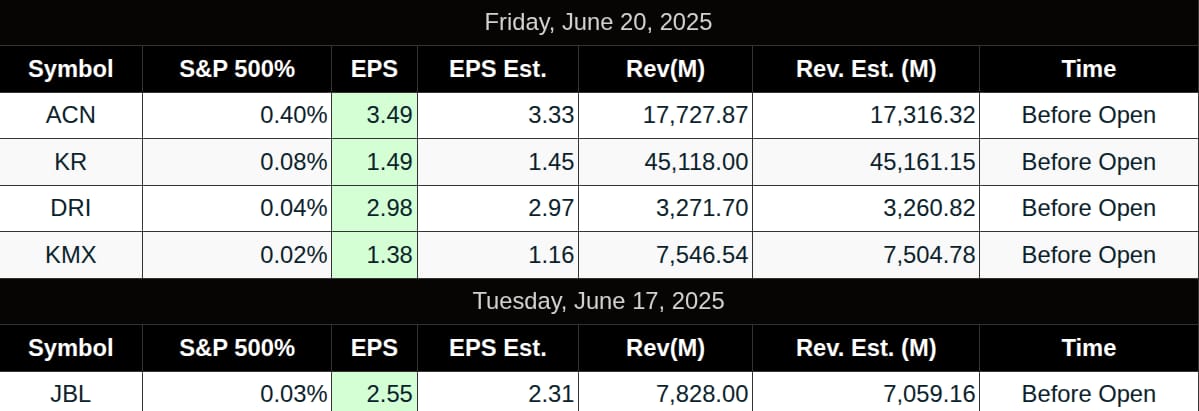
Recent Earnings
Room Summaries:
Polaris Trading Group Summary – Friday, June 20, 2025
Friday’s trading session unfolded around June’s monthly options expiration (OPEX), marked by strategic plays and key target hits in both ES and NQ futures. PTGDavid highlighted critical zones and educated members on OPEX mechanics, while traders identified premium/discount setups and confirmed long signals during the session’s transition phases.
Positive Trade Highlights:
-
Both ES and NQ hit their upper targets early in the day: ES reached 6040 and NQ exceeded 21970, as per the Daily Trade Strategy (DTS) briefing—a strong start to the OPEX session.
-
The market behavior aligned with David’s Bull Scenario, which anticipated strength above 6018 leading to the 6040 zone.
-
A notable Barbara Lopez Trade (BLT) reversal pattern was identified and validated during the morning session. Several members referenced its clarity and impact, calling it a “primo” trade.
-
Late morning, traders observed an ascending triangle forming, with a long signal confirmed around 11:24 AM, supporting a bullish continuation.
Key Lessons and Education:
-
David provided valuable insight into SPX options expiration mechanics, particularly the AM-settled structure and pinning behavior at the 6000 strike (translating to 6055 in ES).
-
The room revisited PTG University concepts, especially Module 6 on Premium & Discount trades, strengthening understanding of reversal patterns.
-
Members also engaged in mindset coaching, emphasizing discipline, FOMO avoidance, and staying aligned with trading frameworks like the OODA loop.
Community & Engagement:
-
The chat was active and collegial with contributions from members like Bruce F, John B, and slatitude39, sharing charts, confirming setups, and encouraging psychological resilience.
-
David capped the morning with a “Tip of the Week” to reinforce educational themes before stepping out during the quieter lunchtime session.
Summary:
Friday was a well-executed trading day marked by early target achievements, strategic insight into OPEX dynamics, and an educational boost through the BLT trade discussion. The room demonstrated effective collaboration, focus, and a solid grasp of premium setups—a productive close to the week.
DTG Room Preview – Monday, June 23, 2025
-
Geopolitics & Oil:
-
U.S. conducted airstrikes on three Iranian nuclear sites, escalating Israel-Iran tensions.
-
Oil surged over 4%, extending a 10% rise since Israel’s earlier strike.
-
Risks include potential Iranian retaliation or a Strait of Hormuz closure, which could spike oil to $120/barrel (JPMorgan estimate).
-
-
Political Outlook:
-
Trump warns of further U.S. action unless Iran enters peace talks.
-
Iran’s foreign minister signals “all options” on the table, though no direct threat to U.S. assets yet.
-
-
Market Sentiment:
-
So far, markets view U.S. strikes as a contained event, not full-scale involvement.
-
Volatility spiked Friday with $6.5 trillion in options expirations, freeing stocks for wider swings.
-
-
Key Earnings & Data:
-
FactSet Research (FDS) reports earnings premarket.
-
Economic releases: S&P Global Flash PMIs (9:45am ET), Existing Home Sales (10:00am ET).
-
Fed speakers: Bowman (10:00am), Goolsbee (1:10pm), Kugler & Williams (2:30pm).
-
-
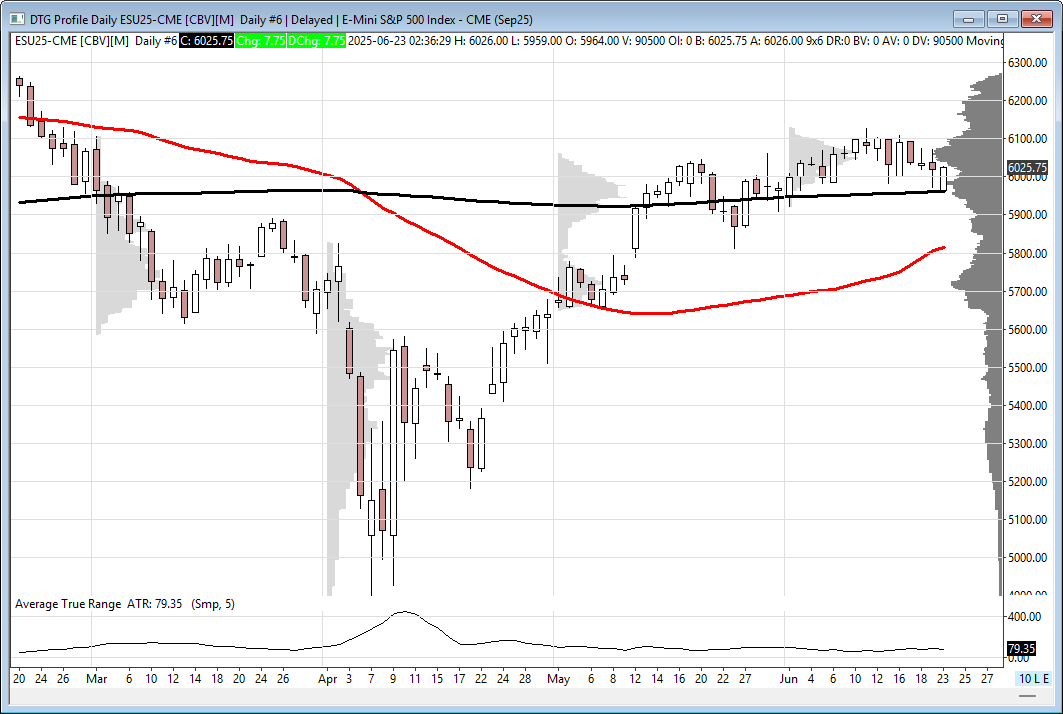
Technical Levels – ES Futures:
-
5-day average range: 90.25 points.
-
Overnight action: Rejected 200-day MA (5961.50), reclaimed 6018 settlement.
-
Key levels:
-
Support: 5965–68, 5578–83
-
Resistance: 6085–88, 6359–64
-
-
Affiliate Disclosure: This newsletter may contain affiliate links, which means we may earn a commission if you click through and make a purchase. This comes at no additional cost to you and helps us continue providing valuable content. We only recommend products or services we genuinely believe in. Thank you for your support!
Disclaimer: Charts and analysis are for discussion and education purposes only. I am not a financial advisor, do not give financial advice and am not recommending the buying or selling of any security.
Remember: Not all setups will trigger. Not all setups will be profitable. Not all setups should be taken. These are simply the setups that I have put together for years on my own and what I watch as part of my own “game plan” coming into each day. Good luck!
This post goes out as an email to our subscribers every day and is posted for free here around 2 PM ET. To get your real-time copy, sign up for the free or premium version here: Opening Print Subscribe.
Comments are closed