This post goes out as an email to our subscribers every day and is posted for free here around 2 PM ET. To get your real-time copy, sign up for the free or premium version here: Opening Print Subscribe.
Weekly Survey: First Week in June

Weekly Breadthalyzer – Friday, May 30, 2025
Exch
Adv
Dec
New Hi
New Lo
Adv Vol (M)
Dec Vol (M)
NYSE
1,925
896
153
59
11,380
9,178
NASDAQ
2,792
1,872
278
204
21,847
14,876
AMEX
151
143
16
22
1,794
839
ARCA
1,734
509
221
21
3,752
3,268
Market breadth showed mixed signals this past week. The S&P 500 saw more stocks advancing than declining, yet new highs failed to expand meaningfully, suggesting potential exhaustion near current levels. The Nasdaq displayed similar patterns, with strong performance among a handful of megacaps masking broader weakness. Meanwhile, the number of stocks trading above their 50-day moving averages remains below historical averages, highlighting underlying fragility in the rally. Traders should remain alert to potential divergences between index performance and broader participation.
Compared to the prior week, breadth metrics improved significantly. Upside volume increased across the board — from 39% to 54% on the NYSE and from 50% to 59% on the Nasdaq — indicating better participation in the rally. Advance/decline ratios also flipped positively, with NYSE advancers moving from just 19% to a robust 68%, and Nasdaq advancers climbing from 34% to 60%. These shifts suggest short-term breadth momentum is recovering. However, new highs on both exchanges only modestly outpaced new lows, and the increase in TRIN readings from 0.36 (NYSE) and 0.49 (Nasdaq) to 1.73 and 1.02, respectively, reflects a shift toward more neutral market internals. The breadth recovery needs to persist beyond mega-cap leadership to confirm broader market health.
Breadth Stats:
-
NYSE Breadth: 54% Upside Volume
-
Nasdaq Breadth: 59% Upside Volume
-
Total Breadth: 57% Upside Volume
-
NYSE Advance/Decline: 68% Advance
-
Nasdaq Advance/Decline: 60% Advance
-
Total Advance/Decline: 63% Advance
-
NYSE New Highs/New Lows: 153 / 59
-
Nasdaq New Highs/New Lows: 278 / 204
-
NYSE TRIN: 1.73
-
Nasdaq TRIN: 1.02

Key Economic Events
Monday, June 2 – ISM Manufacturing PMI
The Institute for Supply Management’s Manufacturing PMI for May will offer insights into the health of the U.S. manufacturing sector. A reading above 50 indicates expansion, while below 50 signals contraction. Recent trade policy uncertainties, including tariffs, have pressured manufacturing, so this report will be closely watched for signs of further deterioration or stabilization.
Why it matters: Manufacturing has been a weak spot globally, and a poor reading could reinforce concerns about trade-related economic slowdown.
Tuesday, June 3 – JOLTS Job Openings
The Job Openings and Labor Turnover Survey (JOLTS) for April will show the number of job vacancies in the U.S. This report is a leading indicator of labor market demand. A decline in openings could suggest cooling employer demand, while steady or rising openings might indicate continued labor market strength.
Why it matters: The Federal Reserve monitors JOLTS closely to gauge labor market tightness, which influences inflation and interest rate decisions.
Wednesday, June 4 – ADP Nonfarm Employment Report
The ADP report provides a private-sector perspective on U.S. job growth for May, serving as a precursor to the official Nonfarm Payrolls report. April’s private payroll growth slowed to 62,000, well below expectations, raising concerns about labor market momentum.
Why it matters: This report could set expectations for Friday’s jobs data and influence market sentiment mid-week.
Wednesday, June 4 – ISM Services PMI
The Services PMI, also from the Institute for Supply Management, will provide a view of the U.S. services sector, which accounts for a significant portion of economic activity. Recent data showed the services PMI at 50.8 in April, indicating modest growth but at its lowest since November 2023, partly due to tariff concerns.
Why it matters: The services sector is a key economic driver, and any signs of weakness could amplify fears of broader economic slowdown.
Wednesday, June 4 – Federal Reserve Beige Book
The Fed’s Beige Book will offer insights into regional economic conditions across the U.S. Investors will parse this qualitative data for indications of economic strength or weakness, which could inform expectations for future monetary policy decisions.
Thursday, June 5 – European Central Bank Rate Decision
The ECB is expected to cut its key deposit rate by 0.25 percentage points to 2%, marking the lowest level in over two years. This move follows aggressive rate hikes to combat inflation, which is now approaching the ECB’s 2% target. However, ECB leaders remain cautious, citing economic uncertainties and refraining from providing clear guidance on future rate paths.
Friday, June 6 – U.S. May Jobs Report
The U.S. labor market’s health will be under scrutiny with the release of May’s employment data. Analysts anticipate a slowdown, projecting 130,000 new jobs, down from April’s figures, and an unemployment rate holding at 4.2%. This report is pivotal as it may influence the Federal Reserve’s stance on interest rates, especially amid ongoing trade tensions and signs of economic deceleration.
Focused Economic Calendar
Date
Event
Link
Corporate Earnings to Watch
Tuesday, June 3 – Dollar General (DG) Q1 Earnings
Dollar General is scheduled to report its first-quarter earnings. The company is expected to post EPS of $1.47 on $10.26 billion in revenue. Analysts are watching closely for signs of how lower-income consumers are coping with sticky inflation and whether trade-down activity continues to support sales.
Wednesday, June 4 – Dollar Tree (DLTR) Q1 Earnings
Dollar Tree is projected to report adjusted EPS of $1.15 on $4.53 billion in net sales. Analyst sentiment is mixed, reflecting concerns over input costs and execution following recent operational shifts. Investors will look for guidance on margins and consumer behavior in a high-cost environment.
Thursday, June 5 – Broadcom (AVGO) Q2 Earnings
Broadcom is set to report its fiscal second-quarter earnings, with analysts projecting strong revenue and profit growth driven by increasing demand for AI chips. Wall Street anticipates revenue of $15.02 billion, up 20% from the previous year, and adjusted net income reaching $7.8 billion. AI-related revenue is expected to grow by 42% year-over-year to $4.42 billion.
Chart of the Week:
 You will find more infographics at Statista
The growth of India’s economy carries several implications for global markets and investment strategies. As one of the world’s fastest-growing major economies, its expansion influences global trade patterns, creates investment opportunities across various sectors, and increasingly positions it as a crucial market for multinational corporations.
Amid ongoing geopolitical tensions and the drive for supply chain diversification (often termed a “China plus one” strategy), India’s economic growth makes it a significant candidate for increased foreign direct investment (FDI). Companies are actively seeking to de-risk supply chains heavily concentrated in single nations. India, with its large and youthful demographic, expanding domestic market, and democratic framework, is often highlighted as a key beneficiary of this global realignment. Continued economic expansion could see India playing a more substantial role in global manufacturing and services, thereby influencing long-term investment allocations towards India-focused financial products or companies with significant operational footprints in the country.
Beyond its export potential, a critical driver of India’s GDP growth is its robust domestic demand. A growing economy typically translates to rising per capita income and an expanding middle class, which in turn fuels domestic consumption across a wide array of goods and services. This internal economic dynamism can offer a degree of resilience, making India’s growth trajectory potentially less susceptible to global economic slowdowns compared to economies that are more heavily reliant on exports. This positions companies focused on India’s domestic market as potentially attractive long-term growth investments and offers new avenues for global consumer brands.
Geopolitical Events
June 5 – UN Security Council Elections
The UN General Assembly will elect five non-permanent members to the Security Council, including seats from Africa, Asia, Latin America, and Eastern Europe. These elections could influence international diplomatic dynamics and global policy directions.
Levels We Are Watching
S&P 500 Index (SPX)
Current Price: 5,911.69 (+2.24% weekly)
Support: 5,824
Resistance: 5,996
Commentary: The SPX continues to hover near all-time highs. Traders should watch for a potential breakout above 5,954 or pullback toward the 5,866 zone for directional cues.
Nasdaq-100 Index (NDX)
Current Price: 21,340.99 (-0.11%)
Support: 21,206
Resistance: 21,578
Commentary: NDX remains strong, led by tech megacaps. Key resistance sits at 21,578, and a break could accelerate bullish momentum.
Dow Jones Industrial Average (DJI)
Current Price: 41,270.07 (+0.13%)
Support: 41,560
Resistance: 42,735
Commentary: The Dow is attempting to reclaim lost ground. Watch the 42,735 level for signs of trend continuation or a stall in recovery.
Crude Oil (USO)
Current Price: 67.15 (-0.25)
Support: 65.75
Resistance: 68.74
Commentary: Oil prices are stabilizing after recent volatility. Supply concerns and geopolitical developments will be key factors influencing price movements.
Bitcoin (BTC-USD)
Current Price: 105,078 (+0.49%)
Support: 100,928
Resistance: 107,867
Commentary: Bitcoin’s price is consolidating, with market participants awaiting regulatory developments and macroeconomic signals.
ETFs
S&P 500 (SPY)
Current Price: 589.39
Support: 579.32
Resistance: 600.45
Commentary: The S&P 500 has rebounded from April lows, bolstered by easing trade tensions and strong earnings. Investors should monitor the 579.32 support level and 600.45 resistance for potential breakout or pullback scenarios.
Nasdaq-100 (QQQ)
Current Price: 519.11
Support: 511.53
Resistance: 529.90
Commentary: Tech stocks continue to show strength, with AI-related companies leading gains. Watch for potential resistance around 529.90, especially with upcoming earnings reports.
Dow Jones Industrial Average (DIA)
Current Price: 422.85
Support: 416.01
Resistance: 427.58
Commentary: The Dow is hovering just above its 200-day moving average, currently at 421.82. A move above 427.58 could signal renewed bullish momentum.
Yield Curves
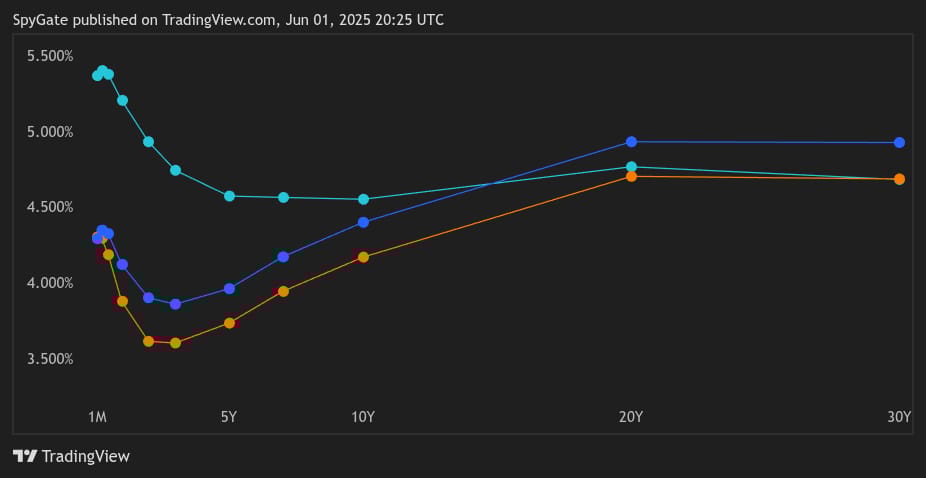
The overall shape of the June 1, 2025 yield curve is generally upward sloping from the 2-year to 30-year maturities, which is characteristic of a “normal” yield curve and typically signals expectations of economic expansion. However, there’s a notable feature at the very short end: the 1-month yield (4.290%) is lower than the 3-month yield (4.346%) but higher than the 6-month (4.323%), 1-year (4.120%), and 2-year (3.900%) yields. This creates a slight initial inversion or “hump” at the front end of the curve before it begins its more consistent upward slope. The yields dip from the 3-month maturity to the 3-year maturity, before rising again. This could suggest some near-term uncertainty or specific market dynamics affecting short-term rates, possibly related to expectations around Federal Reserve policy.
Conclusion:
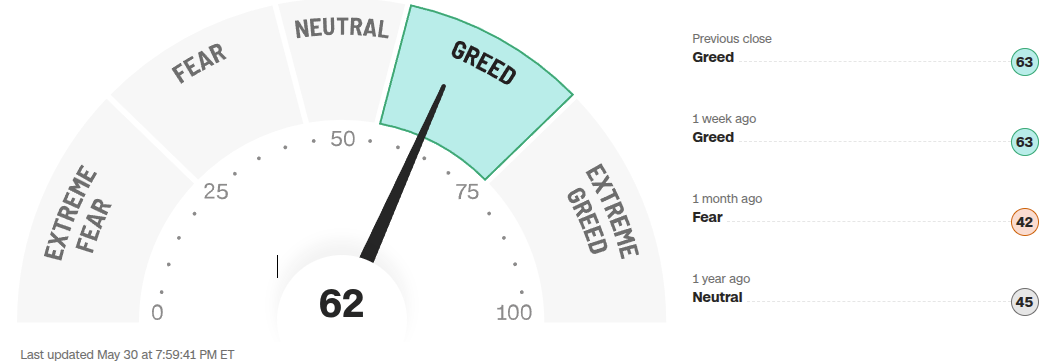
The week ending May 30, 2025, wrapped up with a pretty solid showing from the market. Breadth was positive across both the NYSE and NASDAQ — most stocks moved higher, and the volume generally backed those moves. We also saw more new highs than lows on the week, which is another plus. That said, the NYSE TRIN came in high at 1.73, which hints at some under-the-surface selling pressure or maybe just a lack of strong volume in the winners. Over on the Nasdaq, the TRIN was a much calmer 1.02, suggesting things were more balanced there. The CNN Fear & Greed Index is sitting at 61 — technically in “Greed” territory, but it’s cooled off a bit.
One quick note: the index and Bitcoin levels you initially had didn’t match up with the actual May 30 closing prices. So for any technical takeaways, we’ve gone with the official daily closes.
Now, looking ahead to the week of June 2, it’s going to be a big one. We’ve got a packed schedule of key economic reports — ISM Manufacturing and Services PMIs, JOLTS job openings, ADP private payrolls, and the main event: Friday’s jobs report. All of these are going to matter, not just for what they say about the economy, but for how the Fed might respond. If signs of a slowdown keep showing up without a fresh wave of inflation, rate-cut expectations could come back into play.
There’s also some action on the earnings front. Reports from Dollar General, Dollar Tree, and Broadcom will give us more color on two sides of the market — how stretched consumers are at the low-cost end, and whether the AI tech momentum is still running strong. Globally, the mood is still tense after the IISS Shangri-La Dialogue highlighted the ongoing friction between the U.S. and China — that’s a slow-burn risk that markets aren’t ignoring.
Technically, we’re at some interesting levels. The S&P 500 and Nasdaq-100 are butting up against resistance, while the Dow is trying to figure out its next move in a pivot zone.
Bottom line: weekly breadth was encouraging, but the elevated TRIN on the NYSE is a yellow flag. With so many important reports hitting this week, the market’s next move will likely hinge on whether the data supports a soft landing — or not. It’s a good time to stay nimble and keep your eyes on the tape.
This post goes out as an email to our subscribers every day and is posted for free here around 2 PM ET. To get your real-time copy, sign up for the free or premium version here: Opening Print Subscribe.
Comments are closed