This post goes out as an email to our subscribers every day and is posted for free here around 2 PM ET. To get your real-time copy, sign up for the free or premium version here: Opening Print Subscribe.
Weekly Survey: 4th Week in June. Summertime!

Welcome to your weekly market update, where we dissect the most critical trading events, provide strategic levels, and analyze upcoming geopolitical developments set to shape the global financial landscape. As we look ahead, the interplay of economic data, corporate performance, and geopolitical shifts will once again define market sentiment and opportunities.
Weekly Breadthalyzer – Friday, June 20th, 2025
For the week ending June 20, 2025, market breadth data reveals some interesting shifts compared to the prior week.
The NYSE saw a slight decline in upside volume, moving from 48.75% to 48.18%. However, the NYSE Advance/Decline advance percentage significantly improved, rising from 39.85% to 49.02%, indicating a stronger participation of advancing stocks on the exchange. Nasdaq’s upside volume experienced a more noticeable drop from 66.82% to 56.79%, suggesting less volume concentrated in advancing stocks. Despite this, Nasdaq’s Advance/Declined advance percentage also improved, climbing from 36.52% to 48.43%.
Overall, total upside volume across the exchanges decreased from 61.17% to 53.47%. However, the total advance percentage saw a healthy increase from 39.66% to 48.65%, indicating that a greater proportion of issues advanced this week compared to last.
The number of NYSE new highs decreased from 168 to 137, and Nasdaq new highs also fell, from 385 to 327. Conversely, NYSE new lows increased from 73 to 106, and Nasdaq new lows saw a substantial rise from 195 to 266. This suggests that while more stocks advanced, there was also an uptick in stocks hitting new 52-week lows, hinting at underlying divergences.
The TRIN values for NYSE (1.01) and Nasdaq (0.68) both increased compared to the previous week (0.70 and 0.29, respectively). An increase in TRIN generally suggests more selling pressure, as declining issues are seeing proportionately more volume than advancing issues. The Nasdaq TRIN remaining below 1.0, however, still indicates that advancing volume outpaced declining volume on that exchange, although less so than the prior week. The NYSE TRIN moving above 1.0 points indicates a shift towards more volume in declining issues.
While the overall uptrend in the S&P 500 remains intact, its breadth (percentage of stocks above the 200-day SMA) will be crucial to monitor. Last week’s data showed a minor decline for the S&P 500 breadth and a more significant drop for the Russell 2000 breadth.
Metric
Current Week’s Status (Week Ending June 20, 2025)
Previous Week’s Status (Week Ending June 13, 2025)
Change (Week-over-Week)
S&P 500 Breadth (% above 200-day SMA)
45.12%
47%
-1.88%
Nasdaq Composite Breadth (% above 200-day SMA)
58.41%
64%
-5.59%
Russell 2000 Breadth (% above 200-day SMA)
33.12%
44%
-10.88%
NYSE Breadth upside volume
48.18%
48.75%
-0.57%
Nasdaq Breadth upside volume
56.79%
66.82%
-10.03%
Total Upside Volume
53.47%
61.17%
-7.70%
NYSE Advance/Declines Advance Percent
49.02%
39.85%
+9.17%
Nasdaq Advance/Declined Advance Percent
48.43%
36.52%
+11.91%
Total Advance Percent
48.65%
39.66%
+8.99%
NYSE New Highs for the week
137
168
-31
Nasdaq New Highs for the week
327
385
-58
NYSE New Lows for the week
106
73
+33
Nasdaq New Lows for the week
266
195
+71
NYSE Trin
1.01
0.70
+0.31
Nasdaq Trin
0.68
0.29
+0.39
Breadth Stats:
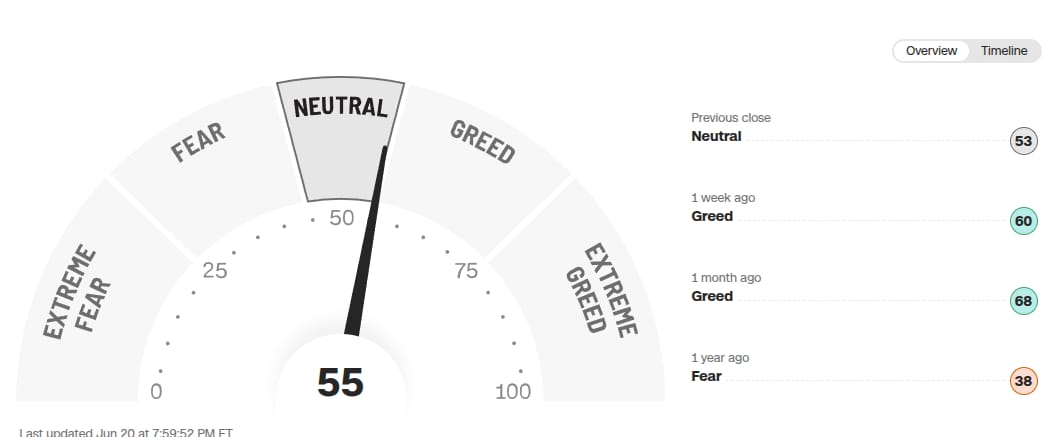
The CNN Fear and Greed Index, a gauge of market sentiment, currently stands at 55 (Neutral) as of June 20, 2025. This indicates a shift towards a more balanced sentiment compared to the greed observed in previous weeks.
Previous Close (June 19, 2025): 53 (Neutral) 1 Week Ago (June 13, 2025): 60 (Greed) 1 Month Ago (approx. May 20, 2025): 68 (Greed) 1 Year Ago (approx. June 20, 2024): 38 (Fear)

Key Economic Events
The upcoming week, June 24-28, 2025, will feature several important economic data releases that could influence market direction. We will highlight the most significant events below, drawing from global economic calendars.
Monday, June 23, 2025:
-
S&P Global Services PMI (Jun) (09:45 AM ET): This flash reading provides an early look at the health of the services sector, a dominant part of the U.S. economy. A strong reading (above 50) indicates expansion, while a weaker reading suggests contraction, influencing expectations for overall economic growth.
-
S&P Global Manufacturing PMI (Jun) (09:45 AM ET): Similar to the services PMI, this report offers a snapshot of the manufacturing sector’s activity. Continued expansion in manufacturing supports the broader economic outlook.
-
Existing Home Sales (May) (10:00 AM ET): This report is a key indicator of the health of the housing market and broader consumer activity. A decrease in sales would underscore ongoing challenges in the housing sector.
-
Existing Home Sales MoM (May) (10:00 AM ET): The month-over-month change in existing home sales further illustrates the trend in housing market momentum.
Tuesday, June 24, 2025:
-
Fed Chair Powell Testimony (10:00 AM ET): Federal Reserve Chair Jerome Powell is scheduled for testimony, providing a crucial opportunity for markets to gain further clarity on the Fed’s economic outlook and monetary policy intentions. His remarks will be closely watched for any divergence from previous statements or new insights into the Fed’s reaction function.
Wednesday, June 25, 2025:
-
New Home Sales (May) (10:00 AM ET): This report measures the sales of newly constructed single-family homes. A rebound in new home sales indicates strength in the construction sector and buyer demand, influencing future housing starts and economic activity.
-
Fed Chair Powell Testimony (10:00 AM ET): This is Chair Powell’s second testimony this week. Markets will be looking for continued consistency in his message or any new nuances regarding the Fed’s stance on inflation and economic growth.
Thursday, June 26, 2025:
-
Initial Jobless Claims (Jun/21) (08:30 AM ET): This weekly data provides a real-time pulse on the health of the labor market. A sustained increase in claims could signal a softening job market, potentially influencing the Fed’s path.
-
Durable Goods Orders MoM (May) (08:30 AM ET): This report measures new orders for long-lasting manufactured goods. It’s a key indicator of manufacturing activity and business investment. A robust increase signals economic expansion, particularly in the industrial sector.
-
GDP Growth Rate QoQ (Q1) (08:30 AM ET): This final revision of the first-quarter GDP growth rate will provide a definitive measure of economic expansion. Any significant revision could impact market expectations for future growth and monetary policy.
-
Continuing Jobless Claims (Jun/14) (08:30 AM ET): This data indicates the number of people continuing to receive unemployment benefits, offering further insight into the persistence of unemployment.
-
Goods Trade Balance (May) (08:30 AM ET): This report provides a look at the U.S. trade deficit in goods, offering insights into international trade flows and demand for U.S. products.
-
Jobless Claims 4-Week Average (Jun/21) (08:30 AM ET): The 4-week moving average smooths out weekly volatility in jobless claims, providing a clearer trend of labor market health.
-
Gross Domestic Product QoQ (Q1) (08:30 AM ET): This is another look at the first-quarter GDP, focusing on the quarter-over-quarter percentage change.
-
Durable Goods Orders ex Defense MoM (May) (08:30 AM ET): This metric excludes volatile defense orders, providing a cleaner view of core business investment.
-
Durable Goods Orders Ex Transp MoM (May) (08:30 AM ET): Excluding transportation orders removes another highly volatile component, offering a refined measure of underlying demand for durable goods.
Friday, June 27, 2025:
-
Personal Spending MoM (May) (08:30 AM ET): This report measures consumer spending, a major driver of the U.S. economy. A strong reading suggests robust demand and economic momentum.
-
Personal Income MoM (May) (08:30 AM ET): This data indicates the change in individual income, which directly influences consumer spending power.
-
Core PCE Price Index YoY (May) (08:30 AM ET): As the Federal Reserve’s preferred measure of inflation, this annual reading is crucial. A persistent increase could reinforce a hawkish Fed stance.
-
Core PCE Price Index MoM (May) (08:30 AM ET): The month-over-month change in core PCE provides a more immediate look at inflationary pressures, excluding volatile food and energy components.
-
Michigan Consumer Sentiment (Jun) (10:00 AM ET): This final reading of consumer sentiment provides further insight into consumer confidence and inflation expectations.
Corporate Earnings to Watch
The earnings calendar for the upcoming week features reports from several notable S&P 500 companies. These reports will provide valuable insights into sector-specific performance and broader economic trends.
Friday, June 20, 2025:
-
Accenture (ACN) – Before Open: As a leading global professional services company, Accenture’s earnings offer insights into IT consulting, outsourcing, and digital transformation trends across various industries.
-
Kroger (KR) – Before Open: As a major grocery retailer, Kroger’s earnings offer insights into consumer spending on essentials, inflationary pressures on food prices, and the competitive landscape in the grocery sector.
-
Darden Restaurants (DRI) – Before Open: The parent company of Olive Garden and LongHorn Steakhouse, Darden’s results will reflect trends in casual dining, consumer discretionary spending on dining out, and labor cost pressures.
-
CarMax (KMX) – Before Open: As a used car retailer, CarMax’s earnings will provide clues about consumer demand for vehicles, used car pricing trends, and the impact of interest rates on auto financing.
Monday, June 23, 2025:
-
FactSet (FDS) – Before Open: As a financial data and analytics provider, FactSet’s earnings can serve as a bellwether for the financial services industry’s health and investment in data solutions.
Tuesday, June 24, 2025:
-
Carnival (CCL) – Before Open: A leading cruise operator, Carnival’s report will shed light on the travel and leisure sector’s recovery, consumer travel demand, and the impact of fuel costs and geopolitical tensions on the industry.
-
FedEx (FDX) – After Close: As a major global logistics and delivery company, FedEx’s earnings offer a bellwether for global trade, e-commerce trends, and overall economic activity, particularly in freight volumes and pricing.
Wednesday, June 25, 2025:
-
Paychex (PAYX) – Before Open: Providing human capital management solutions, Paychex’s results offer insights into small and medium-sized business hiring trends, wage growth, and the overall health of the employment market.
-
General Mills (GIS) – Before Open: A leading food company, General Mills’ earnings will shed light on consumer spending on packaged foods, inflationary pressures on food prices, and the competitive landscape in the grocery sector.
-
Micron Technology (MU) – After Close: As a major producer of memory and storage solutions, Micron’s earnings are a key indicator for the semiconductor industry and demand for data centers, PCs, and mobile devices.
Thursday, June 26, 2025:
-
McCormick & Company (MKC) – Before Open: As a global leader in spices, flavors, and seasonings, McCormick’s earnings will indicate consumer trends in food and beverage, as well as commodity costs.
-
Walgreens Boots Alliance (WBA) – Before Open: A major retail pharmacy chain, Walgreens’ report will shed light on healthcare spending, pharmacy trends, and consumer retail behavior.
-
Nike (NKE) – After Close: As a global leader in athletic footwear and apparel, Nike’s earnings will provide insights into consumer discretionary spending, athletic trends, and supply chain dynamics.
Chart of the Week:
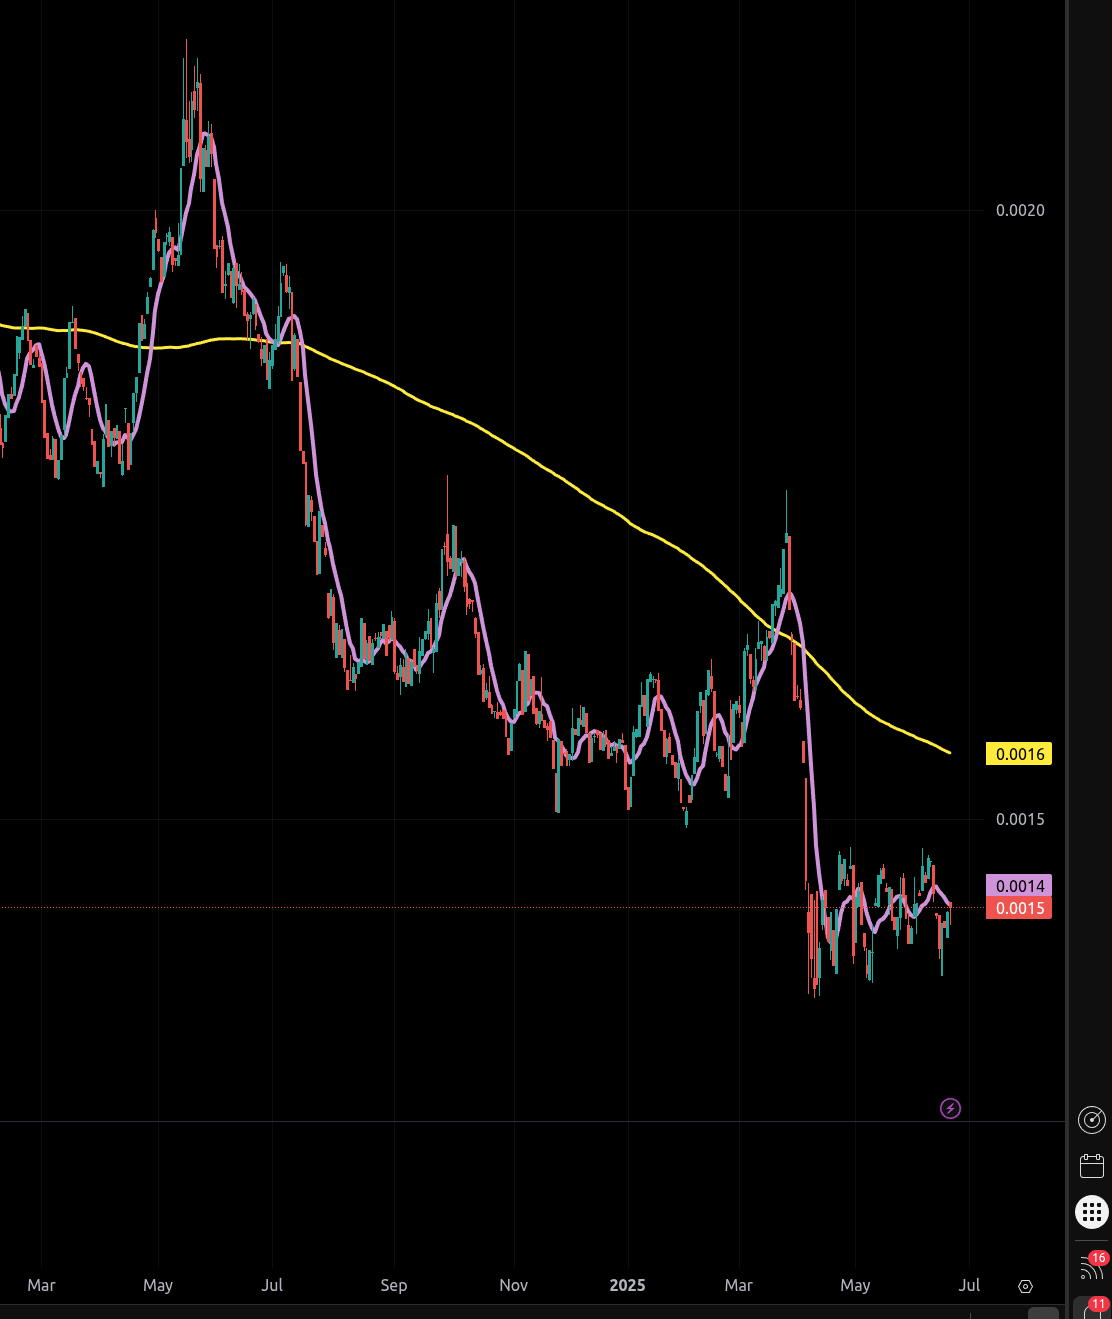
This week’s Chart of the Week focuses on the Copper-Gold ratio, a widely watched indicator often referred to as the “Doctor Copper” signal. This ratio is derived by dividing the price of copper (an industrial metal sensitive to economic activity) by the price of gold (a traditional safe-haven asset).
Significance of the Trend: The chart visually depicts a continued decline in the copper-gold ratio since March 2025. This falling trend is significant because the ratio is commonly used as a barometer for global economic health and inflation expectations.
-
Copper is highly correlated with economic growth because of its extensive use in construction, manufacturing, and electronics. When economic activity is robust, demand for copper tends to rise, pushing its price higher.
-
Gold, on the other hand, is often seen as a safe-haven asset that performs well during periods of economic uncertainty, inflation fears, or geopolitical instability.
Therefore, a falling copper-gold ratio typically suggests:
-
Weakening Economic Growth: A decline indicates that copper prices are underperforming gold, signaling a potential slowdown in global industrial activity and economic expansion. This can imply reduced demand for industrial commodities.
-
Deflationary or Disinflationary Pressures: It can also suggest that inflationary pressures are easing, or even that disinflation/deflation might be on the horizon, as demand-driven price increases for industrial inputs (like copper) diminish relative to a store of value (gold).
-
Risk Aversion: The outperformance of gold points to increasing market caution and a flight to safety among investors, signaling heightened concerns about future economic stability or increased geopolitical risks.
The continued fall in this ratio, as observed in the chart, could imply that market participants are anticipating a weaker economic environment ahead, or a period of sustained disinflation, prompting them to favor defensive assets like gold over economically sensitive commodities.
Geopolitical Events
Geopolitical developments continue to be a significant wild card for global markets, capable of triggering swift and impactful reactions. Here are the scheduled events and ongoing situations to monitor.
Scheduled Events:
-
NATO Summit (June 24-26, 2025, The Hague, Netherlands): For the first time, the Netherlands will host the NATO Summit. This event is highly significant given the ongoing war in Ukraine, alliance unity, and the implications of the upcoming U.S. presidential election. Key discussions will likely revolve around increased defense spending, support for Ukraine, and addressing new security challenges. Any major announcements or shifts in alliance strategy could impact European markets and defense stocks.
-
Internet Governance Forum (June 23-27, 2025, Lillestrom, Norway): This UN meeting will bring together stakeholders to discuss critical issues related to internet policy, digital rights, and the future of online governance. While not directly market-moving, discussions on data privacy, cybersecurity, and global digital frameworks can have long-term implications for technology companies and digital economies.
Ongoing Geopolitical Developments:
-
Escalating Israel-Iran Tensions: The conflict has entered its second week with heightened intensity. The United States conducted strikes targeting three Iranian nuclear facilities with bunker-buster bombs and Tomahawk cruise missiles, as of June 22, 2025. U.S. and Israeli officials suggest “extreme damage” was inflicted, potentially setting back Iran’s nuclear program. In retaliation, Iran has reportedly launched multiple missile barrages at Israel, with some impacts reported in populated areas. Iran has also threatened shipping in the Strait of Hormuz and may have interfered with GPS signals. This continued escalation poses significant risks to global oil supplies, potentially driving prices higher, and increases demand for safe-haven assets like gold. The broader risk of regional destabilization remains a primary concern for investors.
-
US-China Trade Dynamics: While no specific scheduled trade talks are highlighted for next week, the ongoing uncertainty surrounding U.S. tariffs and trade relations with China continues to be a backdrop for market sentiment. The potential for new tariffs or trade disputes could resurface as a market driver at any time, especially with recent federal court rulings allowing the enforcement of global tariffs.
Levels We Are Watching
Understanding key strategic levels is vital for navigating market volatility and identifying potential entry and exit points. These levels serve as critical inflection points for various financial instruments.
S&P 500 Index (SPX)
-
Bull/Bear Line: 5968.31
-
Upper Target: 6065.72
-
Lower Target: 5916.63
Nasdaq-100 (NDX)
-
Bull/Bear Line: 21675.94
-
Upper Target: 22052.88
-
Lower Target: 21369.85
Dow Jones Industrial Average (DJI)
-
Bull/Bear Line: 42486.59
-
Upper Target: 43054.64
-
Lower Target: 41918.54
Crude Oil (USO)
-
Bull/Bear Line: 80.47
-
Upper Target: 91.38
-
Lower Target: 74.60
GLD
-
Bull/Bear Line: 317.26
-
Upper Target: 319.60
-
Lower Target: 313.00
Yield Curves
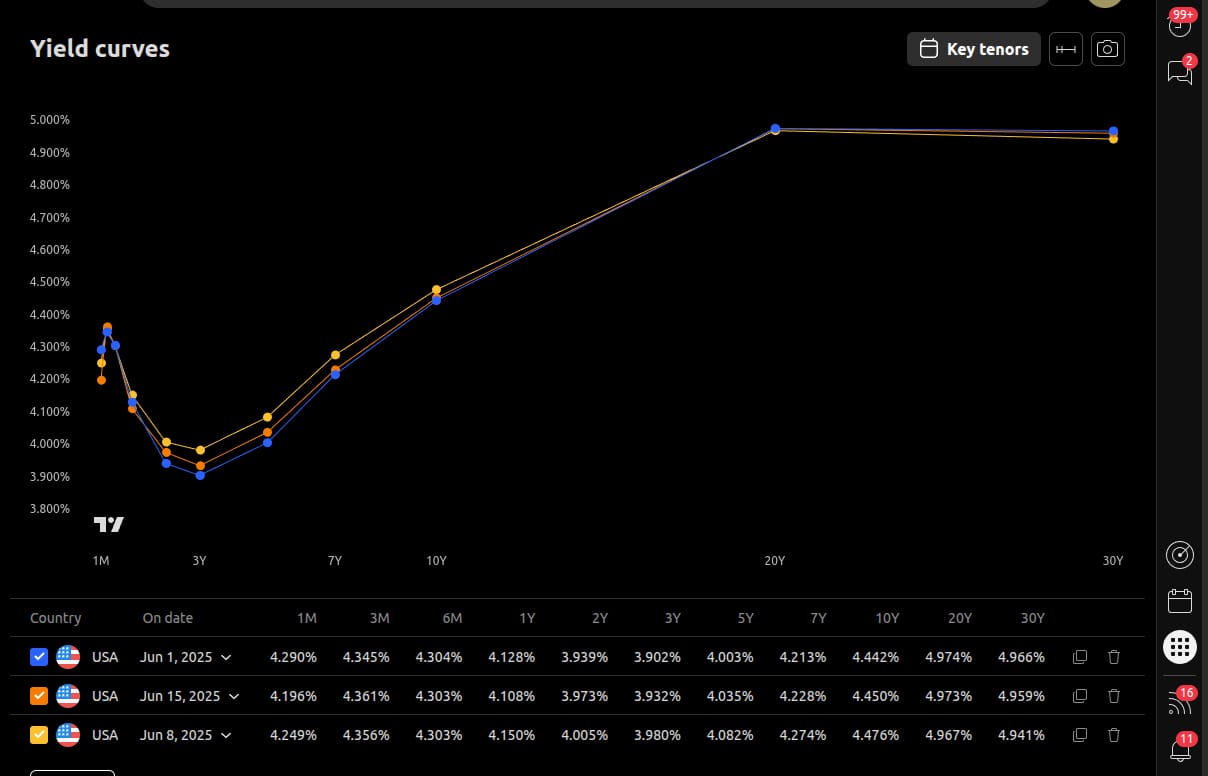
Global yield curves and interest rates are crucial barometers of economic health, inflation expectations, and monetary policy stances. Their movements have profound implications for financial assets and investment strategies.
US Treasury Yield Curve (as of June 15, 2025): The U.S. Treasury yield curve experienced mixed movements compared to the previous week (June 8, 2025). Shorter-term and mid-term yields generally saw a decrease, while the very long end of the curve saw a slight increase.
-
Short-term (1-month to 10-year): Most yields in this segment declined. The 1-month yield dropped by 5.3 basis points (bps) to 4.196%, and the 3-year yield decreased by 4.8 bps to 3.932%. Even the 10-year yield saw a 2.6 bps decline to 4.450%. This suggests a modest easing of expectations for short-to-medium term interest rates.
-
Long-term (20-year to 30-year): Yields at the very long end experienced slight increases. The 20-year yield rose by 0.6 bps to 4.973%, and the 30-year yield increased by 1.8 bps to 4.959%.
This mixed movement implies that while near-term rate expectations may be moderating, there are still some underlying pressures or demand for duration at the very long end. The overall shape of the curve reflects continued complexity and uncertainty regarding the future path of inflation, economic growth, and the Federal Reserve’s monetary policy.
Global Interest Rate Outlook and Implications: The collective stance of central banks continues to be one of cautious assessment amidst various headwinds. While specific decisions from the Bank of Japan and Bank of England will be closely watched, the prevailing theme remains a “wait-and-see” approach. Persistent inflationary pressures, coupled with geopolitical risks (e.g., Israel-Iran conflict driving oil prices) and trade uncertainties, make central bankers hesitant to commit to aggressive easing cycles. This “higher-for-longer” interest rate environment, even if rates are not actively rising, implies continued pressure on borrowing costs for businesses and consumers, which could temper economic growth and corporate earnings in the coming quarters.
Conclusion:
The week ahead is set to be highly dynamic, dominated by a comprehensive slate of economic data, significant corporate earnings reports, and persistent, escalating geopolitical tensions. The upcoming NATO Summit will shape defense and security policy, while the ongoing Israel-Iran conflict remains a critical variable for energy markets and global risk sentiment. Investors should remain highly attuned to these developments, as they will dictate market movements and investment opportunities.
Stay alert, stay nimble. Watch oil.
This post goes out as an email to our subscribers every day and is posted for free here around 2 PM ET. To get your real-time copy, sign up for the free or premium version here: Opening Print Subscribe.
Comments are closed