Winning Streak Comes to a Halt
Algos helped drive stocks lower on Wednesday
Hello Fellow Trader,
Don’t Forget! Our upcoming dynamic Live Q&A session featuring two leading experts in the field is this weekend!
Please register for S&P 500 Quantitative End of Year Review + Stock Market Outlook for 2024 on Dec 23, 2023 11:00 AM EST at:
After registering, you will receive a confirmation email containing information about joining the webinar.
We look forward to having you join us for an engaging and informative session!
Our View
I tried very hard not to get into the sell-the-rallies and buy the pullback leans because the ES was just not pulling back.
At the same time, I had a feeling the ES was long overdue for a drop, but I had no idea the futures would fall as much as they did and as fast as they did. I am not sure why it took so long, but I think it has to do with all the money being put to work at the end of the year.
Yesterday afternoon’s option flow didn’t help matters, as short-dated expirations helped drive the decline. This article sums it up quite well.
Our Lean
I could not find the headline, but I heard someone in one of the MTS chat rooms say that a Fed governor said something about how inflation was going to remain high. That spooked the markets, along with some ECB commentary.
With so many longs and an abundance of sell-stops below, the algos took the ball and ran with it. I remember being on the floor and looking for a year-end rally and after an early rally in December, it sold off just before Christmas and then rallied during the Santa Claus rally after Christmas.
I bought the lows yesterday and just sold one lot out on Globex at 4759.00 and remain long 1 lot. I figured buying under 4750 was not a bad idea.
I am going to leave it at that. I want to thank all of you for being part of the Opening Print and I hope I have been a good guide to the S&P 500. Happy Holidays and Merry Christmas to all of you.
For those of you who like HandelStats levels, here they are:
-
Upside: Trade and hourly above 1 sd at 4775.15 targets 4780. Hourly close above there targets 4785.88. Hourly close above there targets 2 sd at 4803.79. Hourly close above 4809.50 targets 4816, then 4822.50.
-
(**Daily close above 4785.88 puts the market back on the march higher.)
-
-
Downside: Trade and hourly close below 4774.25 targets 4769.62, then 4765, then 4763.25. Trade and hourly close below there targets settlement 4746.50. Trade and hourly close below there targets 4742.25, hourly close below there targets 4726.88, then -1 sd at 4717.85. Hourly close below there targets 4701.75, then 4691.62, and -2 sd at 4689.21.
MiM and Daily Recap
ES 15-min recap
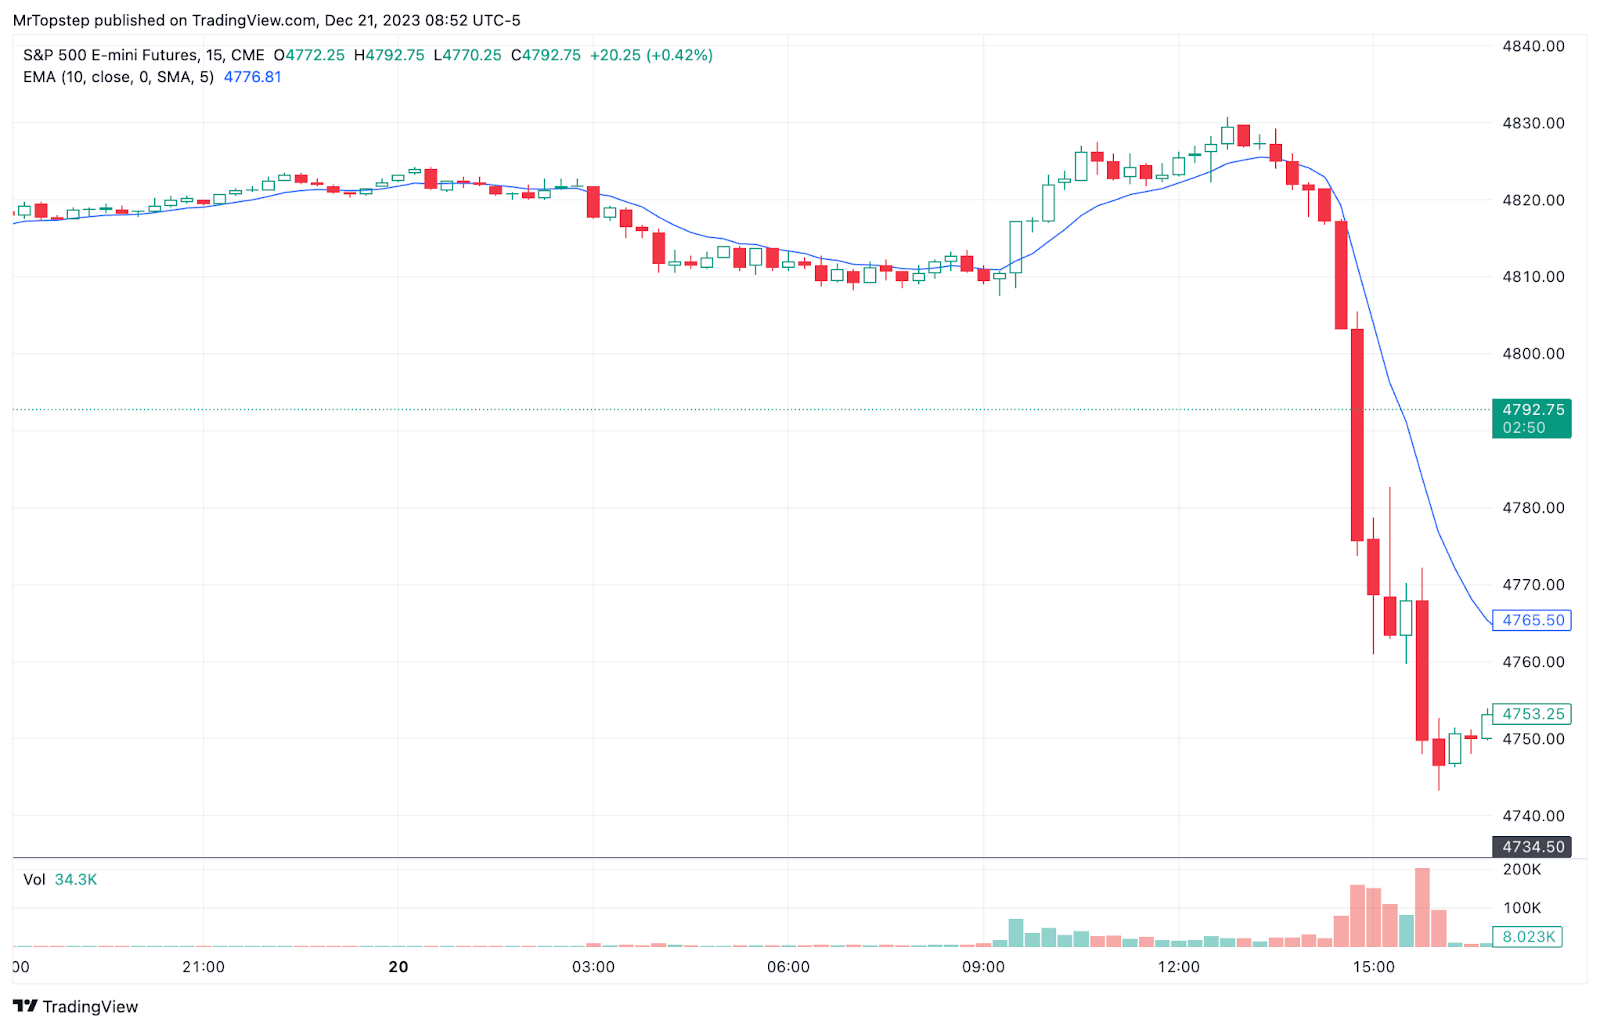
The ES traded up to a new contract high at 4824.25 on Globex and then traded down 4807.50 at 9:29 and traded 4809.75 on Wednesday’s regular session open. After the open, the ES traded 4808.50 and traded up to 4821.75 at 10:01, pulled back to the VWAP at 4827.00, then to the 4823.00 level, and then made another new all-time contract high at 4827.50 at 10:48. After the high, the ES pulled back to 4821.75 and then traded up to another new contract high at 4830.75 at 1:01 before dropping down to the 4518.00 area at 2:08. The ES then dropped 57 points off the high down to 4773.75 at 2:53.
The ES rallied back up to 4790.00 and then dropped down to 4761.00 at 3:09. After the low, the ES rallied back up to 4777.75, sold off down to 4767.25 at 3:15 and then rallied back up to 4782.75, before dropping down to a new low at 4759.75 at 3:37 as the early imbalance showed $866 million to sell and traded back up to 4768.75 at 3:46. The ES traded 4767.50 as the cash imbalance showed $1.4 billion to buy, rallied up to 4772.25 and then sold off back to the low of the day at 4748.00 at 3:59 and traded 4750.50 on the 4:00 cash close. After 4:00, the ES sold off down to 4743.25, rallied back up to 4749.50, and traded 4753.25 on the 5:00 cash close, down 65 points or -1.53% on the day and down 87.5 points off the high of the day.
In the end, it was another day of new all-time highs and then a big late-day drop. In terms of the ES’s overall tone, it was firm for the first 3.5 hours and then sold off 87.5 points in the final four hours. In terms of the ES’s overall trade, volume was extremely low before the ES sold off and nearly doubled in the final four hours: 174k traded on Globex, and 1.434 million traded on the day session for a total of 1.608 million contracts traded.
Technical Edge
-
NYSE Breadth: 9% Upside Volume (!!)
-
Nasdaq Breadth: 21% Upside Volume
-
Advance/Decline: 22% Advance
-
VIX: ~13.50
-
+9.1% yesterday
-
ES
Levels from HandelStats.com

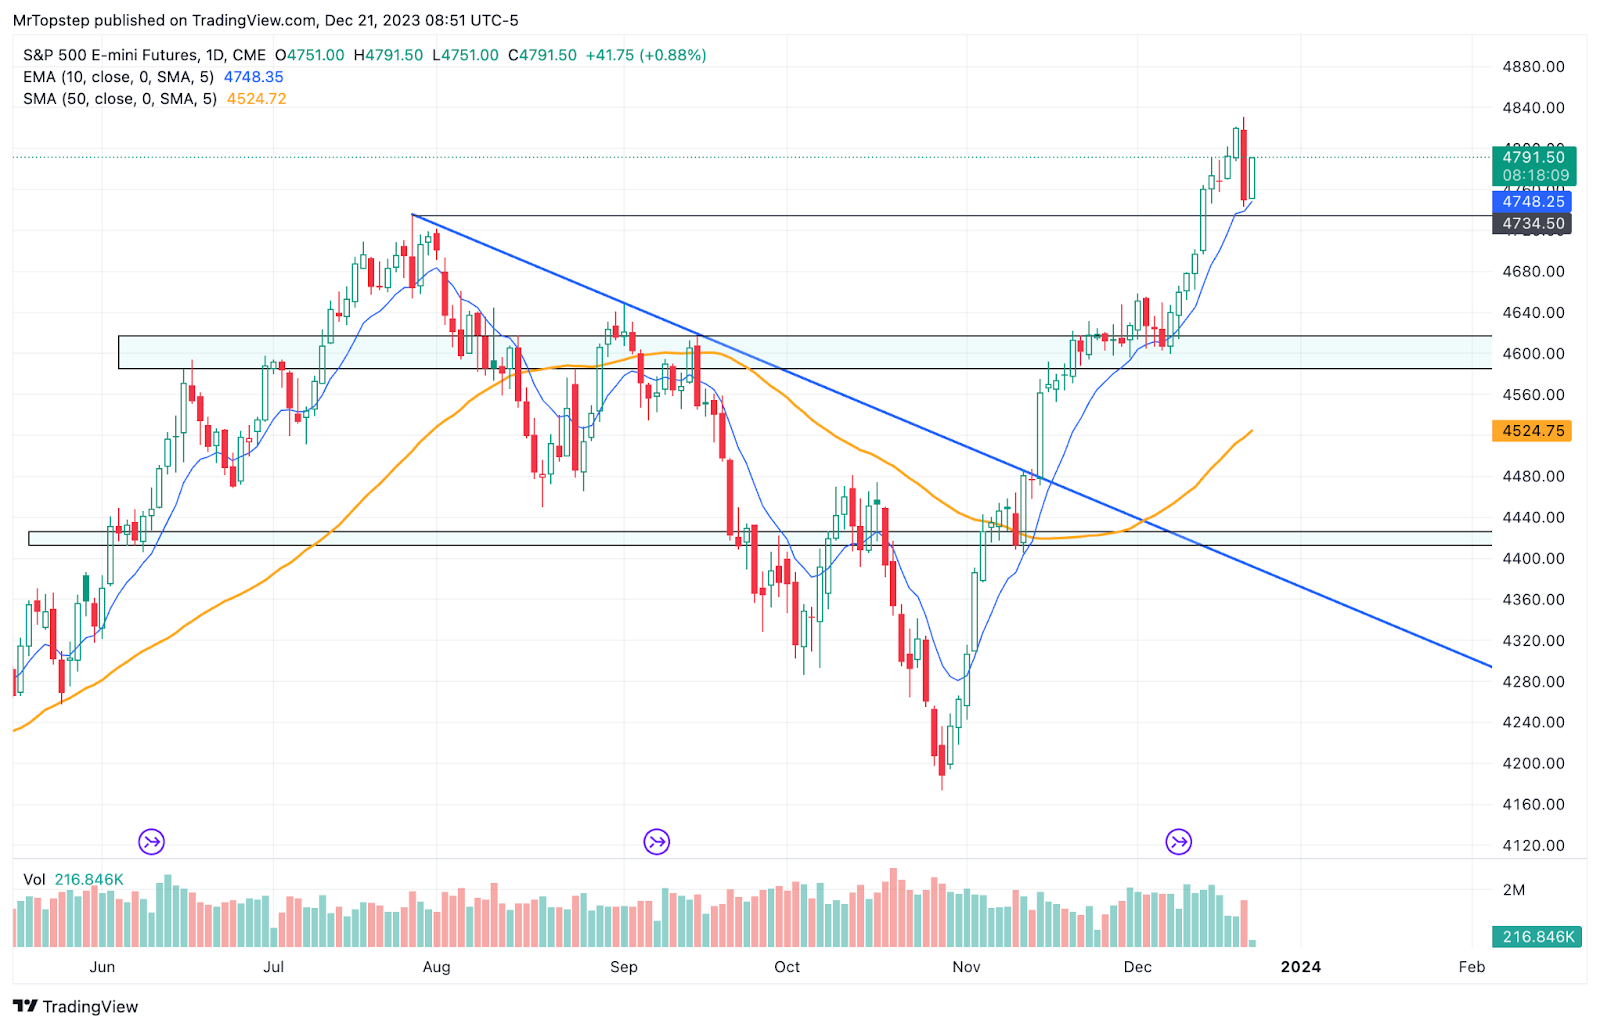
Daily chart of ES
-
Upside: Trade and hourly above 1 sd at 4775.15 targets 4780. Hourly close above there targets 4785.88. Hourly close above there targets 2 sd at 4803.79. Hourly close above 4809.50 targets 4816, then 4822.50.
-
(**Daily close above 4785.88 puts the market back on the march higher.)
-
-
Downside: Trade and hourly close below 4774.25 targets 4769.62, then 4765, then 4763.25. Trade and hourly close below there targets settlement 4746.50. Trade and hourly close below there targets 4742.25, hourly close below there targets 4726.88, then -1 sd at 4717.85. Hourly close below there targets 4701.75, then 4691.62, and -2 sd at 4689.21.
NQ
Daily chart of NQ
-
Upside: Trade and hourly close above 16901.75 targets 1 sd at 16919.42. Hourly close above there targets 16939.62, hourly close above there targets 16971.50, hourly close above there targets 17006.38. Hourly close above there targets 17040.75. Hourly close above there targets 2sd 17069.34.
-
(**Daily close above 16939.62 keeps the march up going.)
-
-
Downside: Trade and hourly close (now trading 16966) below 16939.62 targets 1 sd at 16919.42, then 16901.75, then 16890, then 16883. Hourly close back down below there turns the down move back on.
-
Below 16868 targets 16860.62 hourly close below there targets 16838.25. Hourly close below there targets 16803.25, then settlement at 16769.50. Horly close below there targets 16740.50, hourly close below there targets 166882, then -1 sd at 16619.58.
-
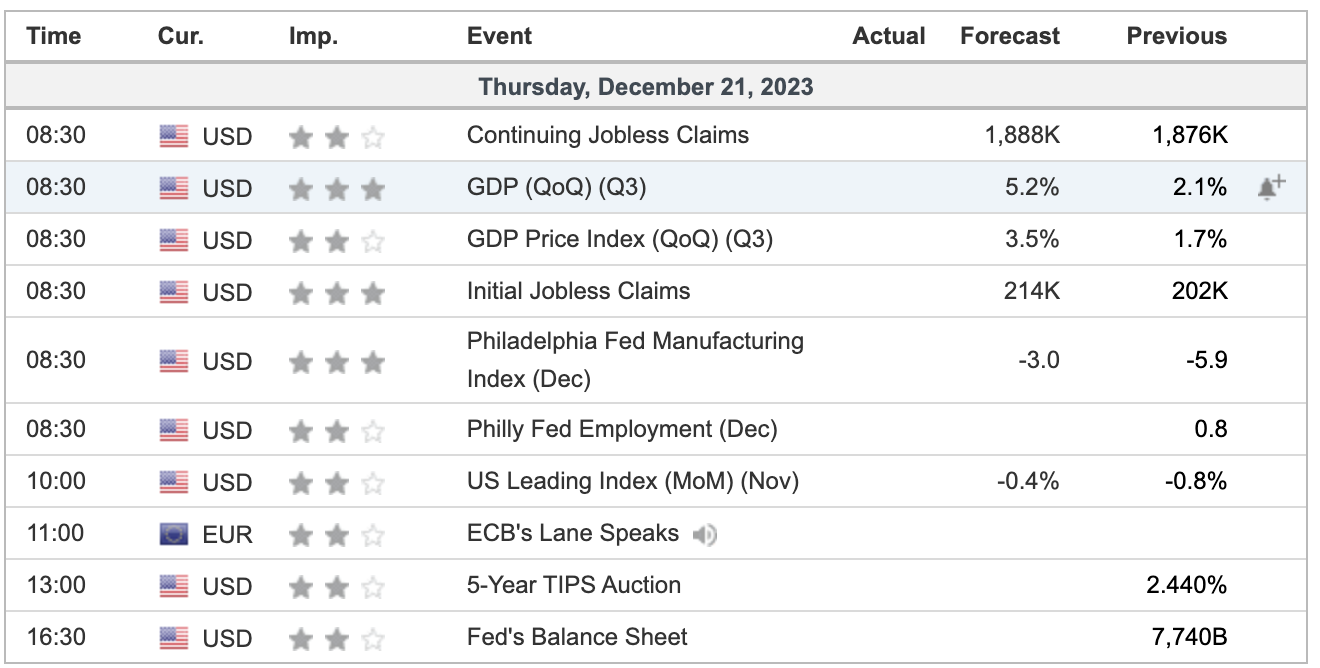
Economic Calendar
Disclaimer: Charts and analysis are for discussion and education purposes only. I am not a financial advisor, do not give financial advice and am not recommending the buying or selling of any security.
Remember: Not all setups will trigger. Not all setups will be profitable. Not all setups should be taken. These are simply the setups that I have put together for years on my own and what I watch as part of my own “game plan” coming into each day. Good luck!
Update your email preferences or unsubscribe here
© 2023 The Opening Print
228 Park Ave S, #29976, New York, New York 10003, United States
Comments are closed