This post goes out as an email to our subscribers every day and is posted for free here around 2 PM ET. To get your real-time copy, sign up for the free or premium version here: Opening Print Subscribe.
Yen Storm Rocks the Tape, Crypto Gets Clocked — But the We Smell a Year-End Ramp
Follow @MrTopStep on Twitter and please share if you find our work valuable!
Our View
YEN CARRY TRADE
Why did the ES and NQ fall late in the day yesterday?
Update on Japan’s Yield Spike and Its Market Ripples
The sharp surge in Japanese government bond (JGB) yields that began rippling through global markets on December 1 continues to exert pressure today, fueling concerns over yen carry trades and broader risk-off sentiment. Bank of Japan Governor Kazuo Ueda’s recent comments signaling a potential rate hike at the December 18–19 policy meeting have been the primary catalyst, pushing yields to multi-year highs and strengthening the yen.
This unwind is weighing on equities, cryptocurrencies, and high-risk assets, while highlighting vulnerabilities in leveraged global positions tied to Japan’s ultra-low rates.
Key Market Developments
-
JGB Yields: The 10-year JGB yield reached 1.88% on December 1—its highest in over 16 years—up 7 basis points from the prior session and 80 basis points higher year-over-year. Shorter-end yields are also spiking: the 2-year yield hit 1.02% (highest since 2008), and the 30-year yield touched 3.39%. Markets now see roughly an 80% chance of a BOJ rate hike in December.
-
Yen Strength: USD/JPY is trading around 155.47 today after dropping sharply, reflecting yen gains of 0.4–0.5% in the past session and ongoing repatriation flows. The pair remains under pressure and is down nearly 4% year-to-date.
-
Equity Impact: Japanese stocks are under strain, with the iShares MSCI Japan ETF (EWJ) at $82.53 today, down about 0.6% from yesterday’s close and 0.8% from premarket levels. Year-to-date, EWJ is still up ~25%, but the yield shock is testing that rally. U.S. growth stocks and AI-themed names are also sliding as money rotates to safety.
-
Crypto and Risk Assets: Bitcoin has stabilized near $87,000 after dipping below $84,000, extending a ~5% overnight drop and November’s brutal 17–21% decline. December historically sees median BTC returns of -3.2%, adding to bearish seasonality. Rising U.S. credit-card delinquency rates (now 12.9% of cardholders 90+ days late) are compounding macro worries.
Why This Matters: Carry Trade Unwind in Focus
The yen carry trade—borrowing cheap yen to chase higher returns in stocks, crypto, and emerging markets—has created massive global leverage. As JGB yields rise without BOJ intervention, these crowded positions are unwinding fast, reminiscent of past stress episodes.
The $83 billion U.S. Treasury settlement this week and fading hopes for a year-end “Santa rally” are amplifying the pain.
Outlook and Risks
-
Bull Case: A modest BOJ hike could stabilize the yen without crushing growth, allowing risk assets to recover. Seasonal inflows and holiday buying interest could still push Bitcoin toward $97,000+ resistance.
-
Bear Case: Further yield spikes could drive USD/JPY below 155, triggering forced deleveraging and deeper sell-offs across equities and crypto.
-
Trade Ideas: Consider defensive positioning—short high-beta growth, go long yen proxies, or trim Japan exposure (hold EWJ for its 2% yield but lighten up if 10-year JGB breaks 2%).
This situation remains highly fluid. Volatility is likely to stay elevated until the BOJ’s December decision. Keep a close eye on USD/JPY and JGB yields for the next directional cues.
Our View
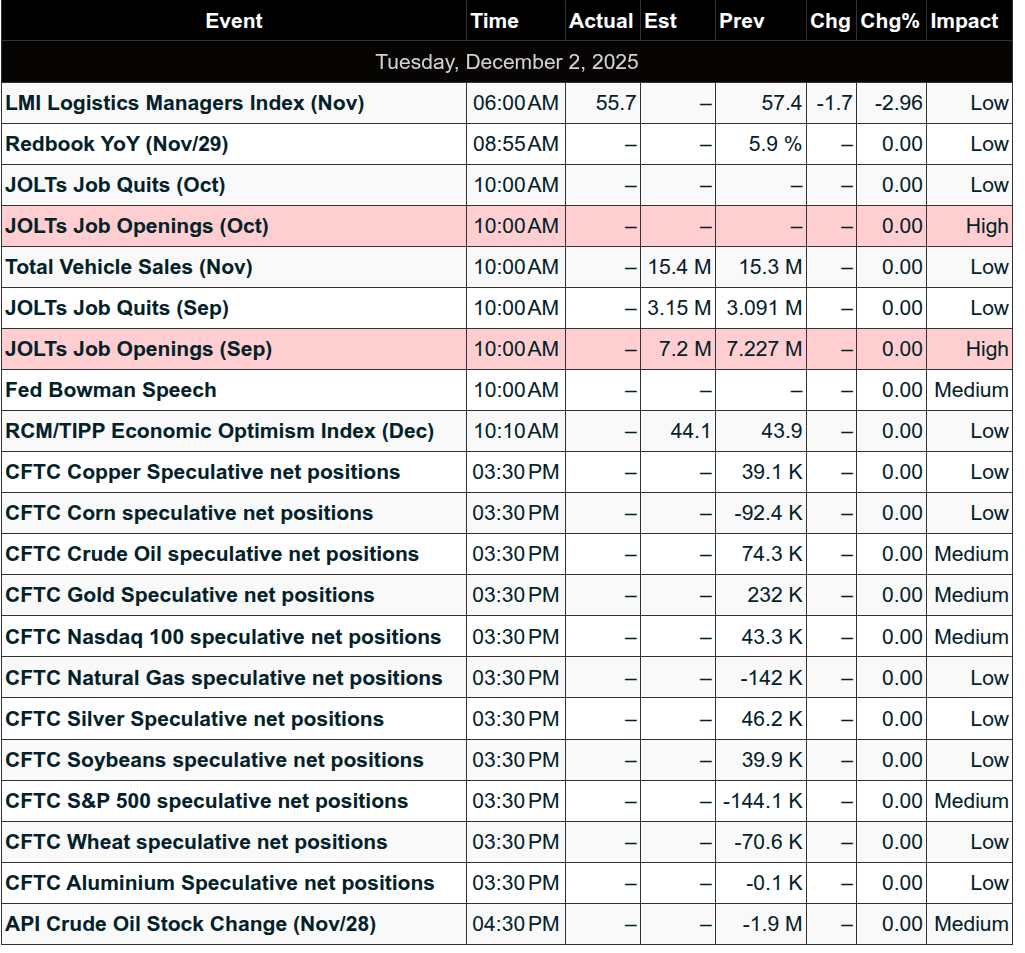
The yen carry trade weakness should be temporary. There are no economic releases today, leaving the Japan-driven yield spike and carry-trade unwind as the dominant market driver.
However, tomorrow (December 3), we get key reports from:
-
ADP Employment Change (7:15 AM ET, consensus +10K),
-
Industrial Production MoM (8:15 AM ET, consensus +0.1%), and
-
ISM Services PMI (9:00 AM ET, consensus 52.1).
Obviously, Wednesday is going to be a big day for the index markets.
Our Lean
I think whenever you see the ES down 40 to 60 points, the ES is a buy. I also think this will remain the case right into the end of the year. The only thing I can say is the patterns remain the same: rally early, pull back, and rally again. Santa is coming this year, and I say the odds are strong for a good year-end push.
Our lean: Key upside levels I’m watching are 6870, 6890, 6920, and 6943, and stops that run from the 6949 level all the way up to 6980. I said yesterday that the ES is going to 7100.
We shall sell the early rallies and buy the pullbacks—or just be patient and buy the pullbacks!
6780–6810 is a brick wall.
From Jeff Hirsch at @AlmanacTrader #TradersAlmanac:
Do yourself a favor and grab the 2026 edition now! Link below.

Real Santa Claus Rally: It’s An Indicator!
As Yale Hirsch’s now famous line states: “If Santa Claus should fail to call, bears may come to Broad and Wall.”
Typical early December seasonal weakness sets up the Santa Claus Rally well. The Street has been buzzing about the Santa Claus Rally for months now. Most still get it wrong. It’s not the year-end rally, the Q4 rally that runs from Halloween through January. Yes, November, December and January are the best three months of the year, but they are not the Santa Claus Rally.
Santa Claus Rally was devised by Yale Hirsch in 1972 and published in the 1973 Stock Trader’s Almanac. The “Santa Claus Rally” is the last 5 trading days of the year, plus the first 2 of the New Year. This year it begins on the open on December 24 and lasts until the second trading day of 2026, January 5. Average S&P 500 gains over this seven-trading-day range since 1950 are a respectable 1.3%.
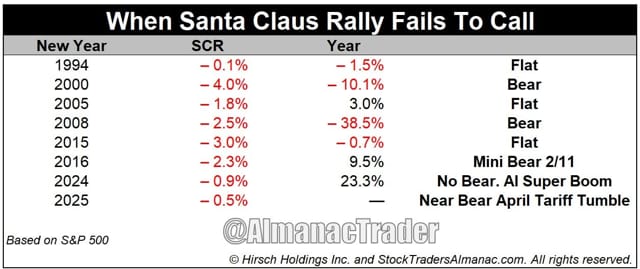
Failure to have a Santa Claus Rally tends to precede bear markets or times when stocks could be purchased at lower prices later in the year. Down SCRs were followed by flat years in 1994, 2005 and 2015, two nasty bear markets in 2000 and 2008, a mild bear that ended in February 2016 and the Tariff Tantrum early in 2025.
This is the first leg of our January Indicator Trifecta (2026 STA p 20), which includes the “First Five Days” (2026 STA p 16) and the full month “January Barometer” (2026 STA p 18), also invented and named by Yale Hirsch in 1972. This January Trifecta helps us affirm or readjust our outlook. When we hit this Trifecta and all three are positive, S&P is up 90.6% of the time (29 of 32 years) with an average gain of 17.7%.
Based upon the outcome of these three indicators, we may adjust our outlook for the balance of Q1 and 2026. Until then, we remain bullish as this is the seasonally favorable period for stocks. Valuations are a concern, but economic data is holding up, the Fed is cutting interest rates, and the market continues to track seasonal trends and patterns rather closely.
Stay tuned for more on the rest of my January Indicator Trifecta and sign up for my newsletter to get my official readings and analysis. And get the 2026 Stock Trader’s Almanac as a free bonus. 55% Off Cyber Monday Offer ends today!
Guest Post: Tom Incorvia – Blue Tree Strategies
In recent articles, I’ve continued to use the SPY chart as a tactical roadmap for anticipating market direction. Two price zones remain central to the current structure.
First, the 682–684 range has served as a meaningful support band, consistently attracting buyers and demonstrating sustained demand. Price action has repeatedly validated this area as a key floor.
On the opposite end, the 659–665 zone has acted as a durable demand shelf as well, preventing deeper pullbacks and confirming the presence of firm buying interest.
Additionally, the 675.4 level (highlighted by the red line in prior charts) continues to play an influential role. Since October, this level has functioned as both support and resistance, underscoring its significance as a pivot point for market participants.
Taken together, these areas outline the primary parameters within which SPY has been oscillating, and they remain critical reference points for evaluating future movement.
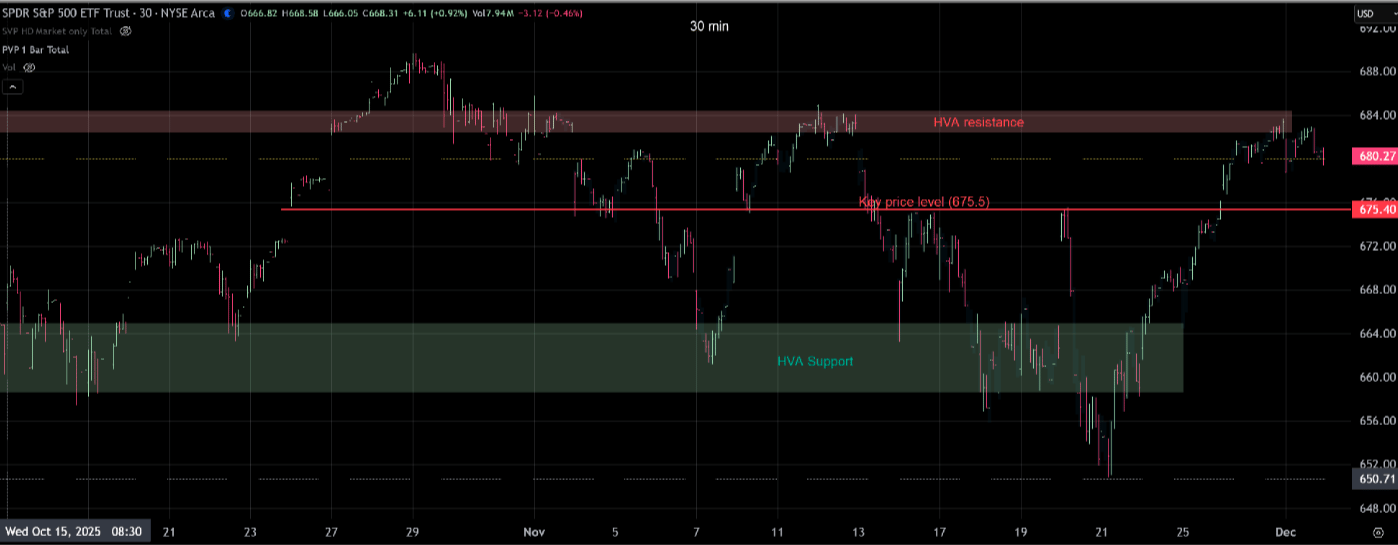
The red-boxed resistance zone served as our upside target last week. Following the demand-driven advance that began on October 21st, price action moved decisively into this area. With SPY now testing resistance, a moderation in the rally would be a reasonable expectation in the near term.
From a tactical standpoint, the bullish bias remains intact as long as prices hold above the 675.5 level. Should buyers maintain control and push decisively through the identified resistance zone, the setup would favor a continuation move—potentially initiating a bullish expansion into higher distribution levels.
The Staples sector (XLP) is particularly noteworthy because it often behaves as a counter-indicator to broad market sentiment. During periods when traders are reducing exposure to risk, capital frequently rotates into Staples as a defensive allocation. As a result, tracking XLP can offer valuable insight into shifts in market posture, providing an early indication of potential changes in the direction of the broader equity market.
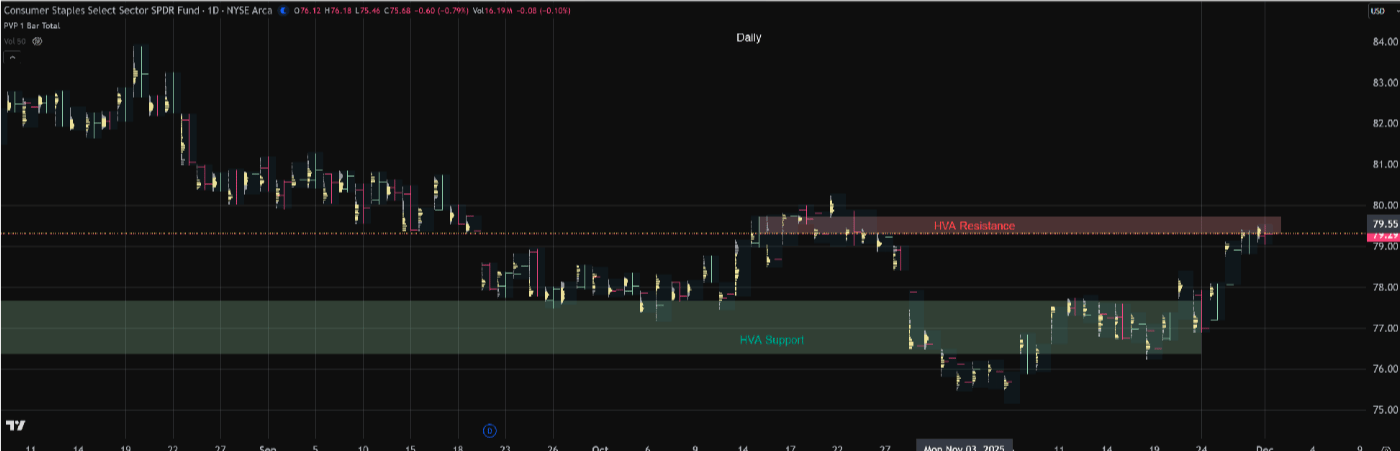
Prices have advanced—alongside the broader market—into a defined resistance zone. The market’s reaction at this level will be critical in determining the next potential swing. At this stage, a sideways or balancing phase appears to be the higher-probability outcome as buyers and sellers negotiate control.
However, a decisive breakout above the resistance area could signal the start of a bullish expansion and may also begin to exert upward pressure on the major indices, reinforcing the broader market’s strength.
Tom Incorvia began his career in financial services in 1987 and has amassed over three decades of experience navigating the complexities of the markets. His career spans both the buy-side and sell-side of the trading desks, having served as Vice President of Equity Trading and later as General Partner of a hedge fund. This dual perspective has provided him with a unique and well-rounded understanding of market behavior.
You can purchase Tom’s Course on Volume Profile here.
Market Recap
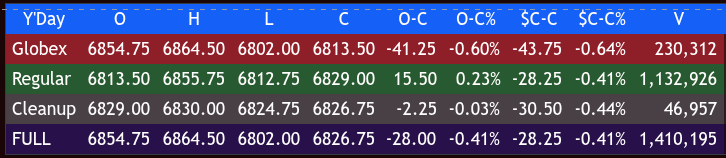
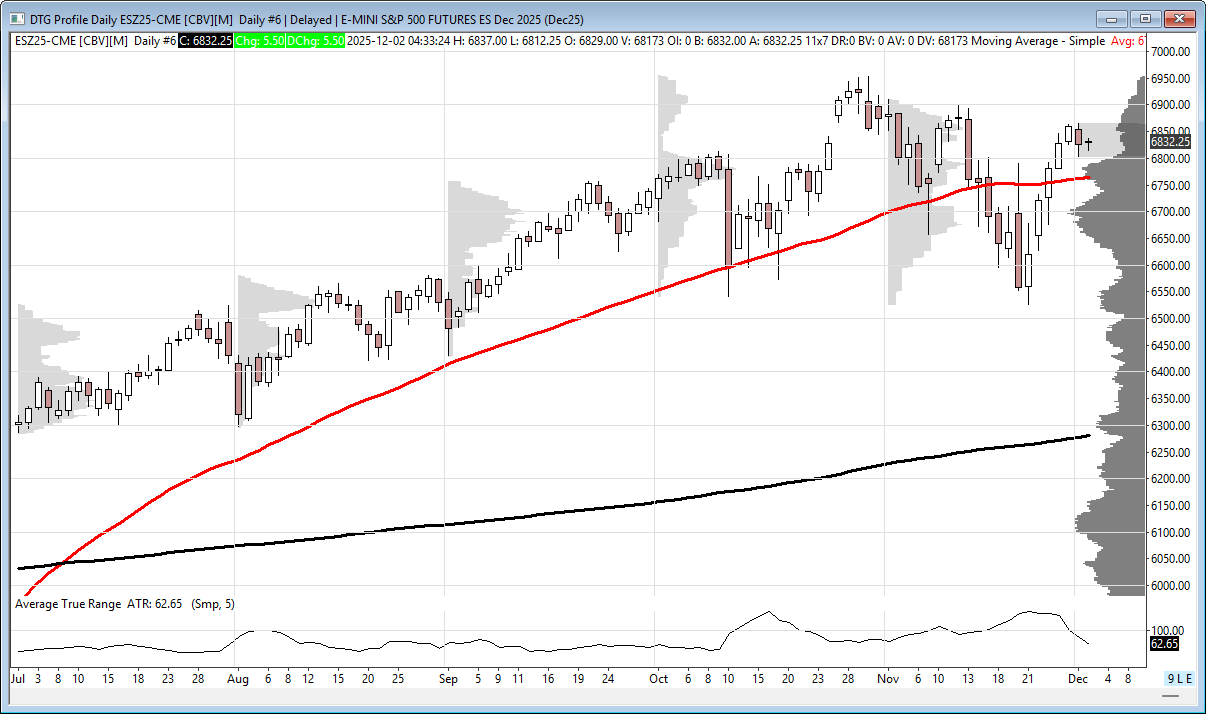
The ES sold off down to 6802.00 on Globex and opened Monday, the first trading day of December, at 6813.50, down 43.75 points. It made a 6811.75 low and rallied up to 6845.00 at 10:00, then sold off down to 6813.75 at 10:35.
After the high, the ES rallied back up to 6830.00 at 10:40, then pushed up to 6844.00 at 10:55, dropped down to the VWAP at 6826.75, rallied up to 6855.75 at 2:01, sold off down to 6823.50, rallied again to 6836.50, and then fell into an 8-handle chop/back-and-fill pattern.
The ES started going bid at 3:35 and traded up to 6836.00. The 3:50 cash imbalance showed $920 million to sell, which grew to $2.8 billion to sell, leading the ES to trade down to 6819.50 before trading 6829.00 on the 4:00 cash close. After the close, the ES basically flatlined, settling at 6826.75, down 28.25 points or -0.41%.
The NQ settled at 25,391.25, dpwmn 90.75 points or -0.36% on the day. Bitcoin got pounded, down more than -5% to a 1-week low. WTI climbed more than 1% to a one-week high, and silver traded up to a new all-time high of $58.56 per ounce.
In the end, the gap lower got bought. In terms of the ES’s and NQ’s overall tone, both were firm. In terms of the ES’s overall trade, volume was steady all day at 1.417 million contracts traded.
MiM
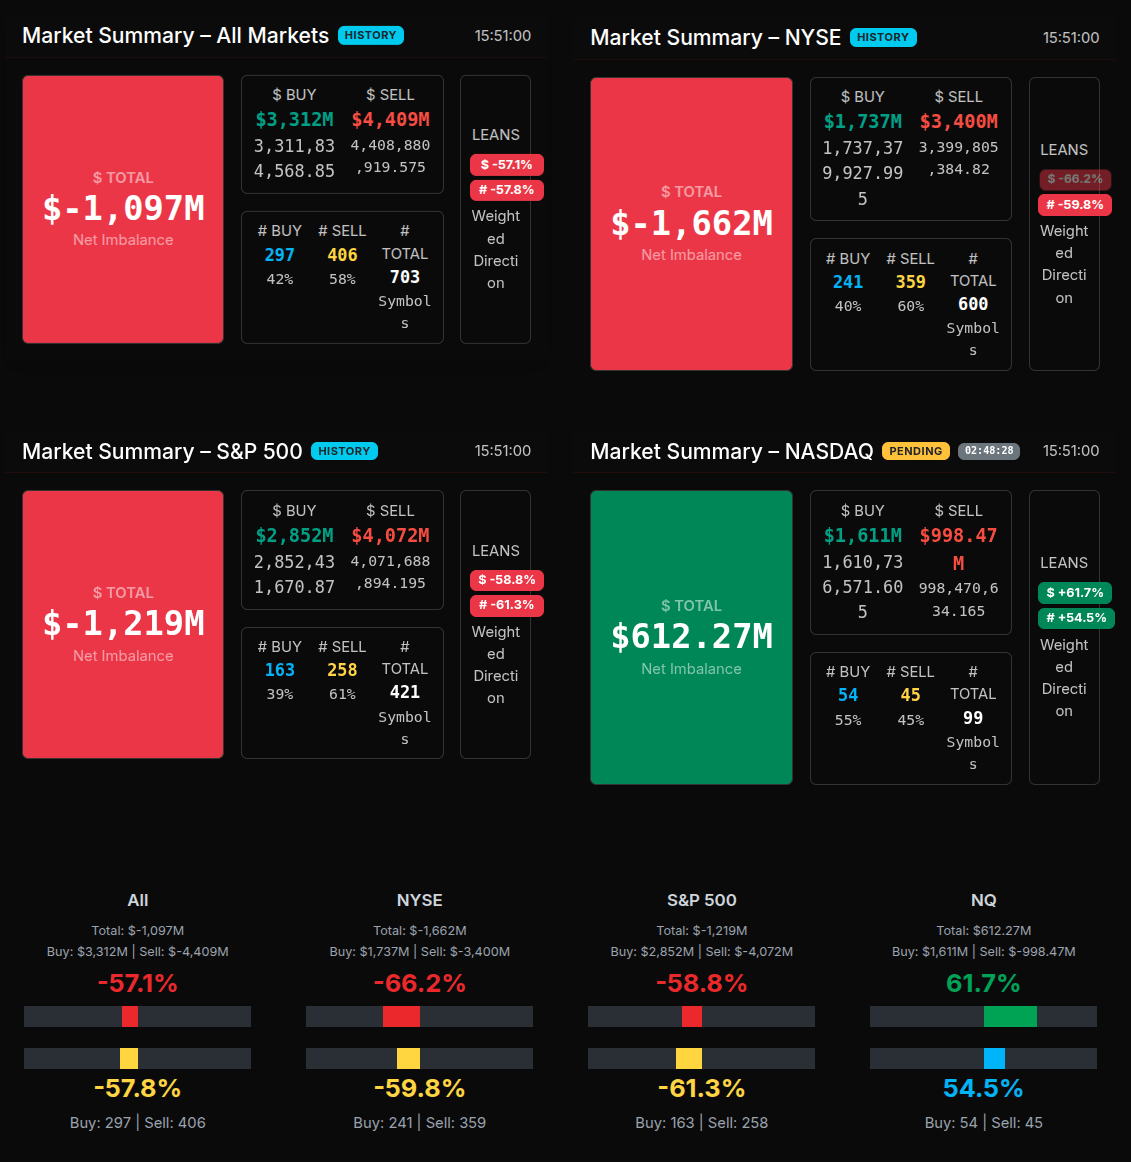
Market-on-Close Recap – MiM
The Market-on-Close auction opened with a heavy sell bias and stayed that way. By 15:51, the sell pressure exploded to –$1.097B, driven by $4.409B in paired sell interest versus $3.312B in buys. From there, the imbalance remained deeply negative, holding between –$1.2B and –$3.1B until the final prints at 16:00, which closed at –$1.93B.
Sector flow confirmed the broad sell pressure. Nine of eleven sectors were net-sold, led by Energy (–84.4%), Utilities (–83.0%), Industrials (–71.1%), Basic Materials (–71.5%), Healthcare (–67.1%), and Consumer Cyclical (–65.9%). These readings are well past the –66% threshold that signals wholesale institutional selling. Technology was the lone standout, posting a strong +64.4% lean on $571.25M net buy interest. Communication Services also printed a notable +62.1% buy lean.
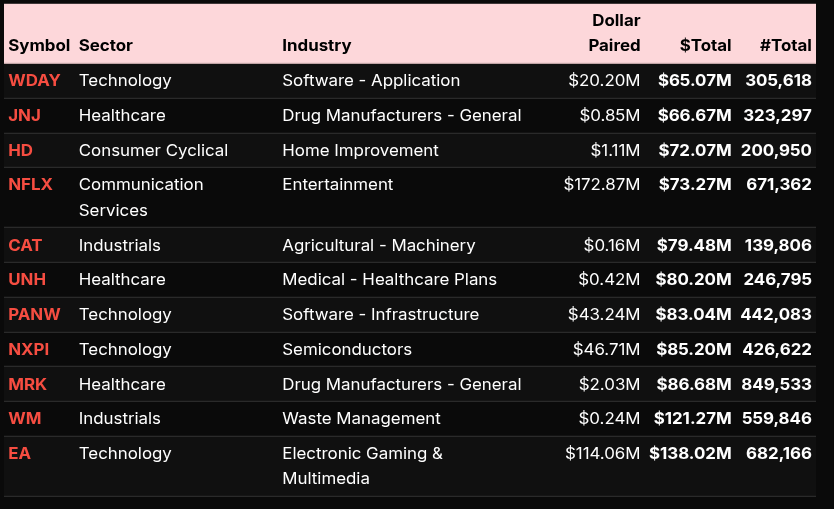
Big money buying was concentrated in large-cap tech: NVDA ($306.07M), AAPL ($151.84M), MSFT ($109.03M), INTU ($52.42M), and EA ($138.02M) all showed meaningful positive flow. Consumer names like AMZN ($115.6M) and COST ($70.84M) also attracted institutional bids. On the sector-level most-bought list, NFLX ($73.27M) and WDAY ($65.07M) stood out.
On the sell side, pressure was broad across Financials, Industrials, Energy, and Healthcare. Names like BAC ($109.52M), JPM ($113.25M), MRK ($86.68M), UNH ($80.20M), and CAT ($79.48M) were notable for their sustained net outflows.
Auction behavior showed no rotation: the #PCT and $PCT stayed pinned between –57% and –72% from 15:51 through 15:59. This was pure directional sell-side dominance with no mid-auction reversal.
The only pocket of strength came from the Nasdaq complex. At 15:51, while the NYSE and S&P 500 printed heavy negatives, the Nasdaq showed a +$612.27M net buy imbalance with +61.7% leans and 54.5% weighted direction — clear evidence of concentrated end-of-day tech accumulation even as the broader market was being sold wholesale into the close.


Technical Edge
Fair Values for November 25, 2025:
-
SP: 10.88
-
NQ: 45.61
-
Dow: 61.72
Daily Market Recap 📊
For Monday, December 1, 2025
-
NYSE Breadth: 37% Upside Volume
-
Nasdaq Breadth: 37% Upside Volume
-
Total Breadth: 37% Upside Volume
-
NYSE Advance/Decline: 35% Advance
-
Nasdaq Advance/Decline: 31% Advance
-
Total Advance/Decline: 32% Advance
-
NYSE New Highs/New Lows: 91 / 17
-
Nasdaq New Highs/New Lows: 120 / 111
-
NYSE TRIN: 0.93
-
Nasdaq TRIN: 0.74
Weekly Breadth Data 📈
For Week Ending Friday, November 28, 2025
-
NYSE Breadth: 69% Upside Volume
-
Nasdaq Breadth: 71% Upside Volume
-
Total Breadth: 70% Upside Volume
-
NYSE Advance/Decline: 85% Advance
-
Nasdaq Advance/Decline: 80% Advance
-
Total Advance/Decline: 82% Advance
-
NYSE New Highs/New Lows: 207 / 64
-
Nasdaq New Highs/New Lows: 384 / 256
-
NYSE TRIN: 2.29
-
Nasdaq TRIN: 1.56
ES & NQ Levels (Premium only)

ES – Z Levels
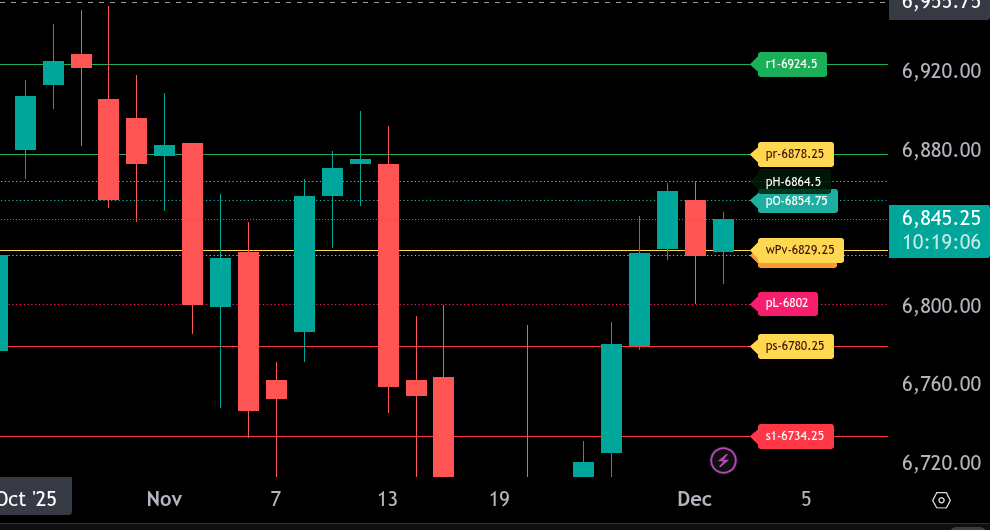
The bull/bear line for the ES is at 6829.25. ES is currently trading above it near 6845.75, showing early strength in the Globex session.
Upside, the first resistance sits at 6854.75. A push through there opens the door toward the upper intraday target at 6878.25. Above that, the next major level is 6924.50.
On the downside, immediate support rests at 6826.75. Below that, the next key support comes in at 6802.00. If selling deepens, the lower intraday target sits at 6780.25, followed by a broader support level at 6734.25.
Overall, holding above 6829.25 keeps the tone bullish. A sustained move back below that level shifts the bias back toward the support zones outlined.
NQ – Z – Levels
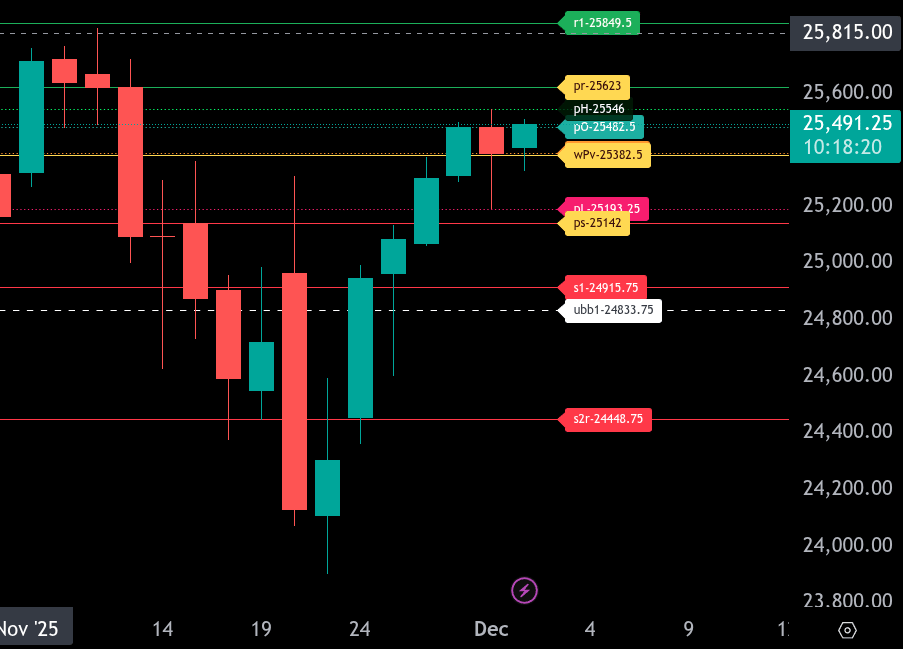
The bull/bear line for the NQ is at 25,382.5. Price is currently above this level, trading near 25,491.00 on Globex, showing early strength. Holding above 25,382.5 keeps the tone bullish.
Upside, the immediate resistance is 25,482.5. Above that, the next resistance comes at 25,546, and the upper range target sits at 25,623. A sustained move through 25,623 opens the door toward 25,849.5.
On the downside, support begins at 25,401.25. Losing that shifts momentum back toward the bull/bear line at 25,382.5. Below it, support levels sit at 25,193.25, then 25,142, with the lower range target at 24,915.75 if the session turns risk‑off.
Overall, the path of least resistance remains higher while holding above 25,382.5. A break under that level turns the session defensive and favors tests of the lower supports.
Calendars
Economic Calendar
Today
Important Upcoming

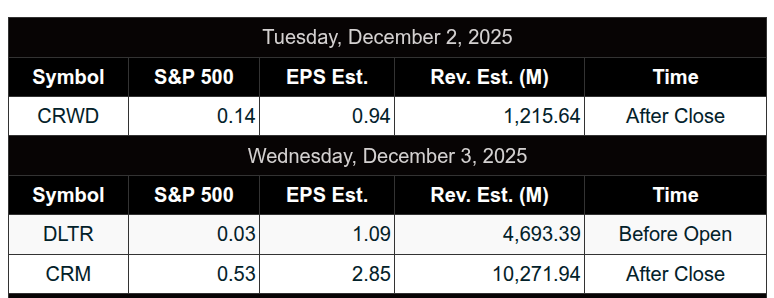
Earnings
Trading Room Summaries
Polaris Trading Group Summary – Monday, December 1, 2025
Yesterday marked the beginning of the final trading month of 2025 and a textbook Cycle Day 1. True to expectation, the day started with a normal decline, followed by responsive buying off key support zones. A strong focus on disciplined trade execution and managing expectations set the tone for the room, with several setups from the pre-market trade plan playing out well intraday.
Key Highlights & Positive Trades:
-
Trade Setup #3 (Support Buy 6809–6813 ES) was the standout play early in the session.
-
Manny executed this well, scaling +5 and +10 and holding runners. He later confirmed the setup’s efficacy, even though he missed a second opportunity.
-
This zone was also the Cycle Day 1 Violation Target, and as David noted, “buyers responded” cleanly, validating the level.
-
-
Crude Oil (CL) Open Range Long:
-
David called this early, and all long targets were fulfilled.
-
Reinforced the importance of watching CL OR setups in tandem with equity markets.
-
-
Dynamic Trade around 6832 (Manny):
-
Confluence of LVN + VWAP + Fib Cluster led to another solid +5, +10 scale.
-
Runners aimed toward ONH with targets around 6856–6864, showing excellent real-time tape reading.
-
Lessons & Insights:
-
Cycle Day Awareness:
David reiterated how the Cycle Day framework guided expectations for a pullback into support (6825–6808). The market played to script, validating the approach. -
Patience is Power:
The team emphasized waiting for high-probability setups. As one quote shared in chat stated:
“Waiting is not laziness. Waiting is discipline.” -
Tape and Profile Readings Matter:
-
Manny observed that profile structure was poor early on, advising caution.
-
A divergence in MES/ES lows overnight also caught trader attention—highlighting arbitrage opportunities and real-time observational skill development.
-
-
End-of-Day Caution:
What started as a potential “Mutual Fund Monday” ended with a twist:-
Massive MOC sell imbalance, growing from $920M to $2.8 Billion, led to a late-day dump.
-
David highlighted how longs got trapped near VWAP—an important lesson in not assuming institutional flows always lift into the close.
-
Summary:
The day unfolded with clarity and discipline:
-
Support zones held, and premarket setups paid well for those patient enough to execute.
-
The CL open range trade was clean.
-
Cycle Day 1 structure guided expectations effectively.
-
Traders were encouraged to remain focused through December, as “every handle counts” in this final act of 2025.
David’s leadership and room collaboration kept the day sharp and educational, ending with the reminder:
“First scene of the Final Act for 2025 in the books…”
Discovery Trading Group Room Preview – December 2, 2025
Stocks broke a 5-day winning streak Monday, weighed down by inflation worries, stretched valuations, and skepticism around AI spending ROI. Despite a tough month for tech, both the S&P 500 and Dow ended November higher.
Macro & Fed:
-
Fed rate cut expectations for December hold steady at 87.2% (CME FedWatch).
-
The OECD raised its global growth outlook to 3.2% for 2025, citing improvements since June, though protectionist trade policy could slow 2026 growth to 2.9%.
Crypto & Tech:
-
Bitcoin proxy MSTR is down 34% in November, 60% from July highs; leveraged ETFs MSTX and MSTU among the worst-performing funds YTD.
-
Samsung unveiled its Galaxy Z TriFold, beating Apple to market with a foldable phone. Apple’s version isn’t expected until Fall 2026.
Earnings:
-
Premarket: KEP, BNS, SIG, UNFI
-
After-hours: AEO, CRWD, GTLB, MRVL, OKTA, PSTG
-
Wednesday AM: DLTR, M, RY, THO, AI, FIVE, PVH, CRM, SNOW
Other:
-
No major economic data today. Fed’s Bowman testifies at 10:00am ET.
-
Market volatility continues to fade; ES 5-day ADR at 80 pts.
-
No whale bias overnight (light large trader volume).
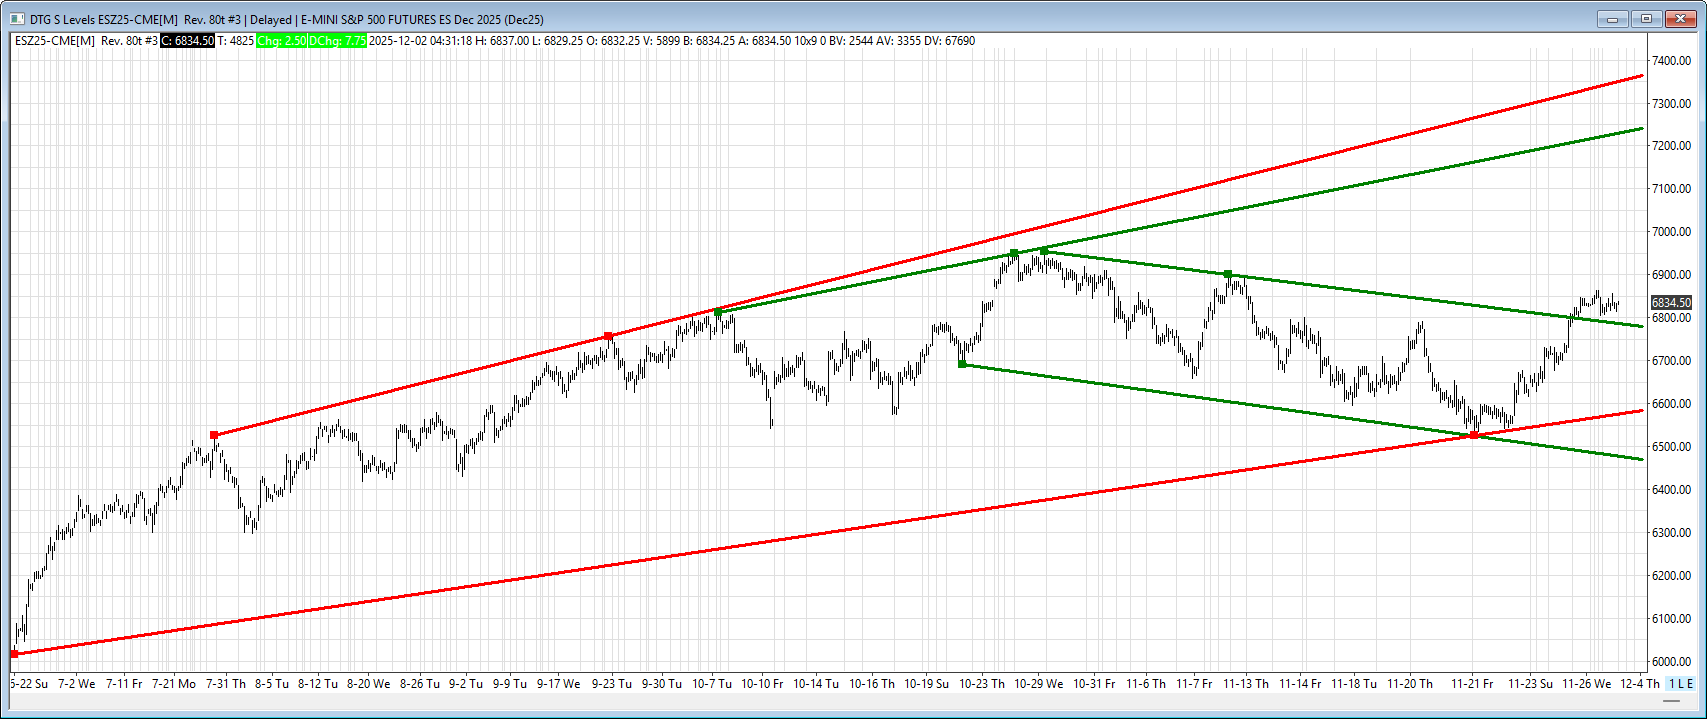
Key ES Levels:
-
Resistance (TL R): 7240/45, 7370/75
-
Support (TL S): 6787/84, 6579/84, 6465/60
-
50-day MA: 6764.50 – remains loose support. Bulls have room to run.
Affiliate Disclosure: This newsletter may contain affiliate links, which means we may earn a commission if you click through and make a purchase. This comes at no additional cost to you and helps us continue providing valuable content. We only recommend products or services we genuinely believe in. Thank you for your support!
Disclaimer: Charts and analysis are for discussion and education purposes only. I am not a financial advisor, do not give financial advice and am not recommending the buying or selling of any security.
Remember: Not all setups will trigger. Not all setups will be profitable. Not all setups should be taken. These are simply the setups that I have put together for years on my own and what I watch as part of my own “game plan” coming into each day. Good luck!
This post goes out as an email to our subscribers every day and is posted for free here around 2 PM ET. To get your real-time copy, sign up for the free or premium version here: Opening Print Subscribe.
Comments are closed