This post goes out as an email to our subscribers every day and is posted for free here around 2 PM ET. To get your real-time copy, sign up for the free or premium version here: Opening Print Subscribe.
Follow @MrTopStep on Twitter and please share if you find our work valuable!
Our View
I would like to think that things will go without a shake, rattle, and roll, but that seems unlikely. Let’s face it: we live in an ever-changing world that is constantly evolving.
Today, there is only one economic report, no real earnings, and the week 4 Friday expiration. It’s 11:00 PM Thursday, and the ES is basically unchanged.
Will the PitBull rule about making a low on Thursday/Friday and holding into expiration play out? I still think the ES is in a big back-and-fill pattern, but if oil races higher, stocks will be under selling pressure.
Our Lean
We live in uncertain times characterized by an ongoing war, credit issues, spiraling government debt, and persistent inflation, alongside concerns regarding insider trading, job layoffs, and intense geopolitical competition. In this volatile environment, the market’s sharp “rips and dips” are likely to persist until a meaningful Middle East deal is reached.
For now, however, markets remain resilient because traders continue to maintain long positions, operating on the anticipation that a diplomatic resolution will eventually materialize. But what if a deal doesn’t happen? What if it drags on for 4 or 6 months? I don’t think the markets will hold up so well then.
If there is one thing that can drive the ES lower, it’s higher crude oil prices, which traded up to $98.39 yesterday, the highest level since 04/07/26 when it traded up to 101.17. The headline spike sell-off in the index markets has been good buy ops, and I suspect that will continue.
Our lean: I think it will be another day of two-way price action. I can’t rule out selling a big early rally and buying the drops, but I also think you have to be very patient. If you are up money this week, trade less and pick your spots better.
Below are the Claude AI ES levels. I know what format works the best, but I have yet to learn how to use the same codes. There is a new AI product I can combine with Claude that I believe will make it way better:
ES FUTURES — KEY LEVELS
(min gap 8 pts, floor 6980)
04/23/2026 | 5D | Last: 7143.50 (-27.75 / -0.39%)
Market State
Value Area: 7115.43 — 7150.47
(35.0 pts wide, 32% of range)
POC: 7136.92
IB: 7127.21 — 7198.79
-
vs VA: INSIDE — reversion bias
-
vs IB: INSIDE IB
-
vs Pivot: BELOW PP
-
vs Wk Mid: ABOVE wk mid
Key Levels
Upside Levels
-
R3: 7240.83 (+97.33) — 3rd resistance, extreme extension
-
Ext R2: 7220.55 (+77.05) — 2× VA above VAH, trend day target
-
R2: 7206.92 (+63.42) — 2nd resistance, trend day target
-
IB High: 7198.79 (+55.29) — Acceptance above = bull day
-
R1: 7189.08 (+45.58) — Close above = bullish
-
7175 (Psych): 7175.00 (+31.50) — Order flow cluster
-
Pivot (PP): 7155.17 (+11.67) — Bull/bear divider
-
Last Close: 7143.50 (0.00) — Current settlement
Downside Levels
-
Weekly Mid: 7130.50 (-13.00) — Bias divider
-
HVN: 7120.83 (-22.67) — High activity, S/R magnet
-
S2: 7103.42 (-40.08) — Trend day support
-
S3: 7085.58 (-57.92) — Major downside target
-
LVN: 7076.63 (-66.87) — Thin zone, fast moves
-
S4: 7067.75 (-75.75) — Capitulation level
-
7050 (Psych): 7050.00 (-93.50) — Order flow cluster
-
7025 (Psych): 7025.00 (-118.50) — Order flow cluster
-
7000 (Psych): 7000.00 (-143.50) — Order flow cluster
-
6980 (Psych): 6980.00 (-163.50) — Order flow cluster
Quick Reference
-
POC: 7136.92 | VAH: 7150.47 | VAL: 7115.43
-
PP: 7155.17 | R1: 7189.08 | S1: 7137.33
-
IB: 7127.21 — 7198.79
-
Weekly Range: 7075.25 — 7185.75
-
Mid: 7130.50
-
Guest Posts:

Get instant access to our partners’ real-time market data and insights not available anywhere else. Here is last night’s Founder’s note getting you ready for today’s market and explaining the constraints in yesterday’s market. – MrTopStep
Founder’s Note:
PM Note
The stock market pulled back on Thursday amid a spike in oil prices and rising geopolitical uncertainty. Brent crude traded above $100 at the time of writing.
SPX tested our Risk Pivot at 7050 and closed at 7,108 (-0.4%). The resistance at 7,150 and support at 7,050 we mentioned in the AM Note held well for the session. The 101-point intraday range exceeded the implied move of 68 points, suggesting implied volatility (IV) may be underpricing potential risk.
VIX closed at 19.3 (+2.1%), while VVIX closed at 98.6 (-0.2%).
S&P 500 HIRO (delta flow) reversed from +$1.5B to -$1.5B between ~11:30am–12:00pm ET, with SPX spot rolling over alongside the shift in flow. Around 1:00pm ET, HIRO delta accelerated lower again, reaching roughly -$2B. At ~1:45pm ET, 5k lots 0DTE put spreads opened near the 7035 strike, and HIRO flow began to reverse higher. This combination of 0DTE put spread activity and improving HIRO flow provided near-term support to the market.
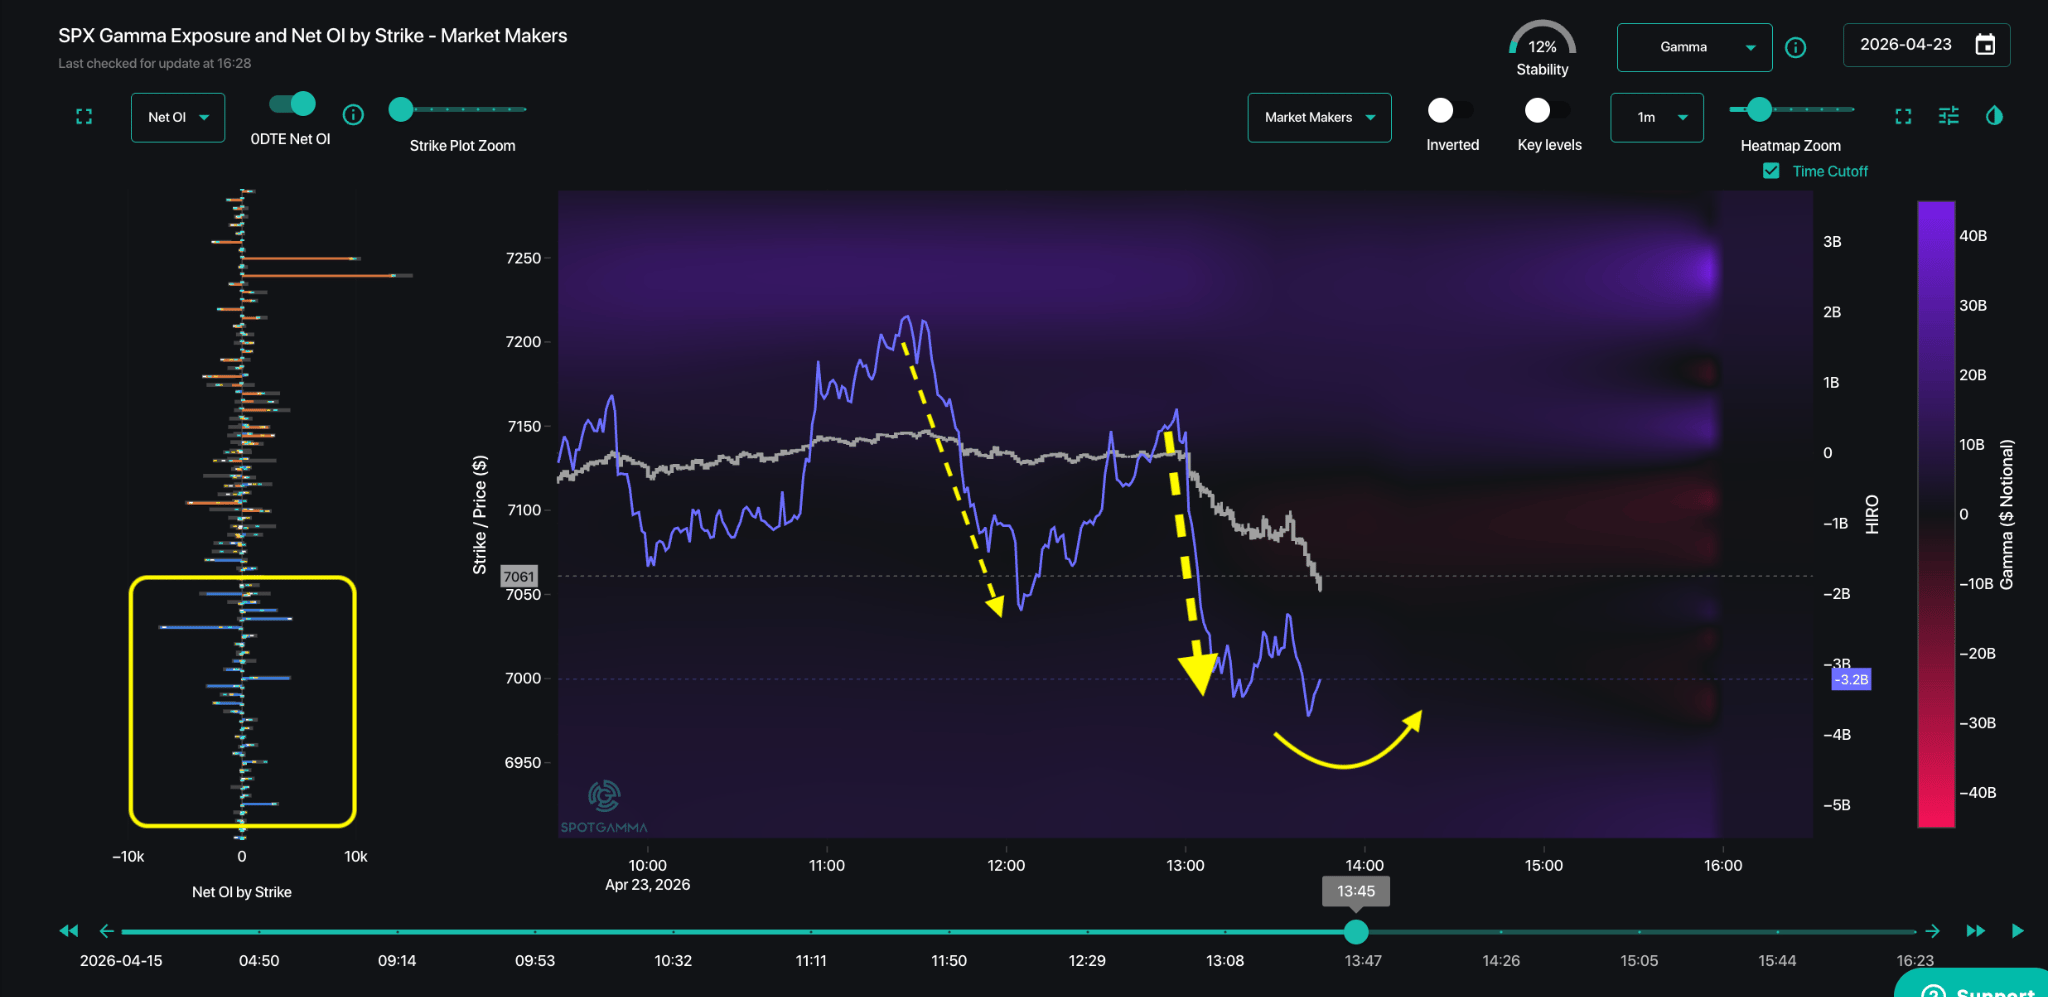
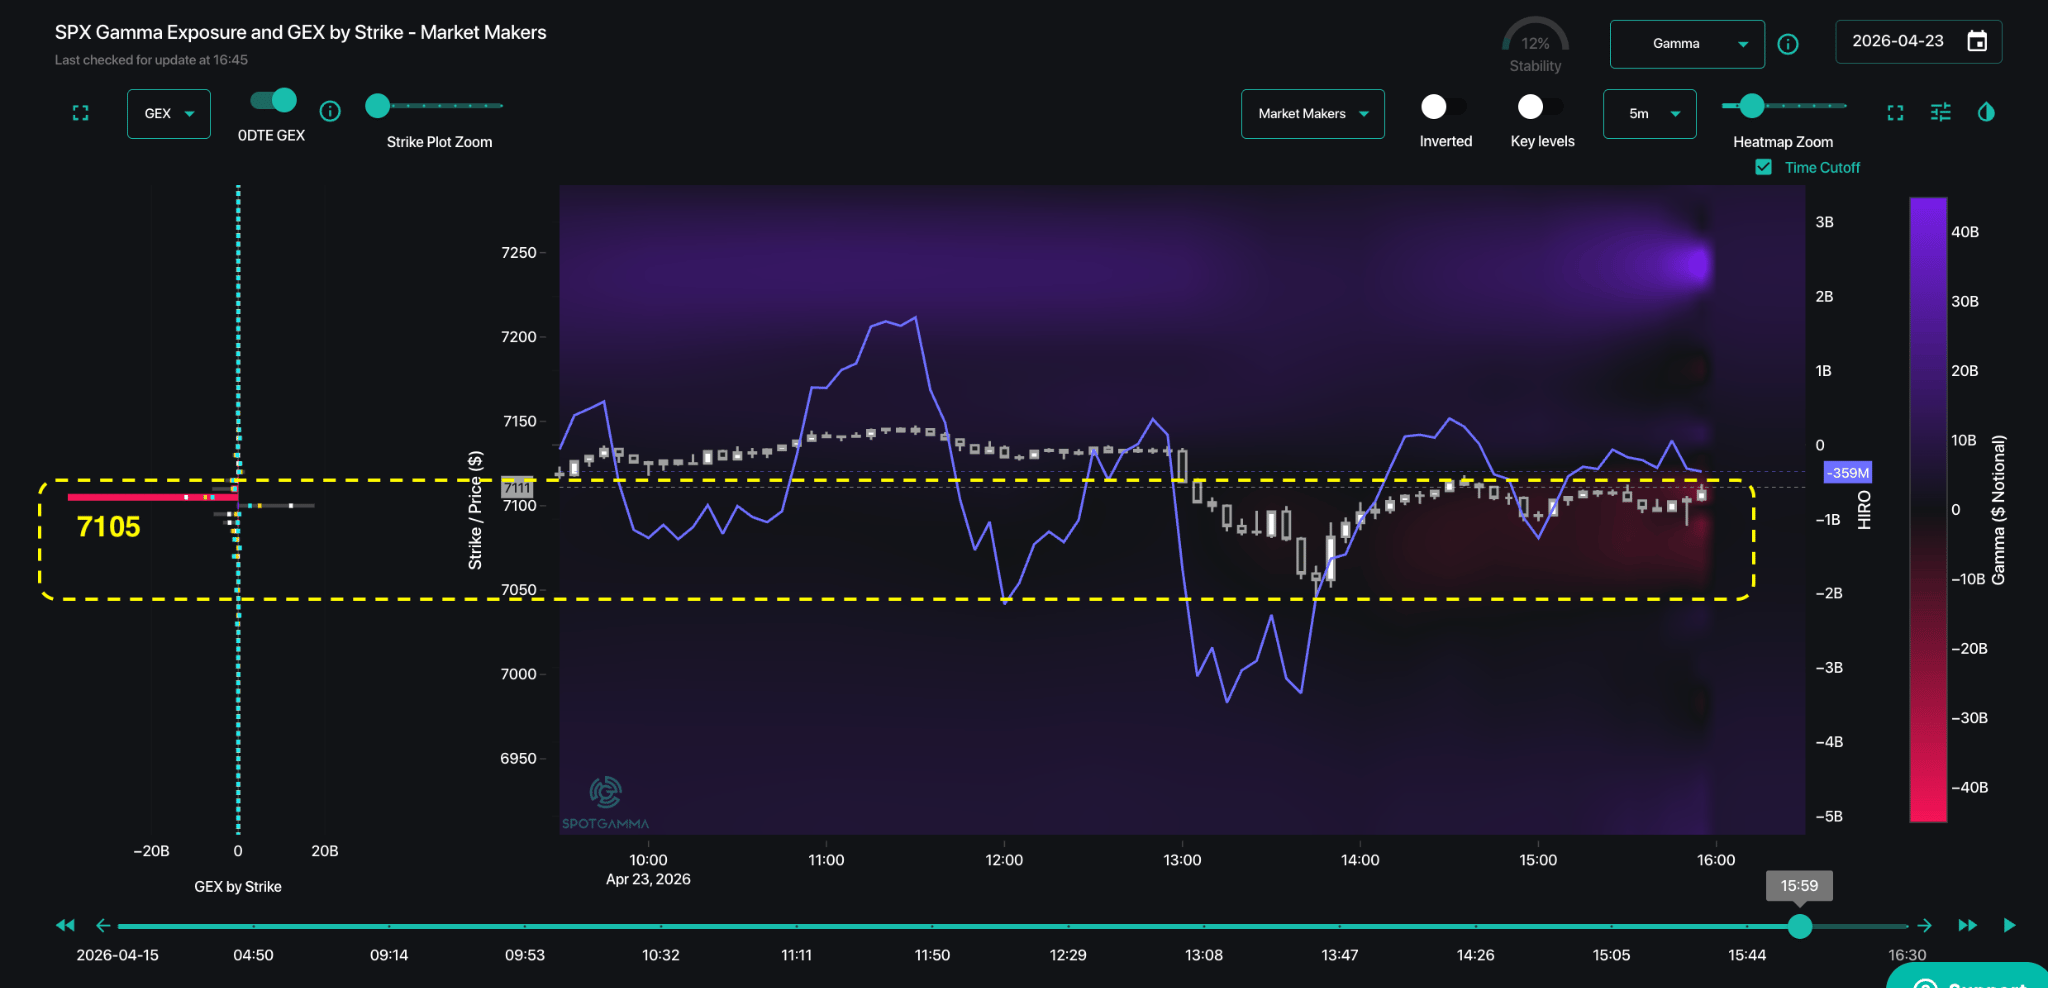
Meanwhile, the TRACE Gamma Heatmap showed the 7,050–7,100 zone shift from positive gamma (purple) to negative gamma (red) following the 0DTE put spread activity. Negative gamma environments are associated with higher volatility, as dealer hedging tends to amplify price moves (selling into weakness and buying into strength), which helps explain the sharp V-shaped recovery between ~1:40–2:00pm ET.
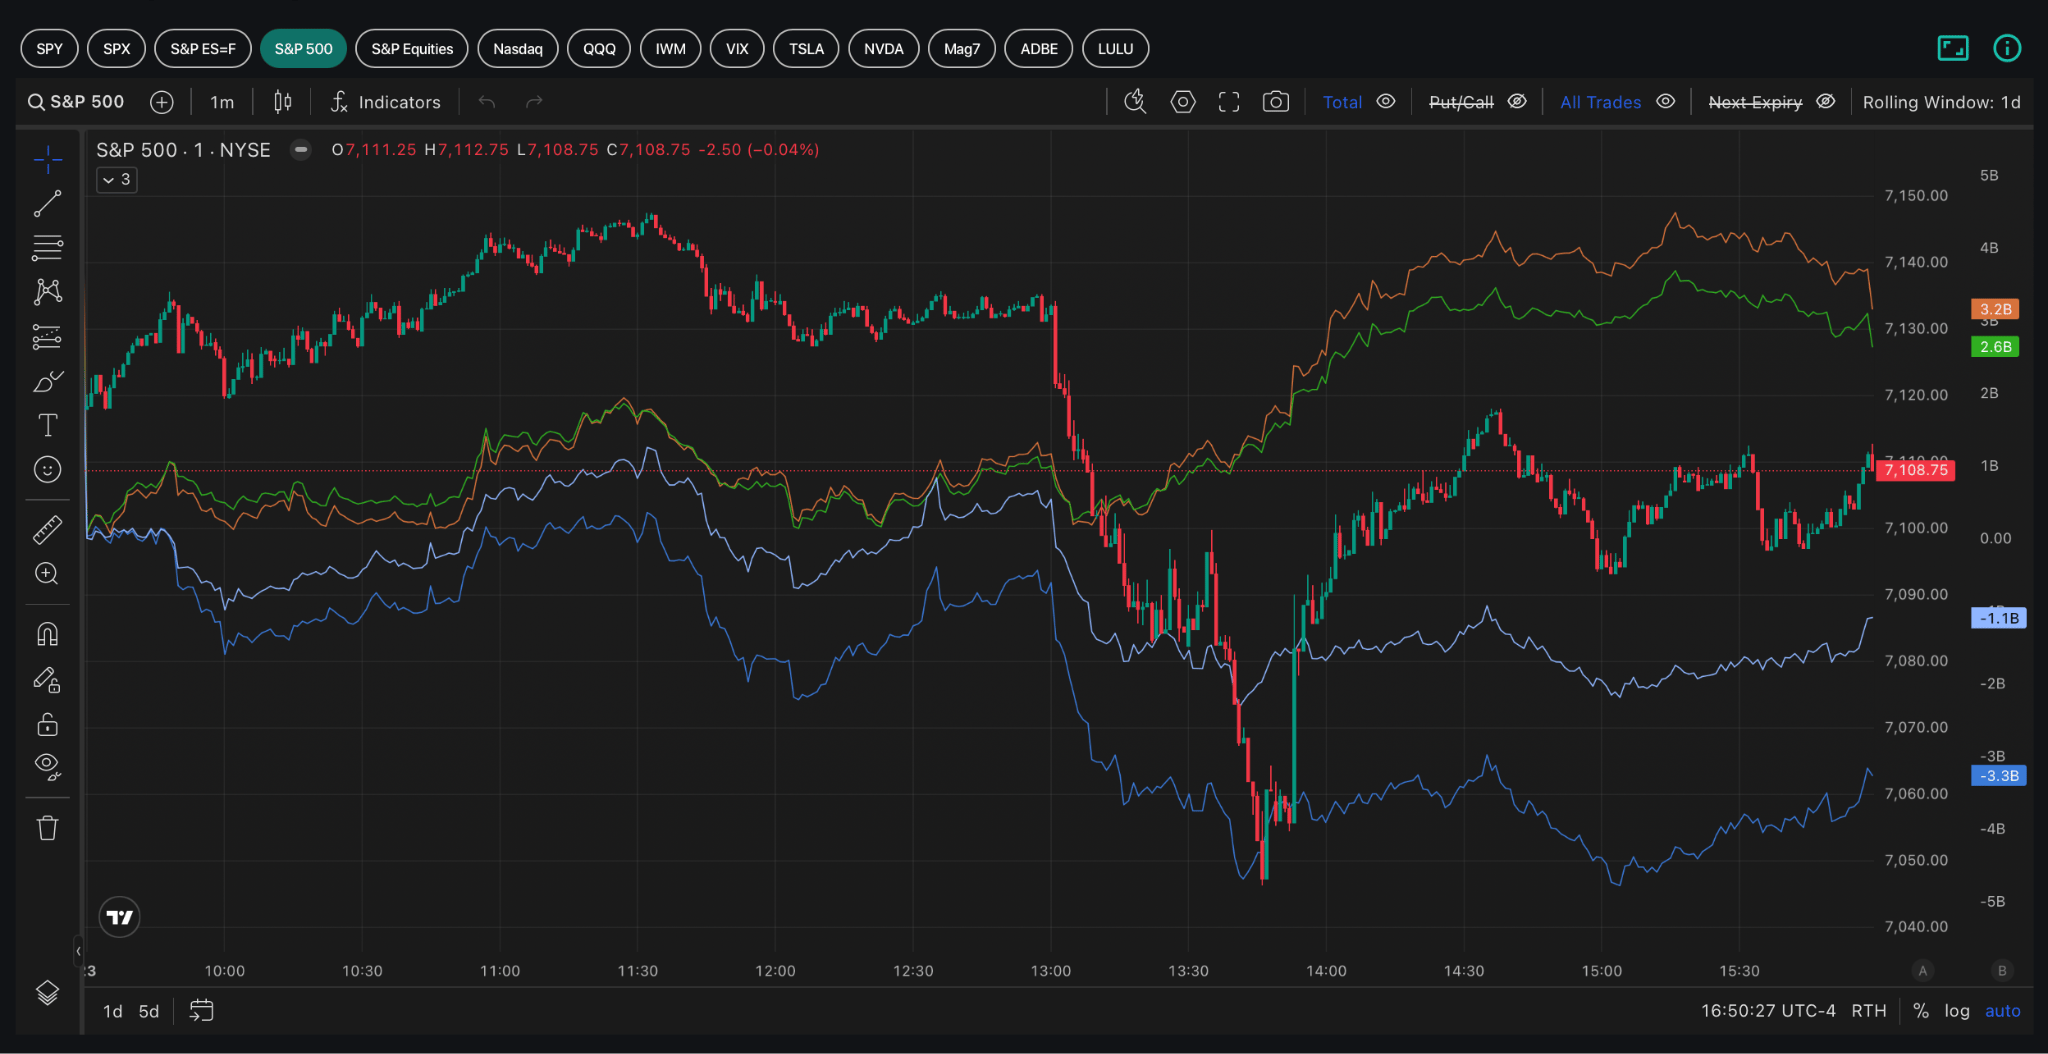
On the day, S&P 500 HIRO net flows were roughly flat, reflecting ~$3B in call buying and ~$3B in put buying. At the index level, this suggests traders were active in a relatively low IV environment, without a strong directional bias.
However, S&P single-stock equities showed -$3.4B in HIRO delta for the day—the largest negative reading in the past 30 days. This was driven by ~$2.4B in call selling and ~$1B in put buying. As noted in yesterday’s Founder’s Note, many mega-cap tech names had elevated IV Rank and Risk Reversal Rank, making long calls less attractive if upside momentum stalled. The unwind of these positions led to negative delta exposure, implying dealers would be sellers to delta hedge their positions.
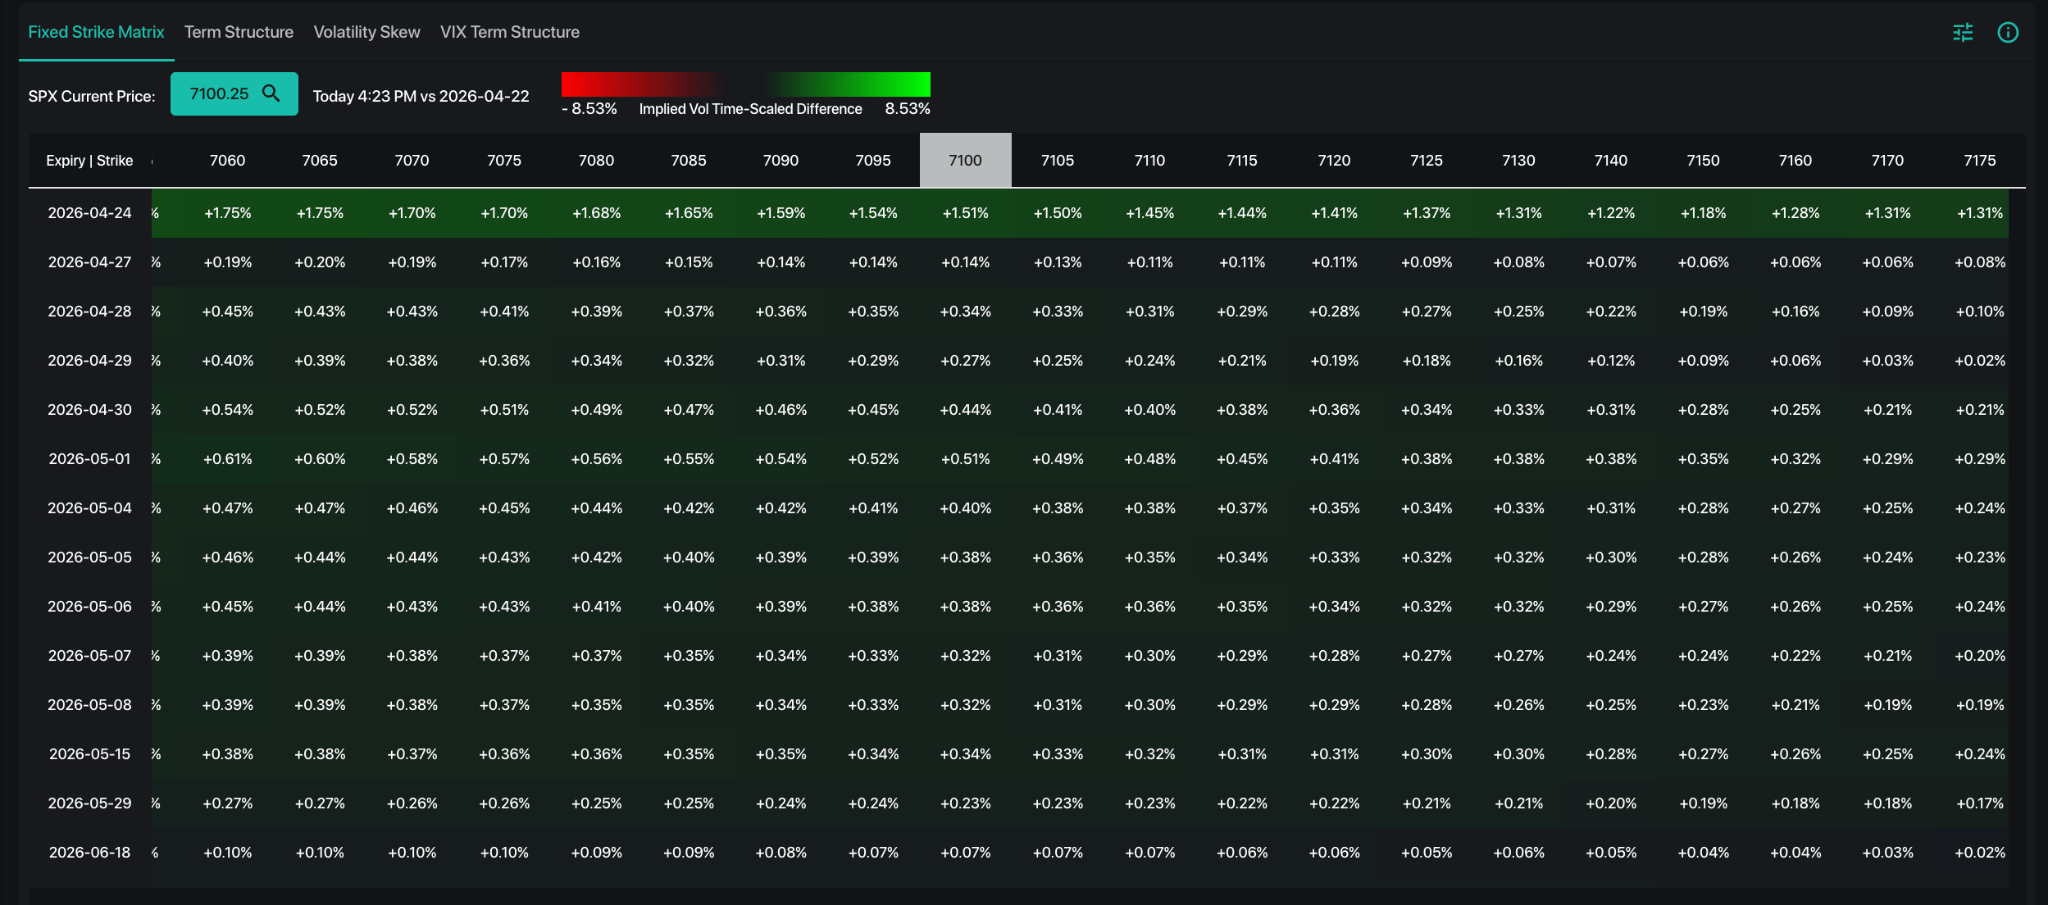
Fixed strike implied volatility moved higher across the surface today, indicating increasing risk premiums into next week, with major tech earnings and FOMC approaching.
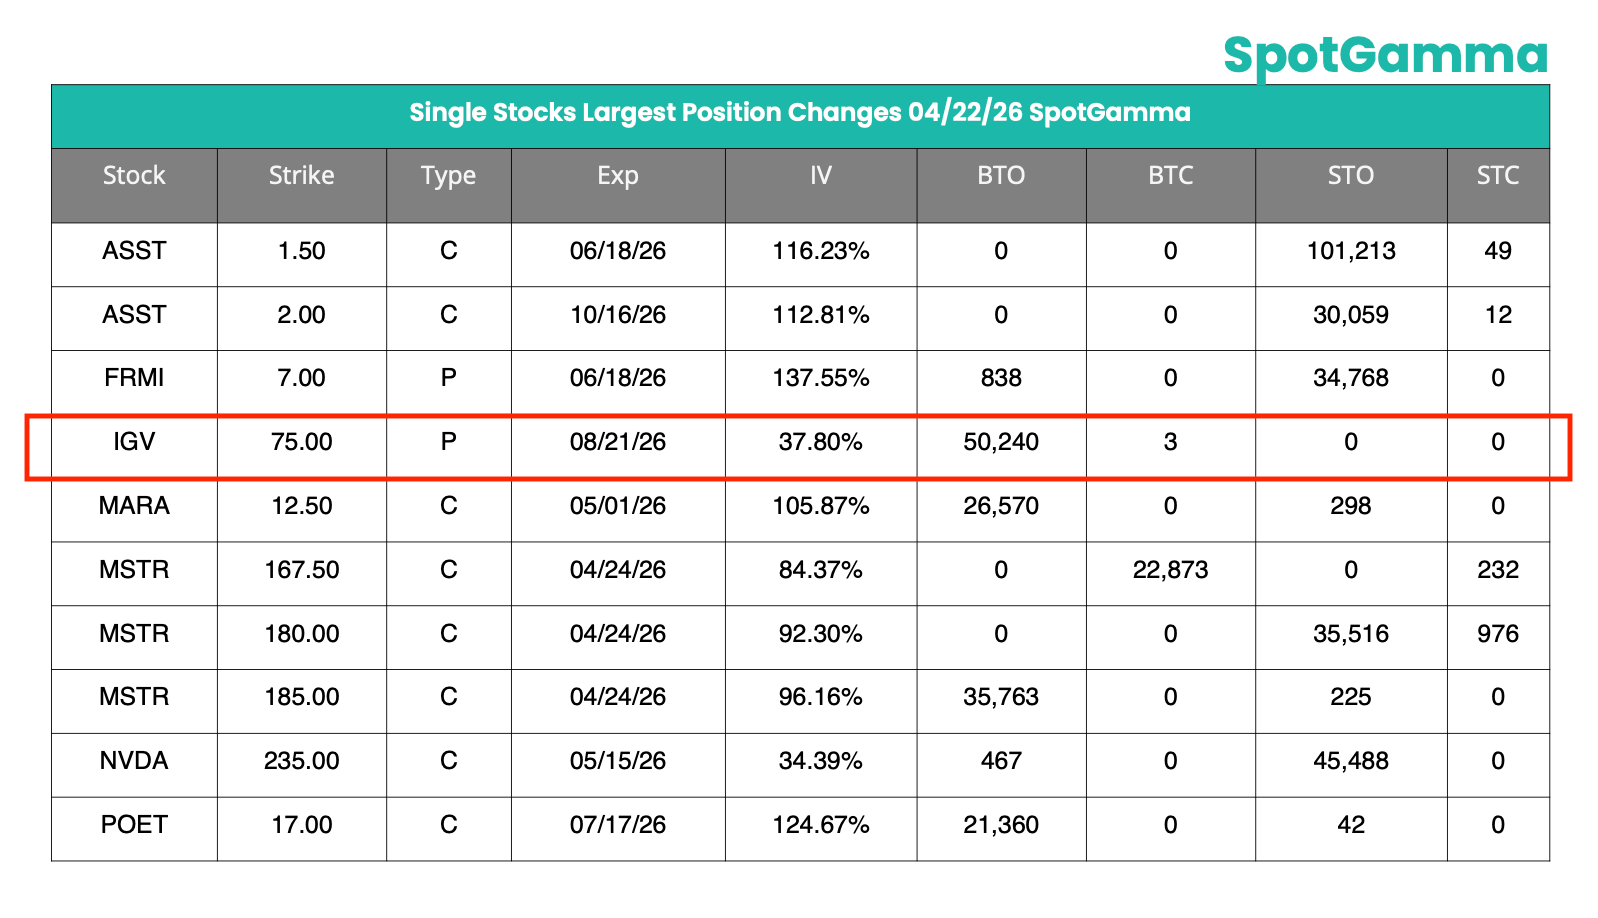
In this morning’s FlowPatrol report, we highlighted the 50k-lot IGV August 75 puts. The ~$12M premium outlay and far OTM strike made this a notable trade. Today, IGV declined ~6% alongside weakness in software stocks. These puts increased from $2.40 to $3.60 (~+50%) in one session, with ~4 months remaining to expiration.
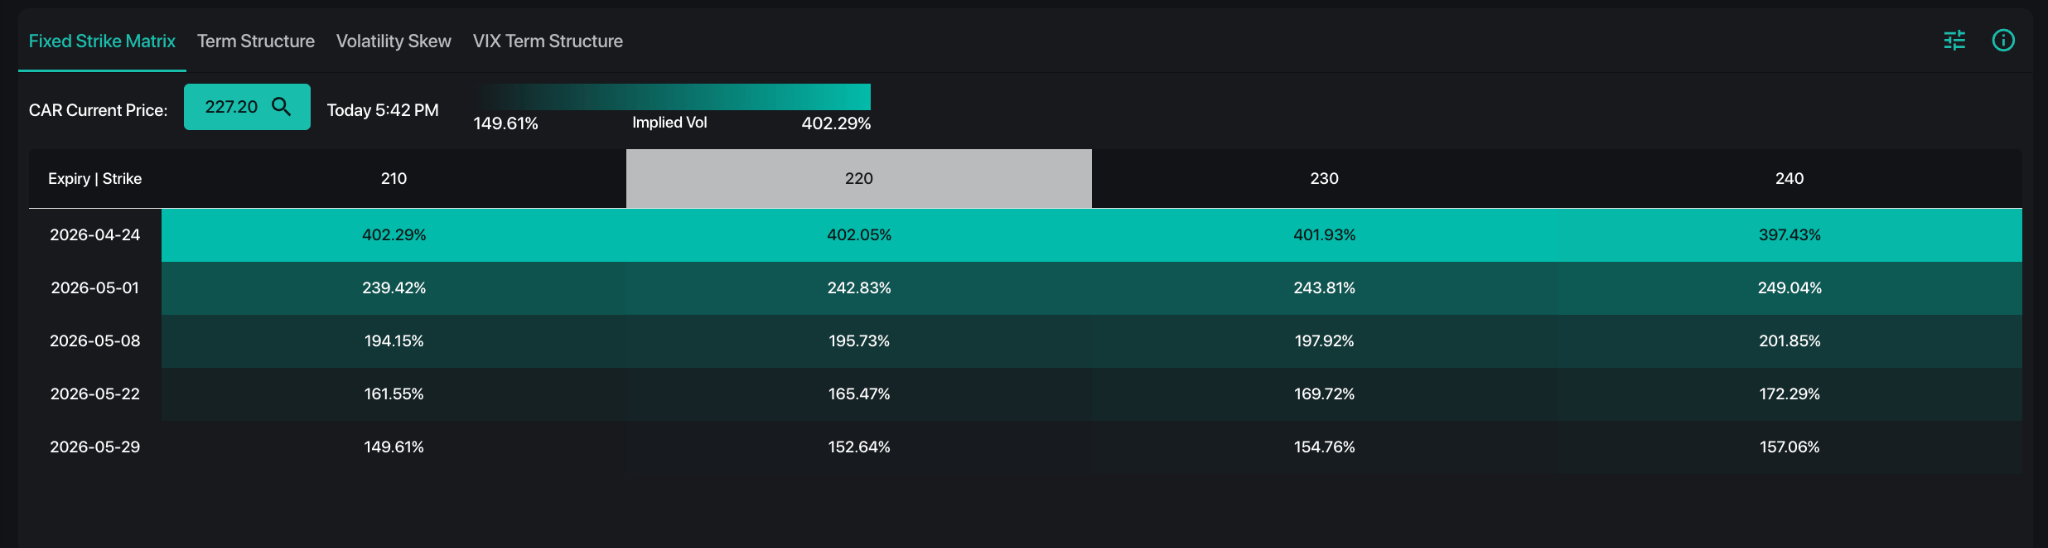
In single stocks, CAR declined 48% today and ~75% over the past two sessions ($850 to $230). The prior parabolic move higher, followed by a violent bust, highlights how negative gamma conditions can drive extreme moves in both directions. CAR implied volatility for tomorrow remains near 400%, indicating continued potential for large price swings, while 1-month realized volatility near 220 suggests current option premiums remain extremely expensive.
Notable flows of the day:
LRCX: 1350 lots LRCX 2027 Jan 300 calls traded with 5.6 million total premium paid.

WDC: 150 lots WDC Sep 420 calls and 150 lots WDC November 450 calls traded, with 2.6 million total premiums paid.

All TenTen Capital LLC DBA SpotGamma materials, information, and presentations are for educational purposes only and should not be considered specific investment advice nor recommendations. Futures, foreign currency and options trading contains substantial risk and is not for every investor. An investor could potentially lose all or more than the initial investment. Risk capital is money that can be lost without jeopardizing one’s financial security or lifestyle. Only risk capital should be used for trading and only those with sufficient risk capital should consider trading. Past performance is not necessarily indicative of future results. VIEW FULL RISK DISCLOSURE https://spotgamma.com/model-faq/disclaimer/
Market Recap
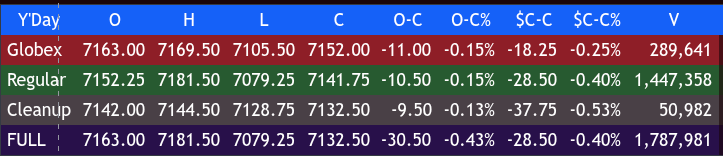
The ES sold off down to 7105.50 after a “headlie” and rallied up to 7169.50, then opened Thursday’s 9:30 ET regular session at 7152.25, down 18 points or -0.25%.
I am moving to a 30-minute chart, which will cut out a lot of the extra time it takes to do the recap. A trader, Tony from the CME floor, who ended up at the LIFFE in London, said a few years ago that I should just take it out, don’t do it, but to tell the truth, it helps me write the rest of the OP.
After the open, the ES rallied up to 7171.25 and then sold off 22.25 points down to 7149.00 at 10:00. The ES rallied back up to 7167.25 and pulled back to 7160.75 at 10:30, and then rallied up to 7181.50 at 11:30. It sold off down to 7160.25 at 12:00 and then rallied up to a lower high at 7170.25 at 12:30.
That is when a barrage of headlines hit, with Iran saying it was under attack. The ES sold off 54.75 points down to 7115.50 at 1:00. It then rallied up to 7133.75 at 1:30 and sold off 54.50 points down to 7079.25 at 1:30 as crude oil (CLK26) jumped up to 98.39. The ES rallied 64.00 points up to 7143.25 at 2:00, then rallied 9.00 points up to 7152.25 at 2:30. It traded back down to 7124.50 and then traded up to 7146.75 at 3:30.
The ES traded 7136.75 as the 3:50 cash imbalance showed $2 billion to sell. It then traded down to 7121.50 and traded 7141.75 on the 4:00 cash close. After 4:00, the ES traded 7144.75, traded down to 7134.75 at 4:30, and settled at 7143.50, down 27.75 points or -0.39%; the NQ settled at 26,934.00, down 149 points or -0.55%; the YM settled at 49,490, down 178 points or -0.36%; and the RTY settled at 2,786.20, down 9.10 points or -0.33% on the day.
In the end, it was another day of headlines and reckless abandonment. In terms of the ES and NQ’s overall tone, they acted weak. In terms of the ES’s overall trade, volume jumped to 1.889 million contracts traded.
On Tap Today:
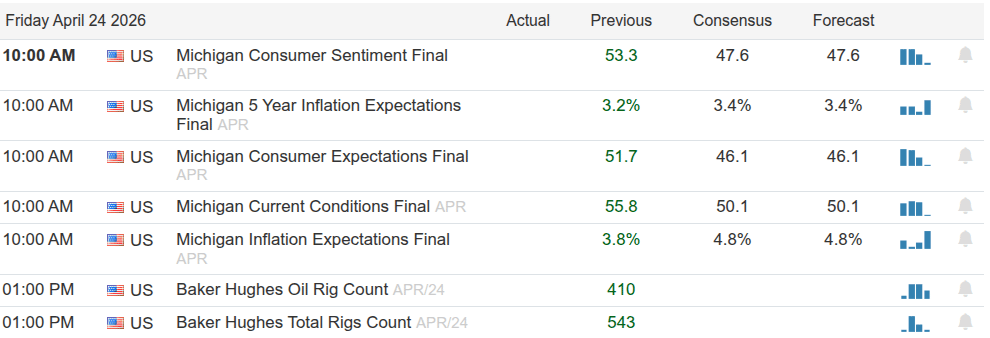
10:00 am Consumer sentiment (final)
I am going to cut this short… There really isn’t anything we don’t already know that hasn’t already hit the tape. As I said above, this isn’t about headlines, it’s headlies.


Live futures trading. Live automated trading. Live technical analysis and actionable set ups. Live 9:00 AM
YouTube

MiM
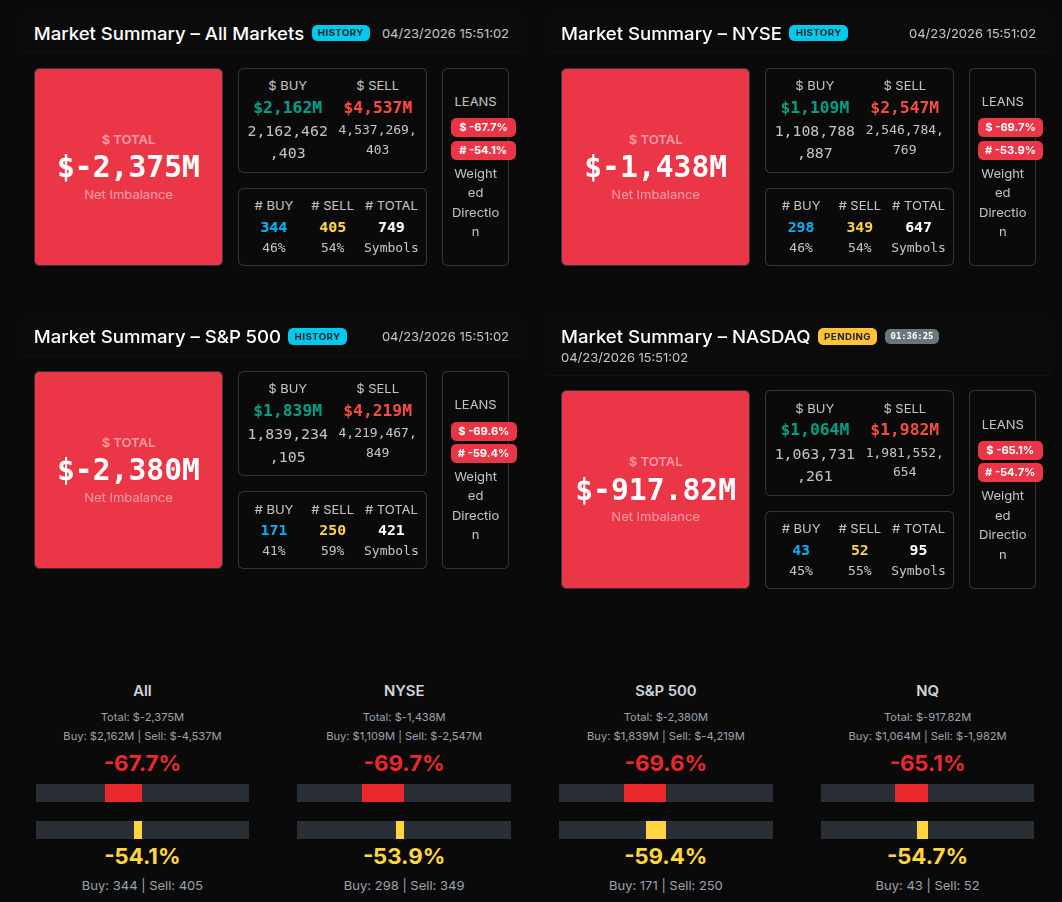
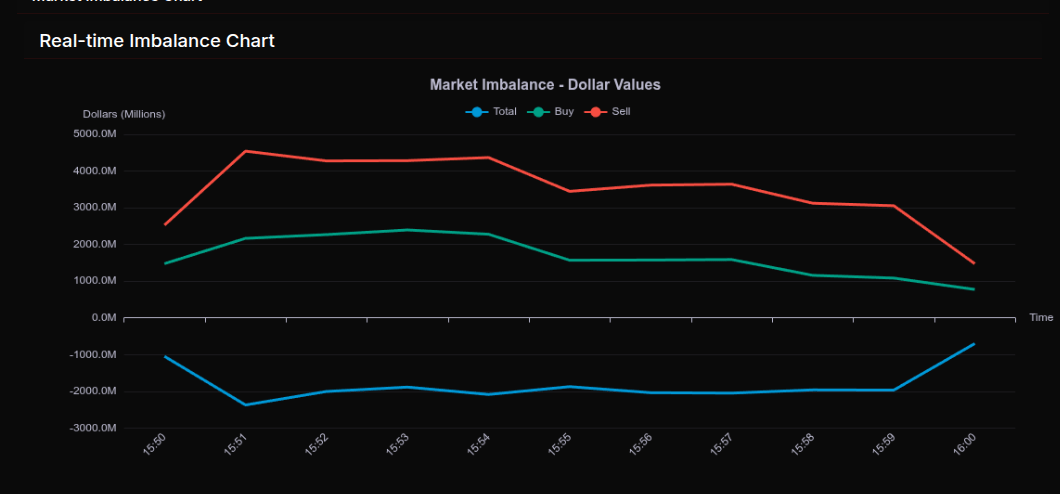
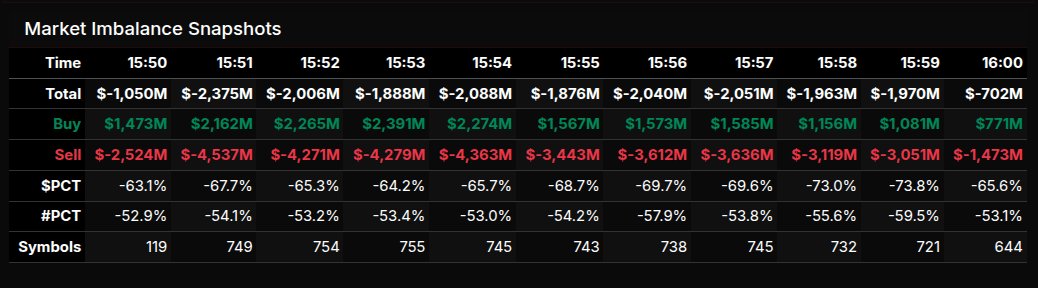
Market-On-Close Recap
The MOC session opened with immediate and aggressive sell-side pressure, setting the tone early for a distribution-driven close. At 15:50, the market was already showing a sizable -$1.05B imbalance, quickly accelerating to -$2.37B by 15:51. From there, the tape remained persistently heavy, with total imbalances hovering between -$1.8B and -$2.1B for the majority of the auction window. This consistency in negative pressure reflects sustained institutional selling rather than a late imbalance shock.
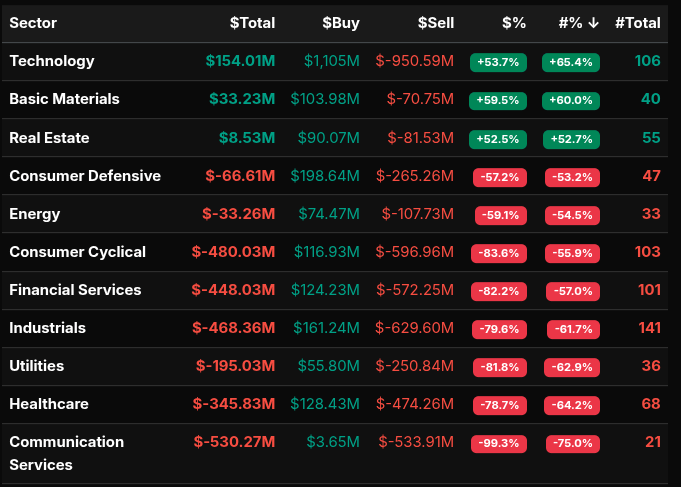
The imbalance metrics confirm this dominance. Sell pressure consistently exceeded -65% throughout the session, with multiple readings pushing beyond -70%, firmly categorizing this as a wholesale sell program rather than rotational activity. Even at the close, the market printed -65.6%, showing little meaningful recovery in demand. While there was a slight narrowing into 16:00 (final print -$702M), this was more indicative of mechanical offsetting than genuine buying interest.
Sector flows reinforced the bearish tone. Communication Services led to the downside with an extreme -99.3% lean, marking it as one of the clearest outright liquidation areas. Consumer Cyclical (-83.6%), Financials (-82.2%), Utilities (-81.8%), and Industrials (-79.6%) all showed broad-based and aggressive selling, highlighting risk-off behavior across economically sensitive groups. Healthcare (-78.7%) also participated in the sell programs. On the other side, Technology (+53.7%), Basic Materials (+59.5%), and Real Estate (+52.5%) showed modest buy-side tilts, but these remained rotational in nature and lacked the strength to offset broader market pressure.
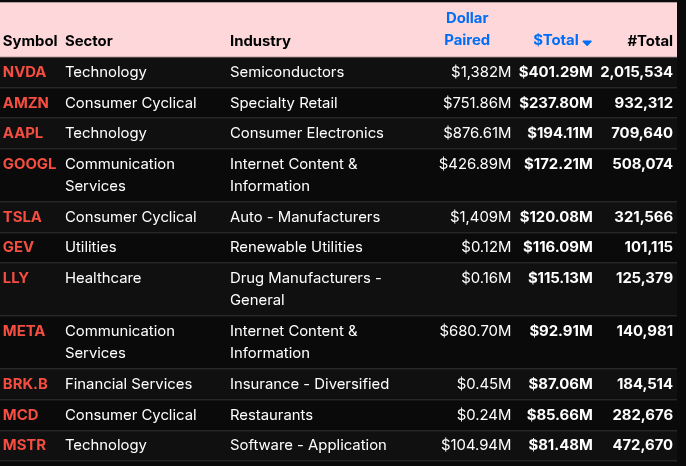
On the symbol level, the sell programs were concentrated in high-beta and index-heavy names. NVDA (-$401M), AMZN (-$237M), AAPL (-$194M), and GOOGL (-$172M) all saw significant selling, alongside TSLA. Meanwhile, some selective accumulation appeared in semiconductors like MU (+$138M), AMAT (+$98M), and INTC (+$71M), suggesting limited dip-buying within tech.
Overall, this was a structurally bearish MOC driven by institutional distribution, with only minor rotational buying pockets failing to shift the broader sell-side control.

ES Levels
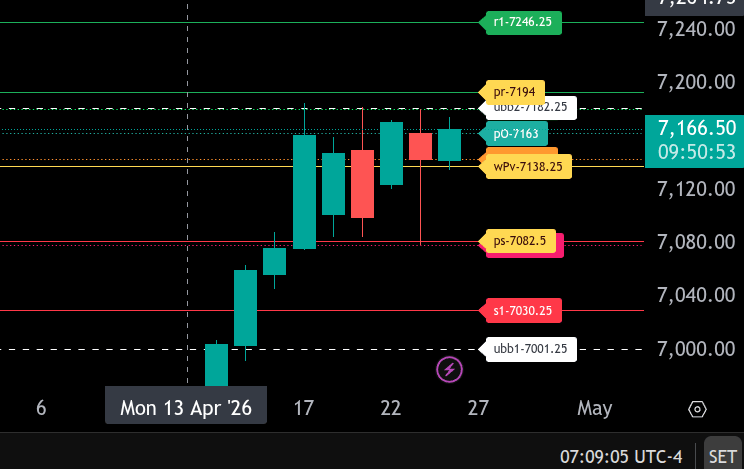
The bull/bear line for the ES is at 7138.25. This remains the key pivot for today’s session. Holding above this level keeps buyers in control, while acceptance below it would shift momentum back to the downside.
ES is currently trading around 7170.50, holding above the bull/bear line and showing early strength during the Globex session. As long as price remains above 7138.25, dips can be viewed as potential buying opportunities targeting higher levels.
On the upside, resistance comes in at 7163.00, followed by 7182.25. A breakout above this area opens the door for a move toward 7194.00, which is the upper range target for today. If momentum builds above 7194.00, continuation toward 7246.25 becomes possible.
On the downside, initial support sits at 7143.50, followed by the bull/bear line at 7138.25. A break below this level would weaken the structure and target 7082.50, the lower range target. If sellers gain control below 7082.50, further downside extension toward 7030.25 is likely.
Overall, the market is showing bullish positioning above 7138.25. Continued acceptance above this level favors upside continuation, while losing it would signal a shift back into a more defensive, bearish posture.
NQ Levels
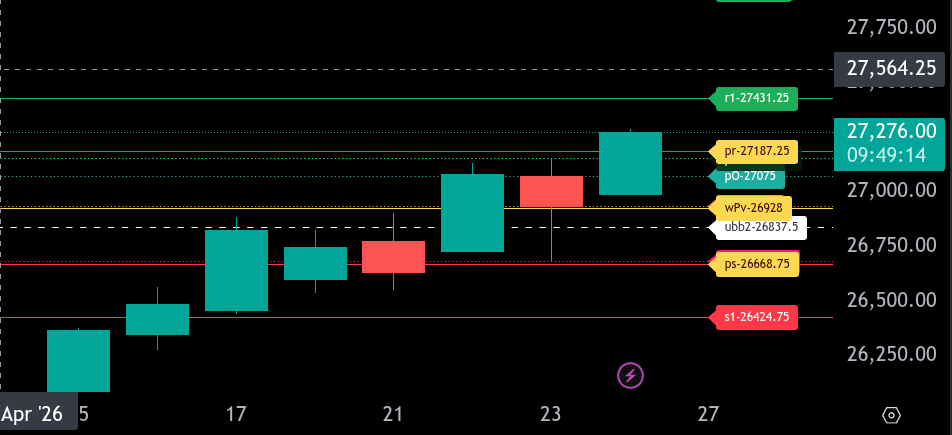
The bull/bear line for the NQ is at 26928.00. This is the key pivot for today. Holding above this level keeps the market in a bullish posture, while acceptance back below would shift momentum back to the downside.
Currently, NQ is trading around 27272.00, firmly above the bull/bear line and showing strength out of the overnight session. As long as price holds above 26928.00, dips are likely to be supported and buyers remain in control.
On the upside, the first resistance comes in at 27155.75, which has already been reclaimed, followed by 27187.25, our upper range target. A sustained move above this level opens the door for continuation toward 27431.25. If momentum builds, this becomes the key expansion zone for today.
On the downside, initial support sits at 27075.00, followed by the bull/bear line at 26928.00. If price breaks and holds below this pivot, expect a move toward 26837.50 and then 26668.75, which is the lower range target. A breakdown below this area could extend further toward 26681.75 and ultimately 26424.75.
Overall, the market remains bullish above 26928.00. Buyers are in control unless price loses that level, in which case a deeper retracement into the lower range becomes likely.
Technical Edge
Fair Values for April 24, 2026
-
SP: 31.58
-
NQ: 138.86
-
Dow: 157.87
Daily Breadth Data 📊
For Thursday, April 23, 2026
• NYSE Breadth: 38% Upside Volume
• Nasdaq Breadth: 33% Upside Volume
• Total Breadth: 35% Upside Volume
• NYSE Advance/Decline: 46% Advance
• Nasdaq Advance/Decline: 34% Advance
• Total Advance/Decline: 38% Advance
• NYSE New Highs/New Lows: 130 / 29
• Nasdaq New Highs/New Lows: 248 / 123
• NYSE TRIN: 1.40
• Nasdaq TRIN: 1.02
Weekly Breadth Data 📈
Week Ending Friday, April 17, 2026
• NYSE Breadth: 66% Upside Volume
• Nasdaq Breadth: 73% Upside Volume
• Total Breadth: 70% Upside Volume
• NYSE Advance/Decline: 76% Advance
• Nasdaq Advance/Decline: 80% Advance
• Total Advance/Decline: 79% Advance
• NYSE New Highs/New Lows: 284 / 59
• Nasdaq New Highs/New Lows: 710 / 264
• NYSE TRIN: 1.70
• Nasdaq TRIN: 1.53
Calendars
This Week’s High Importance
Trading Room News:
Polaris Trading Group Summary – For Thursday, April 23, 2026
The day started off as slow and sideways, with traders noting choppy conditions early. PTGDavid set the tone with an “early long lean”, framing the market around key levels and emphasizing structure between HVNs and “void” areas—helping traders prepare for rotational behavior rather than trend.
Morning – Patience & Learning Environment
-
The room spent time discussing market replay and sim trading, reinforcing how important it is to practice reading price action in real time.
-
David’s explanations of price behavior (especially around GOLD and structure) stood out—members specifically asked for more training sessions like this.
-
Strong emphasis on process over prediction: thinking through “what would you do and why?”
Lesson: Skill-building and replay work are key to internalizing price action—not just watching live trades.
Midday – High-Probability D-Level Trades Shine
This was the highlight of the day.
-
Clear bull case above 7160, targeting 7175–7185
-
Market tagged 7175, validating the plan
-
Attention then shifted to the D-Level (around 7180)
Execution:
-
Multiple traders took shorts at D-Level
-
PTGDavid called it in real time:
-
+5 → +10 → +15
-
-
Group confirmation and confidence built quickly, with several traders participating successfully
“Solid DL level +15 well played gents”
-
Later, another D-Level setup around 7114 offered opportunity again
-
DanV noted success on both sides of the market, reinforcing adaptability
Lesson:
D-Level continues to be a “secret weapon”—when aligned with structure, it provides high-probability entries. Execution confidence improves when traders trust the level.
Afternoon – Headline-Driven Volatility
The market shifted dramatically due to geopolitical headlines:
-
Sudden selloff on Iran-related news
-
Immediate reversal after conflicting headlines
-
Sharp two-sided liquidity sweep, taking out both highs and lows before snapping back
David framed it perfectly:
“The battlefield has shifted to headlines… ALGO’s and 0DTE options are the new weapon”
-
Traders observed long wicks on both sides, confirming stop runs and liquidity grabs
-
Despite chaos, structure held: weekly lows swept → instant recovery
Lesson:
In headline-driven environments:
-
Expect fake moves and fast reversals
-
Focus on key levels and liquidity zones, not emotions
-
Understand that algos react faster than humans—structure is your anchor
Closing Session – Volatility Compression
-
Market stabilized around Mid-VWAP
-
David noted liquidity had been cleared on both sides
-
Into the close: $2B MOC sell imbalance, but overall energy faded
Lesson:
After major liquidity events, markets often transition to balance and low volatility—forcing traders to shift from aggression to patience.
Overall Takeaways
-
D-Level trades delivered the best results of the day
-
Strong reinforcement of process, replay training, and price action reading
-
Headline risk is real—can override short-term structure but often returns to it
-
Traders who stayed disciplined and level-focused were rewarded
Big Picture
This was a classic two-part day:
-
Technical precision (morning/midday) → clean, structured trades
-
Headline chaos (afternoon) → tests discipline and emotional control
The traders who succeeded:
-
Trusted levels (especially D-Level)
-
Stayed flexible (played both sides)
-
Didn’t chase headlines
DTG Room Preview – Friday, April 24, 2026
Macro Focus:
-
US–Iran tensions over Strait of Hormuz remain the key driver
-
Israel–Lebanon ceasefire extended 3 weeks → slight optimism for broader negotiations
-
Trump rhetoric + naval actions (tanker interceptions, mine warnings) seen as escalating pressure
-
JPM: Iran oil shutdown pressure could build within ~1 month
Oil Market:
-
Gulf output ~57% below pre-war levels (~14.5M bpd reduction)
-
Long normalization timeline → oil prices continue grinding higher
Equities (Overnight):
-
S&P ~flat, Dow lower, Nasdaq higher
-
Strength driven by Intel +20% on earnings beat + raised guidance
-
Intel positioning for AI demand recovery (data center + chip manufacturing)
Big Tech / AI Theme:
-
Continued layoffs to fund AI buildout:
-
Meta: -10% workforce (~8k jobs)
-
Microsoft: voluntary buyouts (~7% eligible)
-
Similar cuts: Amazon, Google, Oracle
-
-
Theme: rising AI capex → cost-cutting elsewhere
Earnings Watch:
-
Premarket: CHTR, ENI, HCA, NSC, PG, SLB
-
Monday: Verizon (VZ)
Economic Data:
-
UoM Consumer Sentiment + Inflation Expectations (10:00am ET)
Volatility / Positioning:
-
ES 5-day ADR elevated (~92 points)
-
No meaningful whale/large trader bias overnight
-
Headline-driven volatility (Iran-related)
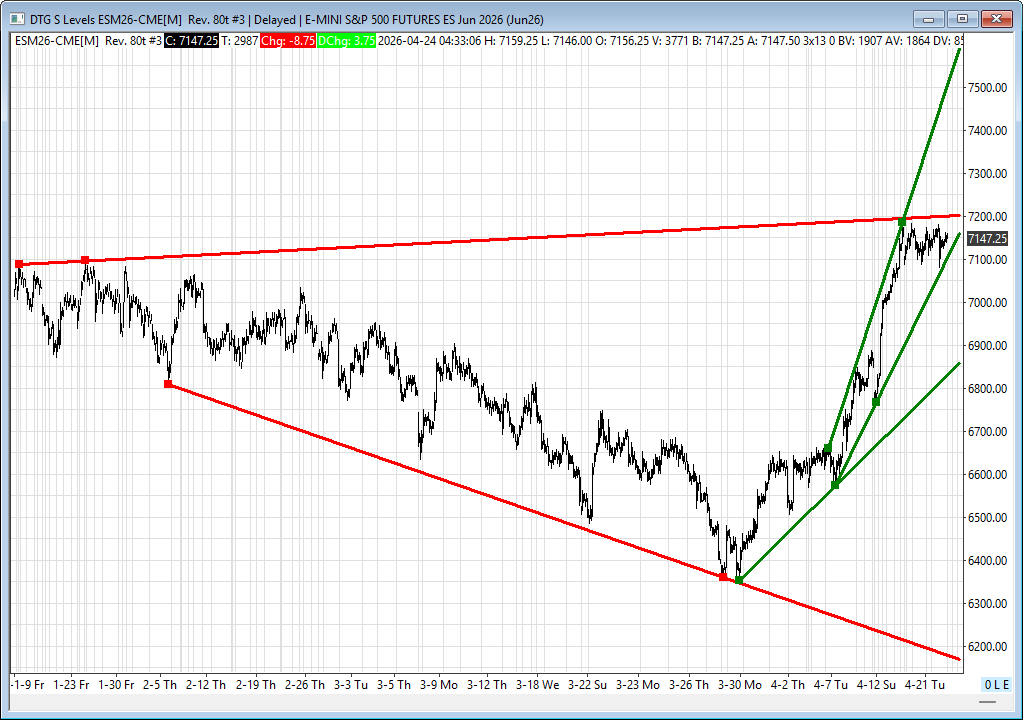
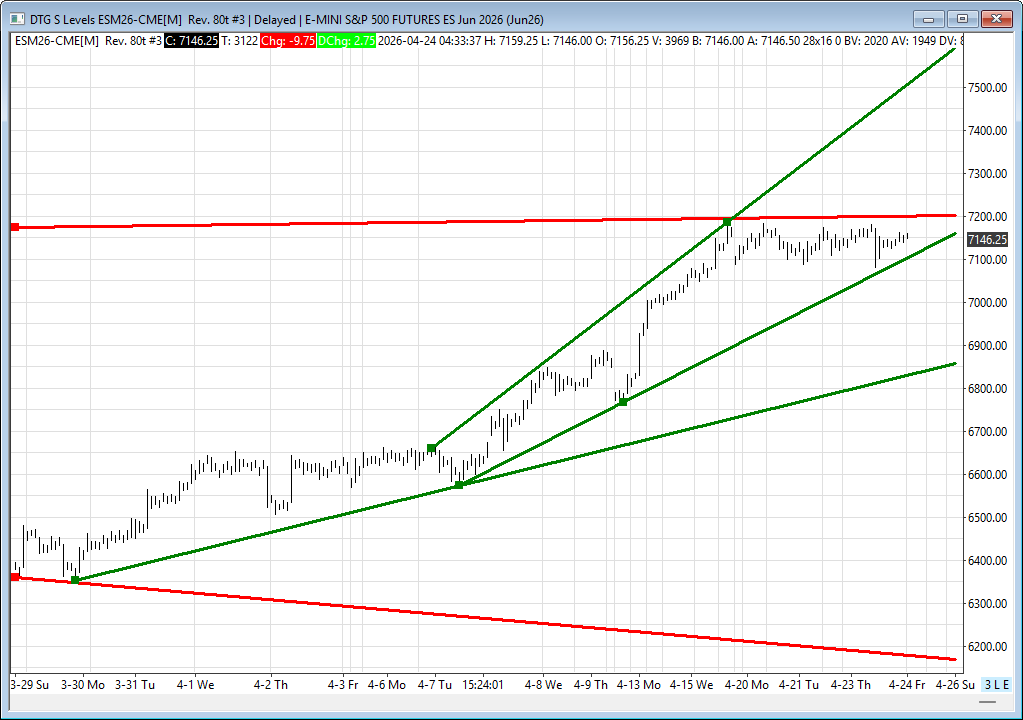
ES Technicals:
-
Market compressing between trendlines → breakout likely soon
-
Resistance: 7204–07, 7555–60
-
Support: 7100–05, 6845–50, 6170–65
-
Bias: Bullish (50-day MA above 200-day MA)
Affiliate Disclosure: This newsletter may contain affiliate links, which means we may earn a commission if you click through and make a purchase. This comes at no additional cost to you and helps us continue providing valuable content. We only recommend products or services we genuinely believe in. Thank you for your support!
Disclaimer: Charts and analysis are for discussion and education purposes only. I am not a financial advisor, do not give financial advice and am not recommending the buying or selling of any security.
Remember: Not all setups will trigger. Not all setups will be profitable. Not all setups should be taken. These are simply the setups that I have put together for years on my own and what I watch as part of my own “game plan” coming into each day. Good luck!!
Follow @MrTopStep on Twitter and please share if you find our work valuable!
This post goes out as an email to our subscribers every day and is posted for free here around 2 PM ET. To get your real-time copy, sign up for the free or premium version here: Opening Print Subscribe.
Comments are closed