It took bears two days to unravel the recent gains.
Follow @MrTopStep and @BretKenwell on Twitter and please share if you find our work valuable.
Our View
I am going to continue taking a ‘cautious’ view of the stock market. I know it has done well until the past few days and I will be willing to change my mind. However, there are still many issues that persist (at the top of the list: recession worries, inflation, and the Fed).
The way I see it is, the patterns speak for themselves. Short cover, then gain some momentum on the upside to suck in the longs, and then in come the dead-cat bounces when it rolls over. I had lunch with someone I consider to be very smart and on top of things, and he had a very gloomy outlook.
Our Lean
Here is that DAX chart again from yesterday as it finds support. If you’re trading this, 15,000, 15,075, 15,130, and 15,150 are the trim areas.
My stop would now be B/E or just below Thursday’s low.

As for the market overall, look: The market did a good job resolving higher out of that 3800 to 3900 range. After it did so, it took days and days for the ES to grind out 120 points on the upside.
For the bears, it took just two sessions to unwind that progress (and a little more). That said, the ES is finding its footing in the almighty 3900 to 3920 area and the 50% “halfback” (which is at 3912), and it’s doing so after a good earnings response from Netflix.
Our Lean: I think there’s potential for there to be a late-day squeeze. Off the open, there will likely be some excitement in tech, (NFLX, GOOGL, etc.) but that will likely resolve into “sideways to lower” action for the indices.
Later in the session, look for an options squeeze higher — you know, the good old-fashioned “FRY-day” price action of Opex.
MiM and Daily Recap

The ES sold off down to 3906.75 on Globex and opened Thursday’s regular session at 3922.25. After the open, the ES traded up to 3933.75, sold off down to 3915.50, and rallied back up to a lower high at 3928.25. From there, it dropped back down to a new daily low at 3913 and then rallied back up to the 3928.50 level at 10:18. This is a great example of CHOP.
After the pop, the ES sold off down to new lows at 3904.50 at 10:58, traded back up to the 3920 level and dropped back down to a new low at 3901.75. As the futures were making new lows I posted this in the MrTopStep chat “3900 gotta go well.”
The ES held the 3900 level, reclaimed the Globex low near 3907, and then ran to 3940 at 2:45 before fading into the close. It traded ~3926 at 3:50 as the MIM reveal showed more than $2 billion for sale and traded 3916.75 at the 4:00 cash close. At 5:00, the ES settled at 3920.25.
In the end, things just kinda piled up on the index markets. In terms of the ES’s overall price action, it was weak. In terms of the ES’s overall trade, volume was steady at 1.83 million contracts traded.
Technical Edge
- NYSE Breadth: 30% Upside Volume
- Advance/Decline: 40% Advance
- VIX: ~$20.50
S&P 500 — ES

Great hold of the 3900 to 3910 zone. Now back above 3920, let’s see if we can get 3940 to 3950.
That’s Wednesday’s low, Thursday’s high, and the 10-day and 50-day moving averages. A move like that begins with a rotation through the Globex high of 3933.
On the downside, a break of 3912 — the Globex low and the 50% retrace — opens the door down to: 3900, 3891, and 3883.
That’s Thursday’s low, last week’s low, and the 61.8% retrace.
SPY

If the SPY can regain $391 — and thus go daily up, while reclaiming the 10-day and 50-day moving averages — $393.75 to $395 is in play next.
On the downside, a break of $387.25 puts $386.25 in play. Below that puts $384.50 in play.
QQQ
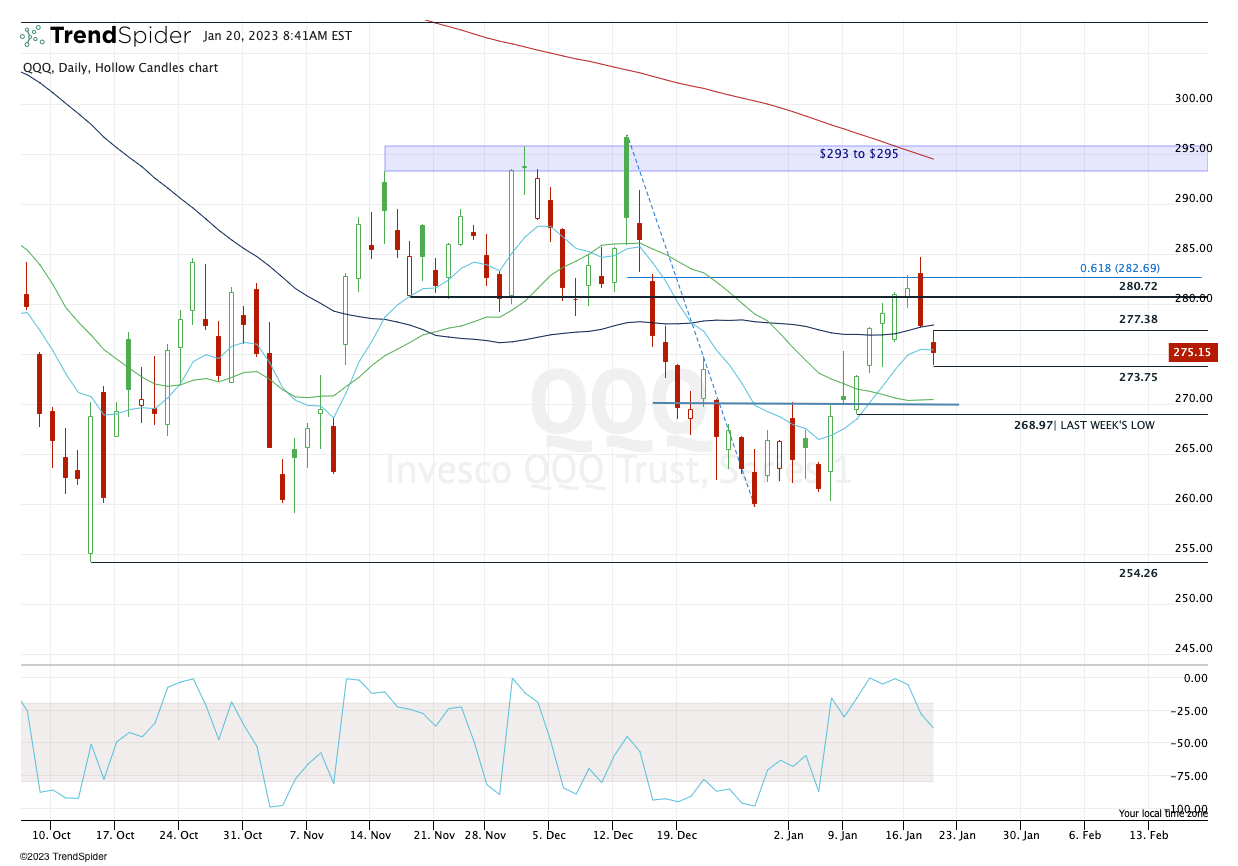
Over $277.50 is bullish and puts $280+ back in play. Sub-$273.75 is bearish and puts $269 to $270 in play.
Careful of a “look above and fail” — aka the QQQ poking above $227.38 and then reversing.
GE
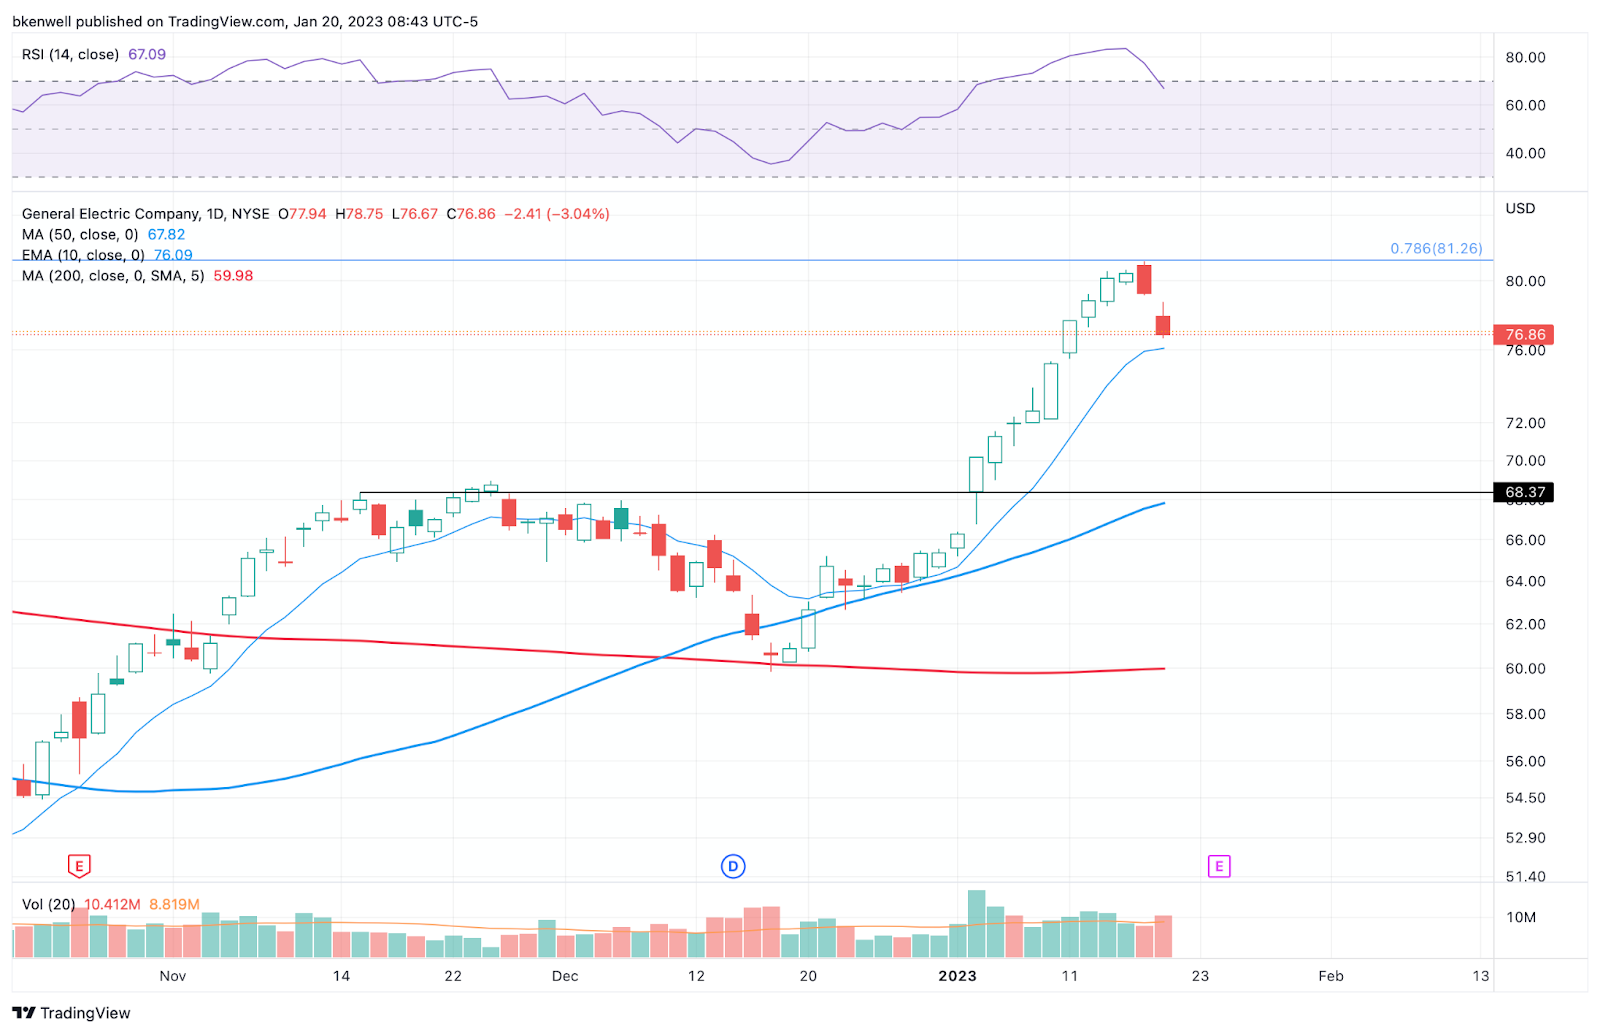
GE has been a beast. I’m a buyer if we test the 10-day moving average today. Stop at $74-ish. First target would be $78.50 to $79-ish.
Open Positions
A note: After talking to some members, I want to make the setups a bit more clear. We are a trade-ideas service, but want to make entries & exits simpler to understand. We will be sending more updates, a few educational pieces and looking for a way to make our setups more clear in how we are managing them.
- Numbered are the trades that are open.
- Bold are the trades with recent updates.
- Italics show means the trade is closed.
— Any positions that get down to ¼ or less (AKA runners) are removed from the list below and left up to you to manage. My only suggestion would be, B/E or better stops.
From this latest round, that includes TLT, DE and FSLR.
- COP — Long from $119, the 2x weekly-up. $124 to $127 could be a reasonable trim spot. Trimmed ¼ at the 50-day. We got our first trim & some messaged to say they got a second near yesterday’s HOD. (I didn’t).
- If you didn’t get out with a B/E stop, then stay disciplined with your original stop. Mine was $116.
- Tricky action so far. Feel free to cut down the position at any point while in the black or in the green. $116 stop proves prudent. $123.50+ and can cut down more.
- TJX — I am long from $81.40. But yesterday was an inside day, so traders who are not long but want to be can always wait for an inside-and-up rotation over $82.10.
- Targeting $83 as my first trim. $79 stop.
- MRK — Long from $108.75 — first target: $111 to $112.50. Stop at $106.75 to $107.
- NKE — Long from $124-ish — I really don’t want to see this break $123. I am long calls (Feb. 130s) and will be out if the decline by 60%. $126.50 to $127 is first area for trim.
- If bulls have any control of the market, NKE should be one that bounce.
Go-To Watchlist
*Feel free to build your own trades off these relative strength leaders*
Relative strength leaders →
- SBUX
- TJX, ULTA, NKE
- CAT
- BA & Airlines — AAL, DAL, UAL
- GE
- CAH
- SMCI
- MRK — weekly
- FSLR
- XLE — XOM, CVX, COP, BP, EOG, PXD — (Weekly Charts)
Economic Calendar

Comments are closed