Or was this just an Opex move?
Follow @MrTopStep and @BretKenwell on Twitter and please share if you find our work valuable.
Our View
Did the bulls turn a corner or was this an Opex-fueled rally designed to mislead a majority of market participants?
I want to know, how do you feel about the current conditions of the market? There is no right or wrong answer, I am truly just curious how this group feels about the next several weeks.
Poll
It seems to me that many investors have turned more optimistic over the last few days.
As for the week, if it weren’t for earnings, it would be a quiet week. The Fed has entered its blackout period until the FOMC meeting on Feb. 1, so we won’t be hearing from them. On the economic front, just a few events stand out this week: The PMI report tomorrow, the GDP report on Wednesday and the PCE report on Thursday.
In regards to earnings, there are a lot, including JNJ, GE, MSFT, BA, TSLA, INTC, V, MA, AXP, and CVX.
Our Lean
How nicely did Friday play out for us? The S&P rallied right off the open, then slipped up and it took almost two hours to take out the high. But then it was off to the races as the market gave bulls a beautiful Opex “FRY-day.”
As for today, the ES held up well through Globex and is now pushing higher. After a big up-day, Mr. Top Step has a rule that the market usually tends to go sideways to lower.
With that, watch for a “sell the open” reaction as they let the S&P 500 reset a bit after Friday’s late-day ramp. I’m not opposed to buying the 30 to 40-point dips today if breadth is strong. I want to see 3975 to 3980 hold on the downside.

As for the DAX, it found support and our upside levels were: 15,000, 15,075, 15,130, and 15,150.
Well, the high today is 15,146, so three out of our four targets have been hit. If you’ve ridden this one, then congrats. Consider raising your stop on the last piece up to 15,000. Otherwise, let’s see if we can get the last target on it.
MiM and Daily Recap

The ES traded down to 3911.75 on Globex and opened Friday’s regular session at 3929. After the open, the ES dropped down to 3912.25 and then started grinding higher. At 10:31 the ES traded up to a new high at 3941.75, pulled back down to 3932.50 at 10:54, and then rallied up to a 3954.25 “double top.” For the next hour and fifteen minutes, it back-and-filled in a 4 to 6-point range, dropped down to the 3940.25 level at 1:20 and it was that low that set up the RIP all the way up to 3987.75 at 3:19.
The ES traded 3983 as the 3:50 cash imbalance showed $1.17 billion to sell and rallied up to a new high at 3990.50. The ES traded 3988 on the 4:00 cash close and also settled at 3988 on the 5:00 futures close, up 73 points or +1.86% on the day.
In the end, it was all about the markets being oversold and the Friday options expiration ‘squeeze.’ In terms of the overall tone, it was all buy-stops and buy programs. In terms of the ES’s overall trade, volume was low at 1.5 million contracts traded.
Technical Edge
- NYSE Breadth: 84% Upside Volume (!)
- Advance/Decline: 78% Advance
- VIX: ~$20
Great action on Friday from a price perspective, although the Adv/Dec. Was not as strong as some would have thought.
S&P 500 — ES
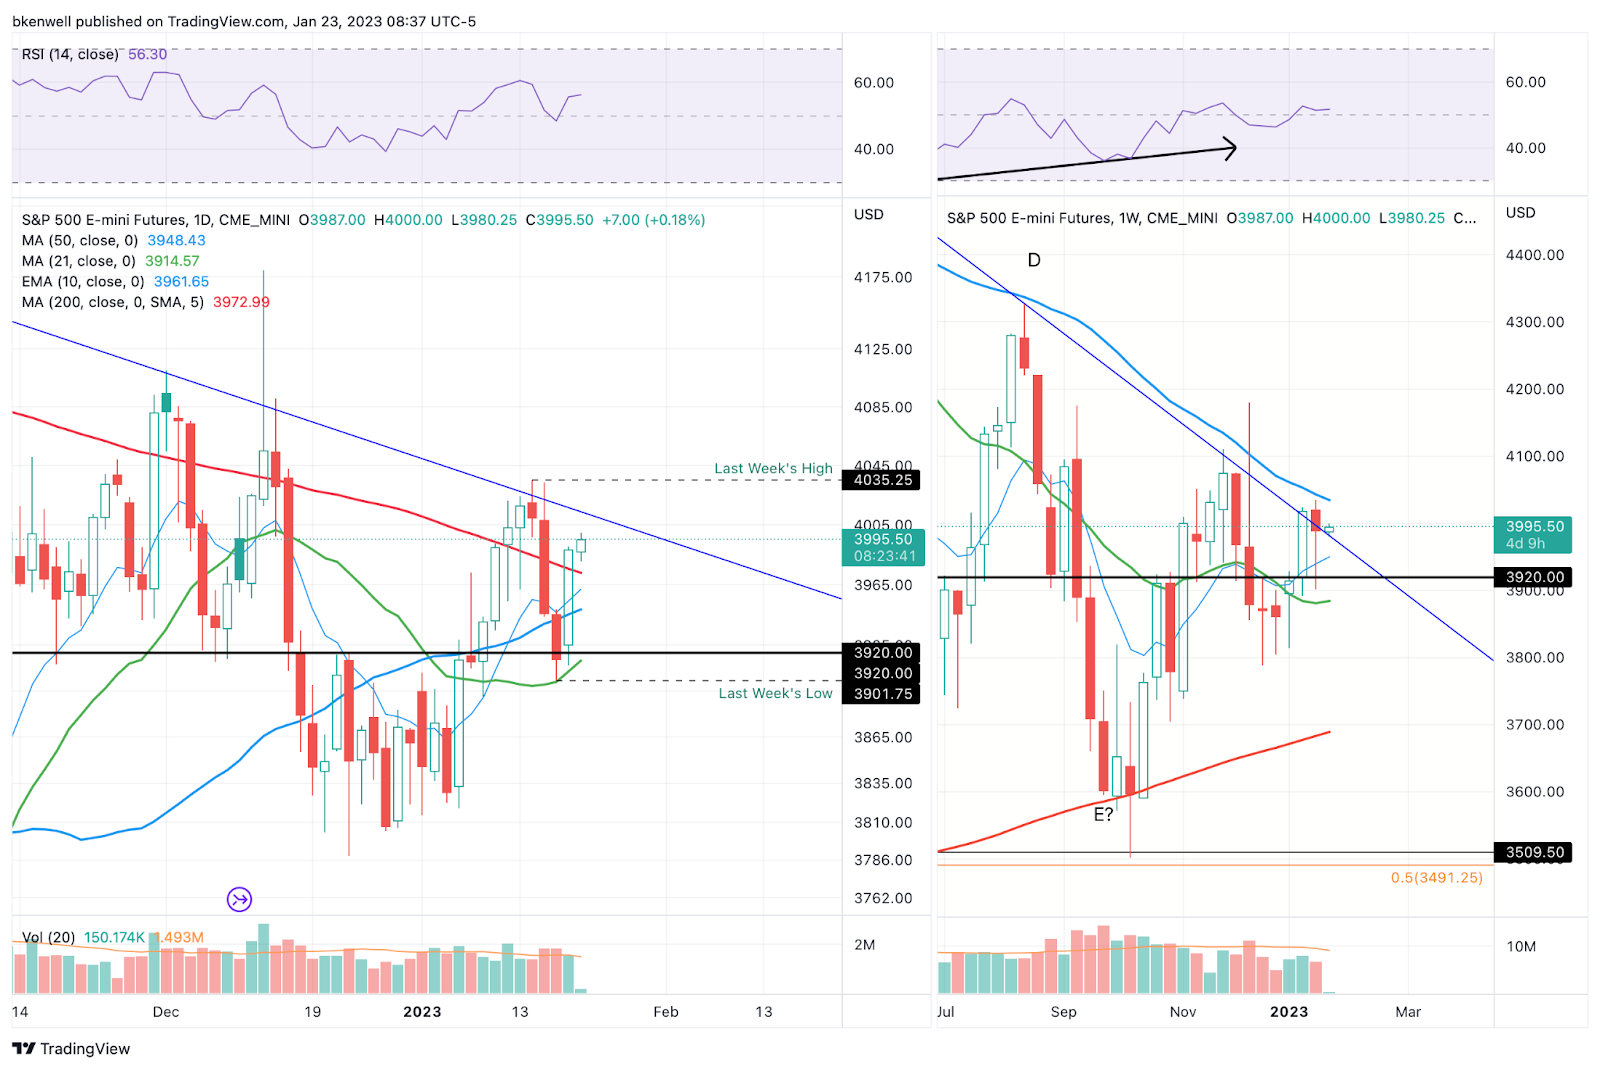
Friday was a great session for the bulls, as the S&P held the 3900 to 3920 area and charged higher. But let’s not forget the difficult couple of days that led to this session.
Above shows the daily chart on the left and the weekly chart on the right. The ES is still below the prior two weeks’ highs, as well as downtrend resistance and the 50-week moving average (which has been strong resistance).
While it’s working off a higher low — which is bullish — I think we need to keep in mind that this is still a market in a downtrend and patience is key!
If the ES can take out the 4030 to 4050 area, we could be looking at a much better move to the upside.
SPY — Zoomed In

As for an active sequence today, I don’t love the gap-up action following a big, late-day rally. With that, look for a sell-the-open reaction, particularly if it’s just above Friday’s high of $396.04.
A break of that could give us a cash-flow short, although only one that we’re looking to ride for some cash flow.
Ultimately, I am looking to buy the SPY or SPX into active support. If early in the session, I’m looking at the $394.25 to 394.75 area. If it’s a bigger overshoot, the 10-ema on the 30-min chart is my next focus.
Open Positions
A note: After talking to some members, I want to make the setups a bit more clear. We are a trade-ideas service but want to make entries & exits simpler to understand. We will be sending more updates, a few educational pieces, and looking for a way to make our setups more clear in how we are managing them.
- Numbered are the trades that are open.
- Bold are the trades with recent updates.
- Italics show means the trade is closed.
— Any positions that get down to ¼ or less (AKA runners) are removed from the list below and left up to you to manage. My only suggestion would be, B/E or better stops.
From this latest round, that includes TLT, DE and FSLR.
- COP — Long from $119, the 2x weekly-up. $124 to $127 could be a reasonable trim spot. Trimmed ¼ at the 50-day. We got our first trim & some messaged to say they got a second near yesterday’s HOD. (I didn’t).
- If you didn’t get out with a B/E stop, then stay disciplined with your original stop. Mine was $116.
- Tricky action so far. Feel free to cut down the position at any point while in the black or in the green. $116 stop proves prudent. $123.50+ and can cut down more.
- TJX — I am long from $81.40. $79 stop.
- MRK — Long from $108.75 — first target: $111 to $112.50. Stop at $106.75 to $107.
- NKE — Long from $124-ish — Trimmed ⅓ $126.50. Next trim $128. B/E stop
- GE — long from $76 — Trim some near the open, anything near yesterday’s HOD. Would still like to get some off near $78.50 to $79.
- Reports before the bell on Tuesday, so those in common stock will need to trim aggressively. Those in calls can trim too. Up to you whether you carry any into the event. I am long calls and will be down to ¼ or ⅓ before today’s close.
Go-To Watchlist
*Feel free to build your own trades off these relative strength leaders*
Relative strength leaders →
- SBUX
- TJX, ULTA, NKE
- CAT
- BA & Airlines — AAL, DAL, UAL
- GE
- CAH
- SMCI
- MRK — weekly
- FSLR
- XLE — XOM, CVX, COP, BP, EOG, PXD — (Weekly Charts)
Economic Calendar
None of note.
Comments are closed