Our View
To put things in perspective, the ES has closed lower for five sessions in a row and at yesterday’s low, it was down 235 points from the high made just last week. After a gap-and-go to the downside on Monday, the ES and NQ found their footing and made an impressive rally back up to the upside.
Last week the NQ suffered its largest one-week decline since last February. Yesterday the NQ sold off 516 points from its Globex high to its low and rallied 463 points off yesterday’s low to close higher on the day, erasing a 2.68% decline. That’s incredibly impressive!
As I have said, you can get one down day, you can get two down days and maybe even three down days in a row. BUT when you start getting four or five straight down days, the possibility of a reversal increases with each additional down day.
According to data from the CME Group, the futures show a 75% probability the Fed will raise rates in its March meeting.
The big economic data point this week is Wednesday’s inflation data, as consumer prices are expected to have risen more than 7% from a year earlier for the first time since 1982. The earnings season also kicks off this week with earnings from Citigroup, JPMorgan, Wells Fargo and BlackRock.
Our Lean
There has been a big drop in the S&P and Nasdaq this year in anticipation of higher interest rates. Generally when the sellers push the market lower long before the event, the markets rally.
That said, there have been many occasions when the stock market drops early in the year and then bounces, but I also think there will be many drops-and-pops this year. I hate to say it, but this is going to be a very long year for investors.
As for today, you can sell the early rallies and buy the pullbacks or just be patient and buy the drops. There should be follow-through strength from yesterday’s close, so let’s see how the gap is handled.
Daily Recap
The ES traded 4634 on the 9:30 futures open, down 48 points from the Globex high, but we were nowhere near done with the selling. While the S&P futures rallied 3.50 points off the open, they were aggressively sold lower, falling another 32 handles in the opening 30 minutes and 61 points down to the session low of 4572.50.
Yesterday I had said that if the ES loses 4650, then 4600 was on tap. Well, we didn’t even get a chance to “lose” 4650 in the regular trading hours. It has been a nasty couple of days.
From the low, the ES popped 36 points to 4609, back-and-filled 22.50 points down to 4686.50 and made a higher low. Then the ES was able to rip higher, clearing the 4609 level and came into 3:50 at 4645.50, up 59 handles from the afternoon low and up almost 73 points from the session low.
In the final 10 minutes, the ES tacked on another ~17 points, closing at 4662.25. The ES settled a quarter-point higher on the 5:00 futures close, down 5 points from Friday’s close or 0.11%.
In the End
It really felt like everyone got too far offside (short) and while the ES closed slightly lower on the day, the bulls have to feel like they escaped with a win. Most of the buying was short covering and buy stops once the rally started to gain momentum. However, sometimes this type of price action can lead to a low.
In terms of the ES’s overall tone, it was weak in the first half and firm in the second half. In terms of the ES’s overall trade, 2.15 million contracts traded on the day, so volume was high. As we all know, there’s no crystal ball when it comes to trading stocks, options, or futures. But the Market Imbalance Meter may be as close as it comes. Knowing how the “Big Money” is placing its bets can give our trading room a big wave to ride — or a warning sign to stay out of the water. Come check it out now, risk-free for 30 days.
As we all know, there’s no crystal ball when it comes to trading stocks, options, or futures. But the Market Imbalance Meter may be as close as it comes. Knowing how the “Big Money” is placing its bets can give our trading room a big wave to ride — or a warning sign to stay out of the water. Come check it out now, risk-free for 30 days.
Technical Breakdown
- NYSE Breadth: 61% downside volume
- NASDAQ Breadth: 54.3% downside volume
We came into the day looking for some type of bounce and in the first hour, we didn’t have much momentum working on the long side. We talked about looking for a reclaim of Friday’s low but we didn’t get that either.
Essentially, we had to rely on one thing that many traders struggle with — Patience — because the bounce eventually came (more on that below).
Given the wide range yesterday, I opted to trade the SPY and QQQ rather than ES and the NQ. In hindsight, perhaps these two would have been better vehicles given the robust rally we got after the market gave us a puke-job in the first hour.
But managing risk is rule No. 1 and as we all know, the futures can be a painful place to be if you’re wrong and stubborn.
By the way, here’s the kind of intraday action I’m looking for.

That undercut of the low at $457.36 and reclaim of this mark was the trigger to get long. I obviously did not expect to fill the gap, but that’s what we have now.
Game Plan
We are set to gap up and I like to alleviate some more of my long into that strength and then see how we go from there.
I will write a separate piece for premium subscribers about managing risk shortly.
Yesterday we also talked about the importance of last week’s low in the S&P 500. For now, we’re back above it, but this week’s low looms large and if we revisit it, this level has to hold or we certainly risk more downside.
S&P 500

On the daily S&P futures chart, you can see that the market is already fading from its Globex high. To be honest that’s normal and healthy, given the strength we rallied with yesterday.
On the upside, 4700 is the key area. Not only is it psychologically relevant, but that’s also near where the 10-day and 21-day moving averages come into play. Above that and 4740 is on the table.
On the downside, keep an eye on last week’s low near 4671. A break of that level that’s not reclaimed would have me more cautious.
Nasdaq

The QQQ was making a beeline for the 200-day moving average before it bottomed near $370, reversed and closed back above support. Wow, that’s impressive.
To my eye, I want to see the QQQ hold the December low near $377.50. If it can do that, bulls can remain long.
A break of this mark puts it below support and puts this week’s low back in play.
On a further upside push, the $385 to $387 area is in play, along with the 10-day moving average. The action was impressive on Monday, but we’re far from out of the woods right now.
Individual Stocks
I’m going to keep the watchlist here because some readers have expressed that the simplistic approach is their preferred method and that’s fine by me.
For what it’s worth, it can be hard doing just one daily update, given how wide the trading ranges can be (such as yesterday’s range). However, I try to be transparent in what I’m watching in real-time on Twitter. Feel free to follow me there.
Go-To List:
- Energy & Financials (too many to list but so strong)
- F — decent support off the 10-ema on the 4H chart. (Charted below)
- CVS
- ABBV
- TD
- KO (defensive)
- MDLZ (defensive)
- BRK.B
Ford
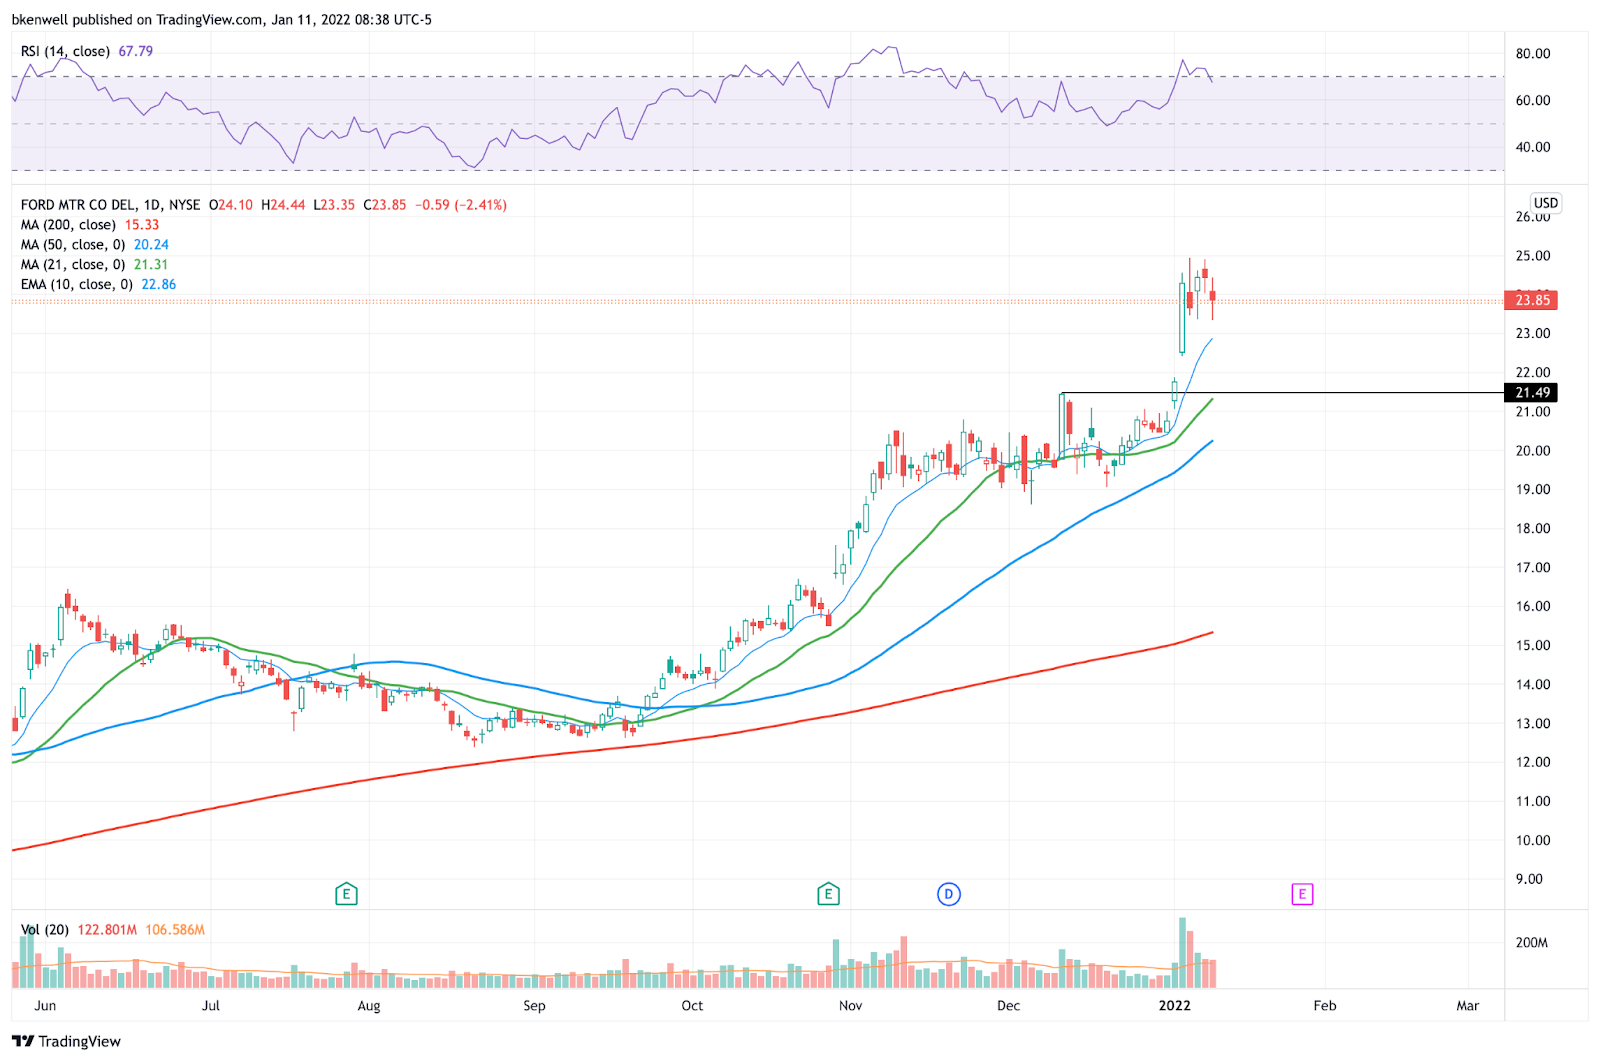
Ford is obviously getting a little tired. But I want to see how it handles a dip to the 10-day moving average after such a robust rally.
Failure to hold this short-term moving average could put the $21.50 level in play. On the upside, we’re looking for $25.
AMD
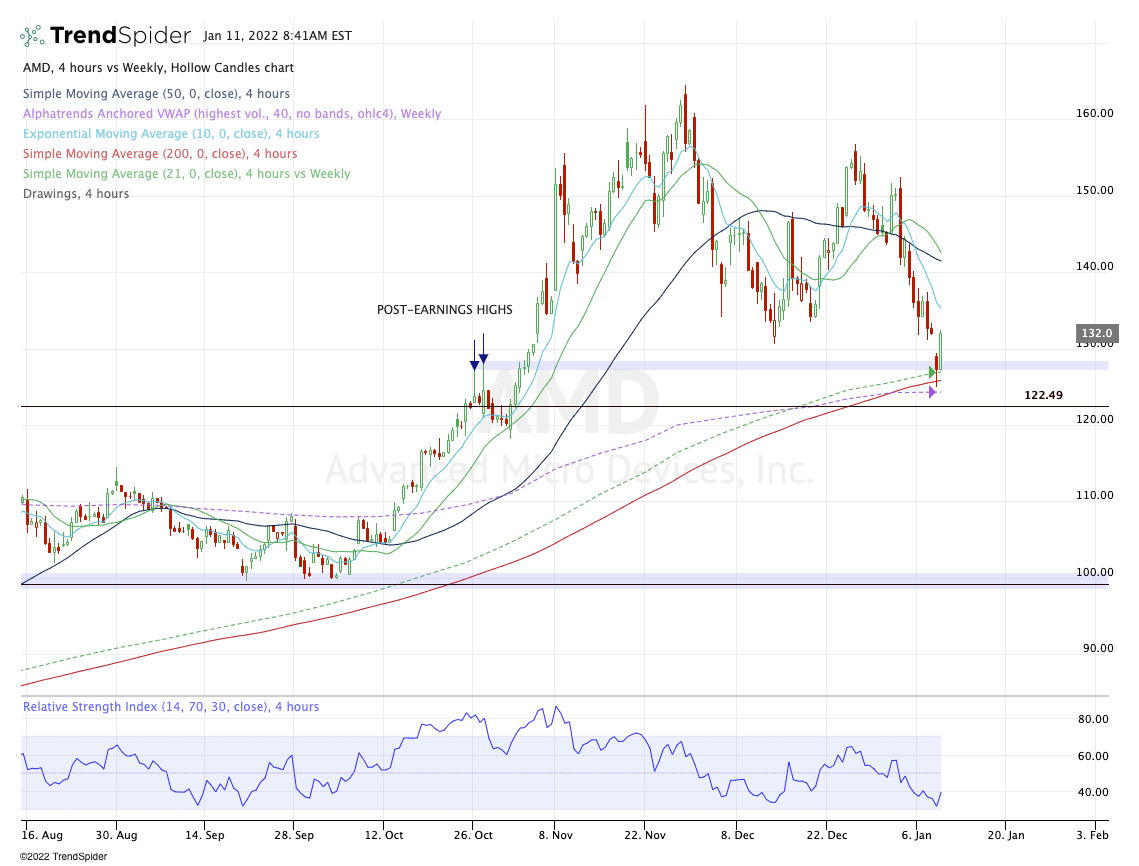
AMD is one of the stocks I got into yesterday early afternoon. Now we have to see if AMD can push higher, ideally toward the $137 to $138 area — the high from the prior two 4H wicks — and the declining 10-ema.
There’s a nice low to measure against, but if you have no position, it’s tough to enter now on the gap-up. Again, yesterday’s action makes it tough for new positions, given the wide range.
GM

Aggressive bulls will pile into GM near the open, given that it held the 10-day and isn’t soaring in the pre-market. Against yesterday’s low, those bulls will be looking for a daily-up rotation.
Some may even take some profit near yesterday’s high. However, the rotation could give GM life, as this stock was north of $67 just a few days ago.
UNP and CSX

If nothing else, I just wanted to highlight some of the strengths here in the railroad stocks.
Both are flat-to-lower in the premarket, which could give us a chance to undercut the lows. If that happens — much like the intraday SPY chart above — perhaps we can get a bullish reversal brewing.
If not, that’s fine too, but keep these stocks on your radar, as they have done pretty well lately.
Disclaimer: Charts and analysis are for discussion and education purposes only. I am not a financial advisor, do not give financial advice and am not recommending the buying or selling of any security.
Remember: Not all setups will trigger. Not all setups will be profitable. Not all setups should be taken. These are simply the setups that I have put together for years on my own and what I watch as part of my own “game plan” coming into each day. Good luck!
Economic Outlook

Comments are closed