Our View
The S&P snapped a five-day losing streak as stocks climbed higher. That’s despite the following:
- The U.S hitting new highs in Covid hospitalizations
- Fed Chairman Powell saying the economy no longer needs aggressive stimulus
- Fed gov. Bostic saying he was open to March rate increases.
It took five trading days for the ES to fall 235 points and 1.5 days to rally back 135 points. The NQ fell over 1400 points over the same period and rallied almost 700 points in 1.5 days.
To me this is another great example of people getting too negative/short on news that the markets already knew: The Fed is raising rates in March.
The S&P 500 never does what most people want it to do when they want it. Over the last two sessions, that was clear to see. After 4.5 days of falling, the ES and NQ futures have come roaring back to life.
Based on the MIM, the rally has been a combination of four things: New money being put to work in stocks, short-covering, buy stops and buy programs.
I am going to keep this short and sweet. I said two days ago that I did not think the current selloff was a jumpstart to my call for a +15% correction this year. Further, I said to look for a low this week in front of the January options expiration.
Let’s revisit that.
Our Lean
Since 1983, the S&P has risen an average of 5.3% in the first three months before the first rate increase and has been followed by another 5.3% gain over the next six months. However, there is no denying that traders remain on edge.
Rate increases usually slow economic growth. But — and there is always a but — even if the Fed raises rates four times this year as Goldman thinks, rates will be around 1% to 1.25%, which is still historically low.
I still think this year is going to be filled with wild swings and end up closing on the highs of the year, but we have a lot of time between now and then.
Our Lean is to sell the early rallies (again) and patiently buy the pullbacks. It’s a simple concept, and some people don’t like that, but that approach was a huge winner for us on Tuesday.
Here is the link to the Ned Davis S&P cash study for the January expiration.
Daily Recap
The ES rallied all the way up to 4688.25 on Globex but opened near 4660 on the 9:30 ET futures open.
From there, what do you think happened? They sold the gap-up open (which is no surprise at all — that was in the Our Lean plan).
The ES traded down to 4727.25 at 10:00, down 32 points from the open, then rallied 30 points up to 4657 at 10:33. Another pullback sent the ES back down to 4630.50 at 11:03 and gave bulls a higher low.
I want to point out that the PitBull has always taught me to watch for buy and sell programs into the half hours and this is a prime example.
After the higher low, the ES started getting hit by several buy programs and shot up to 4687.50 at 11:45, up 60.25 points off the low of the day. From there, we got a double top near 4693 just before 2:00 and then pulled back down to 4683.50 at 2:15.
The midafternoon action was slow, but the breadth was too strong (more on that below) and the bears couldn’t crack the S&P, which gradually traded up to a new high at 4701 going into 3:00.
After a couple of small pullbacks, the ES traded 4704.25 at 3:33. The ES traded 4699 as the 3:50 cash imbalance showed $456 million to buy, dipped to 4692.50 at 3:51 and then surged ahead to 4705 on the 4:00 cash close.
After 4:00, the ES made new highs at 4707.50 and settled at 4704.25 on the 5:00 futures close, up 41.50 points or +0.9% on the day.
In the End
In terms of the ES’s and NQ’s overall tone, they were extremely firm after the early morning selloff. In terms of the day’s overall trade, volume was high at 1.69 million contracts traded.
Crude oil jumped ~$3.00 to $81.69 and the yield on the 10-year fell to 1.745% after settling at a 52-week high Monday at 1.779%. That was its largest one-day decline since mid-December.
As we all know, there’s no crystal ball when it comes to trading stocks, options, or futures. But the Market Imbalance Meter may be as close as it comes. Knowing how the “Big Money” is placing its bets can give our trading room a big wave to ride — or a warning sign to stay out of the water. Come check it out now, risk-free for 30 days.
Technical Breakdown
- NYSE Breadth: 84.5% downside volume
- NASDAQ Breadth: 76.7% downside volume
Monday was a bullish reversal and Tuesday was a strong breadth continuation day, with the NYSE clocking in with an 80%+ upside day and the S&P 500 going out at the session high.
Tuesday’s action was good because they sold the gap-up open, giving bulls a chance to get long.
These quick and strong reversals are tough to navigate in many ways because if you miss the initial move, the risk becomes too wide and it’s hard to get long. Then the market moves on without you, creating a sense of FOMO.
If you have been able to make money in this environment — or hell, even just not lose money — then kudos. It hasn’t been easy sledding.
Game Plan
The question now becomes, do we get a Day 3 — that is, a third follow-through day — or will there be some chop?
Today’s CPI report could play a big role in how the market behaves today. Out-of-control inflation is
A. not what traders want to hear from an economic standpoint, and
B. strengths the Fed’s case for additional rate hikes.
S&P 500

The S&P 500 index traded down through the 50-day, but once again found its footing at the 21-week moving average and uptrend support (blue line).
As we’ve talked about before, this is a balancing act of juggling the current pullback amid what is still a longer-term uptrend. The market is still putting in a series of higher lows and higher highs. The action is moving from the lower left to the upper right and while the downside action is fast, furious, and painful, we must keep the “bigger picture” trends in mind.
While the S&P seemed to regain the 50-day with ease, it must now contend with the 4720 area, which has been pretty significant over the last few months. Just look at how it has reacted to this level on the charts.
Additionally, we have the 10-day and 21-day moving averages near this level.
Above these marks is good. Below and we have to remain tactical.
10-Year Rates

Now pulling back a bit off the 200-week/50-month combo, will the TNX find its footing near 1.69% or do we have a deeper pullback in store? If it can’t find its footing here, the 1.50% area could be on deck, which would do wonders for tech/growth stocks.
If it finds its footing near 1.69%, then we have to wonder if it can retest or even take out the recent high.
Individual Stocks — ARKK, Energy, GM & More
I run scans each night, tailored to my trading style and what I’m looking for. I can’t emphasize enough that as long as energy prices are rising, energy stocks will continue to dominate the list.
The one-week and one-month sector view does all the talking:

Go-To List:
- Energy & Financials (too many to list but so strong) This remains atop the list
- F
- ABBV
- TD
- MU — Inside day
- QCOM — great weekly chart.
- CVS — very strong, but not loving the doji candle up there on bearish divergence. An ugly look and I’ll chart it below.
ARKK

Everyone loved to love ARKK and now they love to hate ARKK.
We’re just here to trade it.
On Monday, the ETF reclaimed last week’s low at $82.65 and we called this out in real-time on Twitter. Sorry, it can’t be done here!
In any regard, it reclaimed that low with bullish divergence, adding to the confidence in the trade. With a strong continuation on Tuesday, the trade bolstered profits, but we have to remember the long-term trend right now, which has been lower.
We don’t want to short everything in our path because we’ll eventually get our heads ripped off in a short squeeze.
However, don’t overlook the $89 to $90 area and the declining 10-day moving average. At the very least, this is an area to book some profits and raise stops. It may even warrant taking a short position, depending on how the market, QQQ, and rates are trading.
BIIB

The $220 area has been significant if you pull up a chart of BIIB and zoom out. More recently, $221.72 was the low, and BIIB is gapping below that mark now.
A gap below and push back up through this mark could give us a bullish reversal trigger. It will help if it comes with some bullish divergence on the RSI.
CVS

Like I said, I’m not loving that doji bar up there at new highs, failing to close above the prior high and doing so with bearish divergence.
It doesn’t mean the run is over necessarily, but that’s waving a caution flag for me.
GM
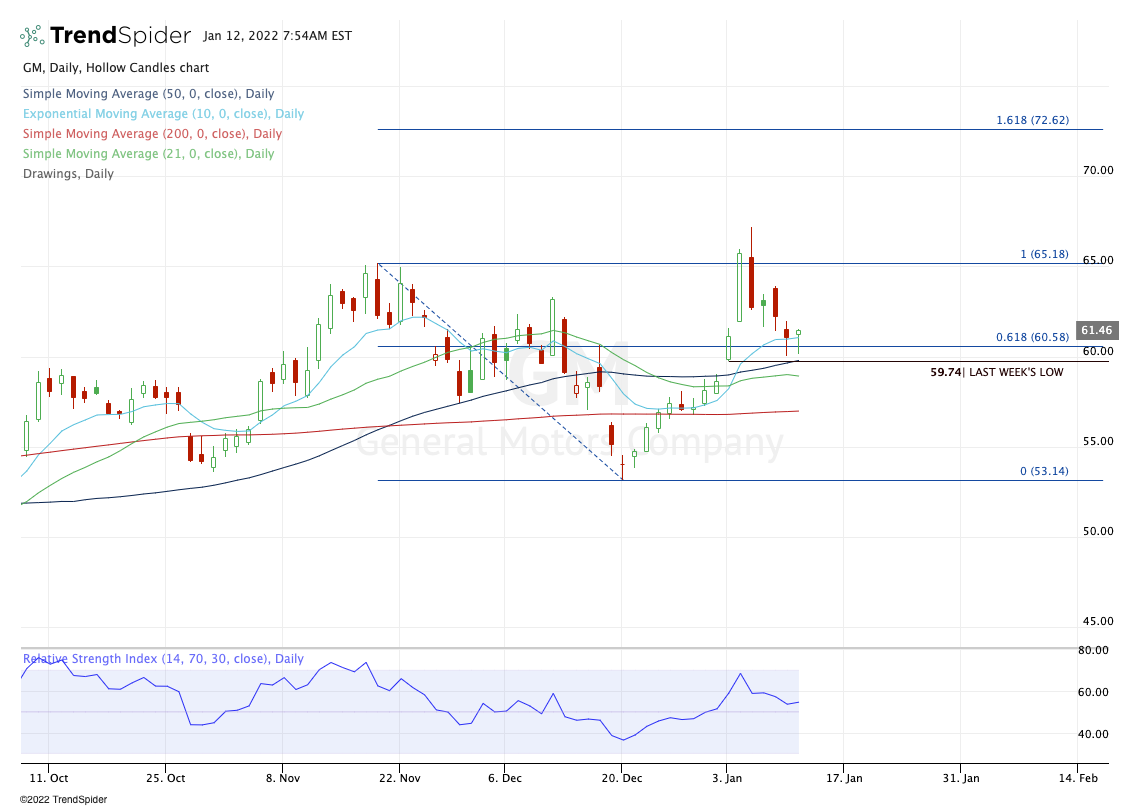
We have been all over Ford and then threw GM into the mix yesterday. We had an inside day in the stock, so those that are already long, they’ll want to see an upside push today.
For those that aren’t long, they’re looking for one of two things:
- An inside-and-up daily rotation over Tuesday’s high, or
- An undercut of the two-day low (or Tuesday’s low) and a reclaim of said low.
The undercut is a nice strategy because we also have the 50-day moving average nearby, as well as the prior week’s low.
Regardless, if we get the upside rotation, we’re talking about a nice little reset after a big upside pop.
UNP

After a nice run, UNP has had two big down days in a row. An undercut of Tuesday’s low could get us a test of the 50-day and uptrend support, while a move back up through Tuesday’s low gives us a bullish reversal with measured risk.
We may not get the setup and that’s okay. But if we do, know it.
PG

P&G has been a monster and at one point, had ripped off 10 straight weekly gains.
We got a bounce yesterday off the lows, but let’s see if this stock can test and hold its 10-week moving average. If it can, it may be worth a shot.
Disclaimer: Charts and analyses are for discussion and education purposes only. I am not a financial advisor, do not give financial advice and am not recommending the buying or selling of any security.
Remember: Not all setups will trigger. Not all setups will be profitable. Not all setups should be taken. These are simply the setups that I have put together for years on my own and what I watch as part of my own “game plan” coming into each day. Good luck!
Economic Outlook

=
Comments are closed