Our View
While most people are on vacation, grilling out, swimming, boating, camping, and visiting family in the US, the people of China are beating the war drums on Pelosi’s trip to Taiwan. On Saturday morning I got a text from Kun Wang.
Kun is a Chinese national whom I helped set up a trip to see the NYSE and CME and visit me in Florida. His message came with a video of the Chinese doing a live fire drill over the contested South China Sea that came with the message that said, “Dress Rehearsal for Pelosi’s visit.”
He said the military is on high alert and that the Chinese people want their military to teach the US a lesson. Over 5 months ago I said that the situation between China and Taiwan could become a problem. This was shortly after the Russia/Ukraine situation came to be.
But from a trader’s perspective, there were so many other things to focus on that a geopolitical hypothetical was the least of our worries. Well, here we are now with tensions climbing higher as House Speaker Nancy Pelosi is set to visit Taiwan, which seems like a stupid misadventure.
I am not saying the Pelosi visit will start a full-fledged war, but this would be an easy way to increase tensions when we don’t need any more problems. The Chinese would love for an excuse to increase its presence in the South China Sea.
I think it would be better to have direct talks with Beijing than go to war over a visit by Pelosi.
Our Lean
As I said yesterday, I am still looking for a 50 to 70-point pull back and as of this morning, I have about 60 points of it. War and defense spending can amount to a sizable portion of the U.S. GDP, but wars often have little sustained impact on stock markets or economic growth at home.
Markets largely have ignored recent conflicts related to the Middle East and Iran. But China is not Iran — and the market has not ignored Russia/Ukraine. It ignores what it can, but if the players are too big, it can’t help but take notice.
Our lean is not to get overly rambunctious about a war breaking out today, but to be on guard for some threatening headlines and military posturings, which could create further weakness. Sell the rips and buy the dips is how I’m playing this.
Daily Recap

The ES opened Monday’s regular session at 4105.25, traded 4097 at 9:33, and then rallied 44.5 points up to 4141.50 at 10:06. From there, it sold back down to 4113.25 at 10:28. After the low the ES traded up to a new daily high at 4147.25 at 11:01, pulled back down to the 4128 level, rallied up to a lower high at 4146.75 and then dropped down to 4103.50 at 1:49.
After the drop, the ES fell into a grinding sideways-to-higher back-and-fill pattern that pushed the ES all the way up to 4131.50 at 3:30 and then dropped down to 4112.75 at 3:34, then back up to 4125 at 3:49. The ES traded 4124.50 as the 3:50 cash imbalance showed $2.1 billion to buy and then sold off down to 4117.50 at 3:56 and settled at 4123 at 5:00, down 10.5 points or -0.25% on the day.
In the end, the S&P was held captive to the Pelosi / Taiwan headlines. In terms of the ES’s overall tone, it was weakish. In terms of the ES’s overall trade, volume was steady at 1.7 million contracts traded.
- Daily Range: 50.25 points
- H: 4147.25
- L: 4097
Technical Edge
- NYSE Breadth: 46% Upside Volume
- NASDAQ Breadth: 57% Upside Volume
- VIX: ~$24
Game Plan: ES Futures, S&P 500, NQ Futures
Monday was a choppy, cautious session as tensions rise surrounding the Nancy Pelosi/Taiwan situation.
Tuesday looks to be starting off in a risk-off nature as well, with the situation above acting as the “excuse” needed for a short-term breather. For now anyway, that action seems healthy.
I will have a follow-up email with some individual stock setups. For now, enjoy the look at the indices. Cheers
S&P 500 — ES

I’m keeping an eye on yesterday’s low at 4097, as well as the 4100 level. If we go daily-down below this zone and fail to reclaim it, we could be looking at a bit more downside.
Will this be the rug pull?
That’s not what I’m speculating; I just want to go from level to level. If we do push lower, I think that is somewhat healthy.
It will have me watching 4000 to 4020, where we find the 10-day, 10-week, and key breakout area of this recent move. Below 4000 puts 3930 to 3940 in play.
On the upside, 4140 to 4150 is resistance for now.
S&P 500 — SPX

We always look at SPY so why not the SPX instead? Clear resistance at the 50% retrace so far.
Just like the ES, I think a pullback to the 4000 area would be a very good opportunity to see which side is going to take momentum.
If the SPX can clear 4175, it opens the door to 4250. But I don’t see that happening today.
Nasdaq — NQ
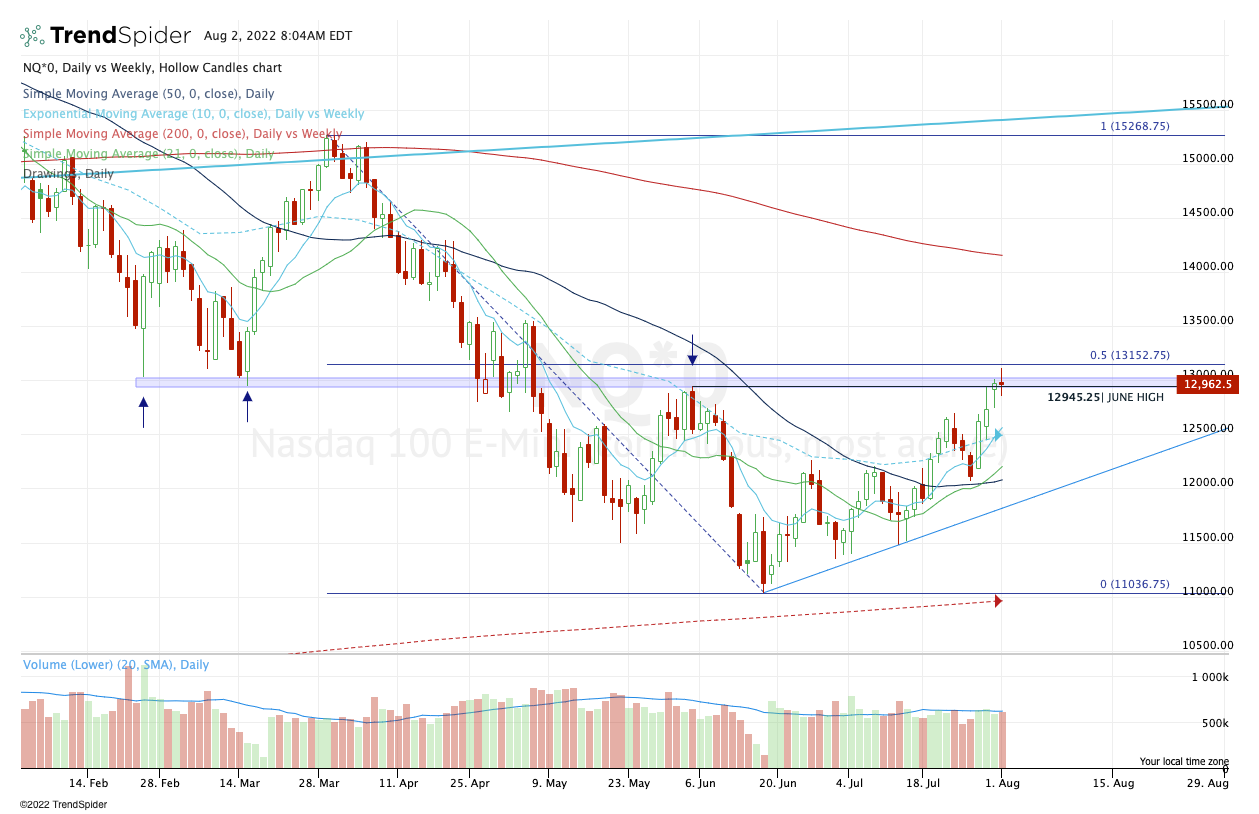
Over 13,150 could put 13,500 to 13,650 in play.
Like the ES 4000 though, a pullback to the 12,650 to 12,680 zone, then the 12,500 zone would be healthy for the NQ. If support comes into play where it should, then bulls can remain in control for the short term.
Go-To Watchlist — Individual Stocks
*Feel free to build your own trades off these relative strength leaders*
- Numbered are the ones I’m watching most closely.
- Bold are the trades with recent updates.
- Italics show means the trade is closed.
Trade Sheets: Now have 2-3 live trades, all with breakeven or better stop-losses. Great stress-free position to be in as we try to squeeze a bit more of upside out of this move.
- MCK — We have hit two trim zones so far on MCK. Feel free to cash the last ⅓ of the position as you see fit.
- Moving stop-loss up to $325 and given the consolidation, I am thinking of holding my last ⅓ for a push to $348 to $350.
- PEP — We got out Target No. 2 at $177. Either all out now or down to ⅓ of a position if playing for a breakout.
- COST — It’s okay to keep a runner or ¼ to ⅓ of a position in this. That was not my intention, so as noted yesterday, I cashed out the remainder of the position in the $545 to $550 zone.
Relative strength leaders (List is cleaned up and shorter!) →
- O
- CNC
- HRB
- ENPH — kickstarted the rally in Solar
- TAN
- FSLR
- MSTR
- LNG
- PWR
- CHNG
- COST — trade is live
- PEP — trade is live
- BA
- UNH
- XLE
- MCK — trade is live
Economic Calendar

As we all know, there’s no crystal ball when it comes to trading stocks, options, or futures. But the Market Imbalance Meter may be as close as it comes. Knowing how the “Big Money” is placing its bets can give our trading room a big wave to ride — or a warning sign to stay out of the water. Come check it out now, risk-free for 30 days.
Comments are closed